Quantcast
Channel: Severalnines
Viewing all 1476 articles
Browse latest View live

Announcing ClusterControl 1.7.1: Support for PostgreSQL 11 and MongoDB 4.0, Enhanced Monitoring

$
0
0

We are excited to announce the 1.7.1 release of ClusterControl - the only management system you’ll ever need to take control of your open source database infrastructure!

ClusterControl 1.7.1 introduces the next phase of our exciting agent-based monitoring features for MySQL, Galera Cluster, PostgreSQL & ProxySQL, a suite of new features to help users fully automate and manage PostgreSQL (including support for PostgreSQL 11), support for MongoDB 4.0 ... and more!

Release Highlights

Performance Management

  • Enhanced performance dashboards for MySQL, Galera Cluster, PostgreSQL & ProxySQL
  • Enhanced query monitoring for PostgreSQL: view query statistics

Deployment & Backup Management

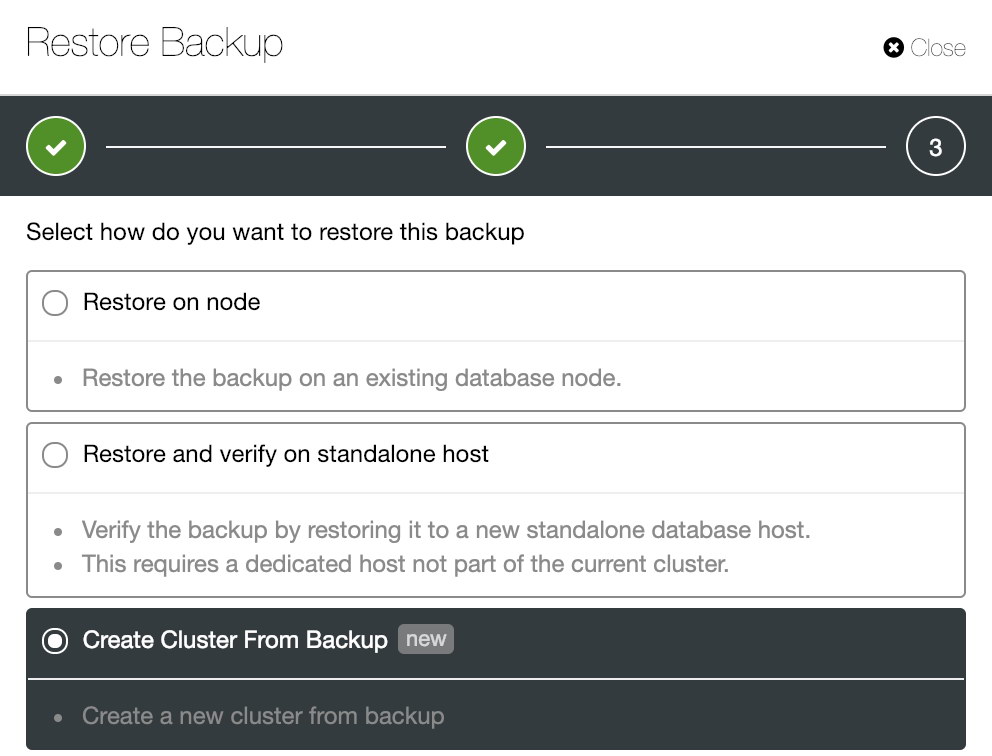
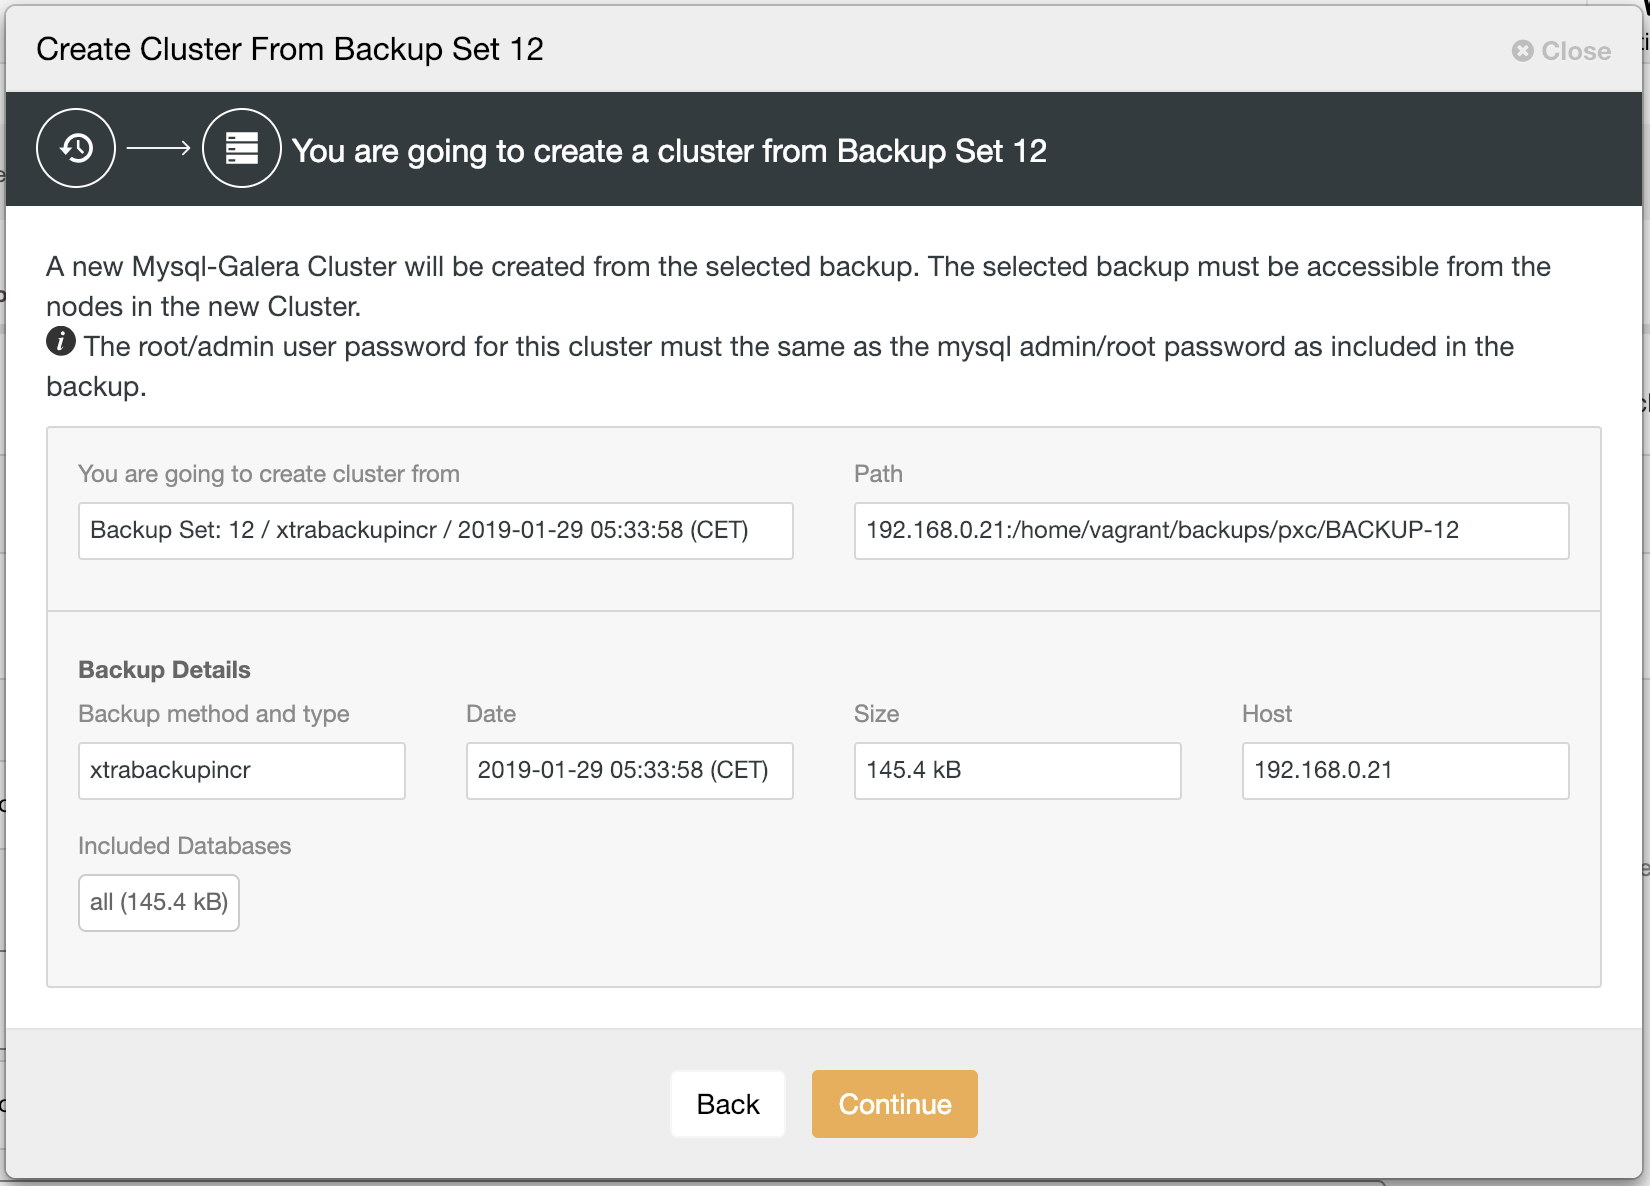
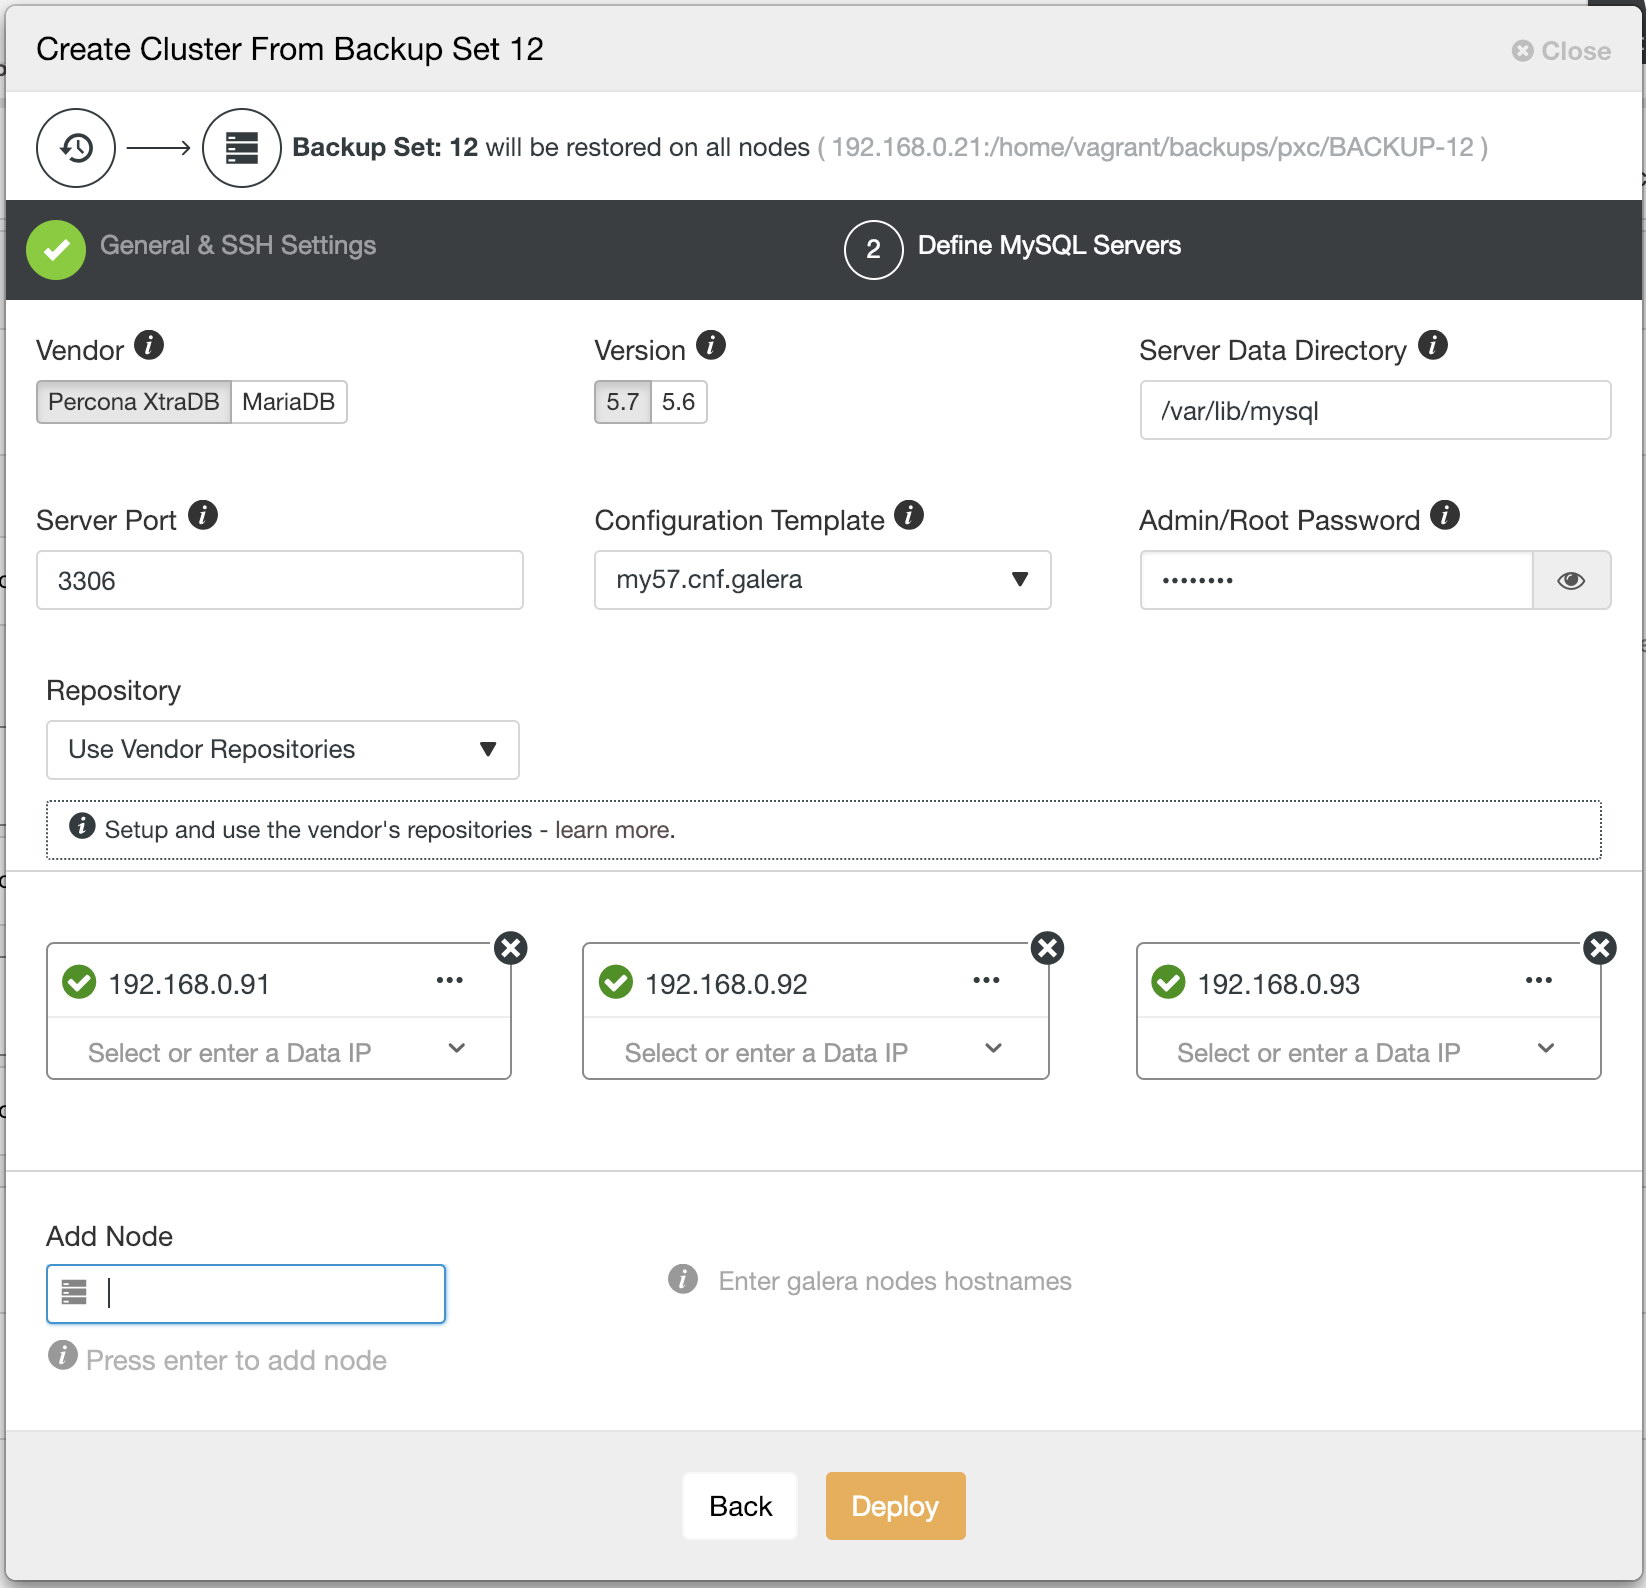
  • Create a cluster from backup for MySQL & PostgreSQL
  • Verify/restore backup on a standalone PostgreSQL host
  • ClusterControl Backup & Restore

Additional Highlights

  • Support for PostgreSQL 11 and MongoDB 4.0

View the ClusterControl ChangeLog for all the details!

ClusterControl
Single Console for Your Entire Database Infrastructure
Find out what else is new in ClusterControl

View Release Details and Resources

Release Details

Performance Management

Enhanced performance dashboards for MySQL, Galera Cluster, PostgreSQL & ProxySQL

Since October 2018, ClusterControl users have access to a set of monitoring dashboards that have Prometheus as the data source with its flexible query language and multi-dimensional data model, where time series data is identified by metric name and key/value pairs.

The advantage of this new agent-based monitoring infrastructure is that users can enable their database clusters to use Prometheus exporters to collect metrics on their nodes and hosts, thus avoiding excessive SSH activity for monitoring and metrics collections and use SSH connectivity only for management operations.

These Prometheus exporters can now be installed or enabled Prometheus on your nodes and hosts with MySQL, PostgreSQL and MongoDB based clusters. And you have the possibility to customize collector flags for the exporters (Prometheus), which allows you to disable collecting from MySQL's performance schema for example, if you experience load issues on your server.

This allows for greater accuracy and customization options while monitoring your database clusters. ClusterControl takes care of installing and maintaining Prometheus as well as exporters on the monitored hosts.

With this 1.7.1 release, ClusterControl now also comes with the next iteration of the following (new) dashboards:

  • System Overview
  • Cluster Overview
  • MySQL Server - General
  • MySQL Server - Caches
  • MySQL InnoDB Metrics
  • Galera Cluster Overview
  • Galera Server Overview
  • PostgreSQL Overview
  • ProxySQL Overview
  • HAProxy Overview
  • MongoDB Cluster Overview
  • MongoDB ReplicaSet
  • MongoDB Server

Do check them out and let us know what you think!

MongoDB Cluster Overview
HAProxy Overview
HAProxy Overview

Performance Management

Advanced query monitoring for PostgreSQL: view query statistics

ClusterControl 1.7.1 now comes with a whole range of new query statistics that can easily be viewed and monitored via the ClusterControl GUI. The following statistics are included in this new release:

  • Access by sequential or index scans
  • Table I/O statistics
  • Index I/O statistics
  • Database Wide Statistics
  • Table Bloat And Index Bloat
  • Top 10 largest tables
  • Database Sizes
  • Last analyzed or vacuumed
  • Unused indexes
  • Duplicate indexes
  • Exclusive lock waits
Table Bloat & Index Bloat

Deployment

Create a cluster from backup for MySQL & PostgreSQL

To be able to deliver database and application changes more quickly, several tasks must be automated. It can be a daunting job to ensure that a development team has the latest database build for the test when there is a proliferation of copies, and the production database is in use.

ClusterControl provides a single process to create a new cluster from backup with no impact on the source database system.

With this new release, you can easily create MySQL Galera or PostgreSQL including the data from backup you need.

Backup Management

ClusterControl Backup/Restore

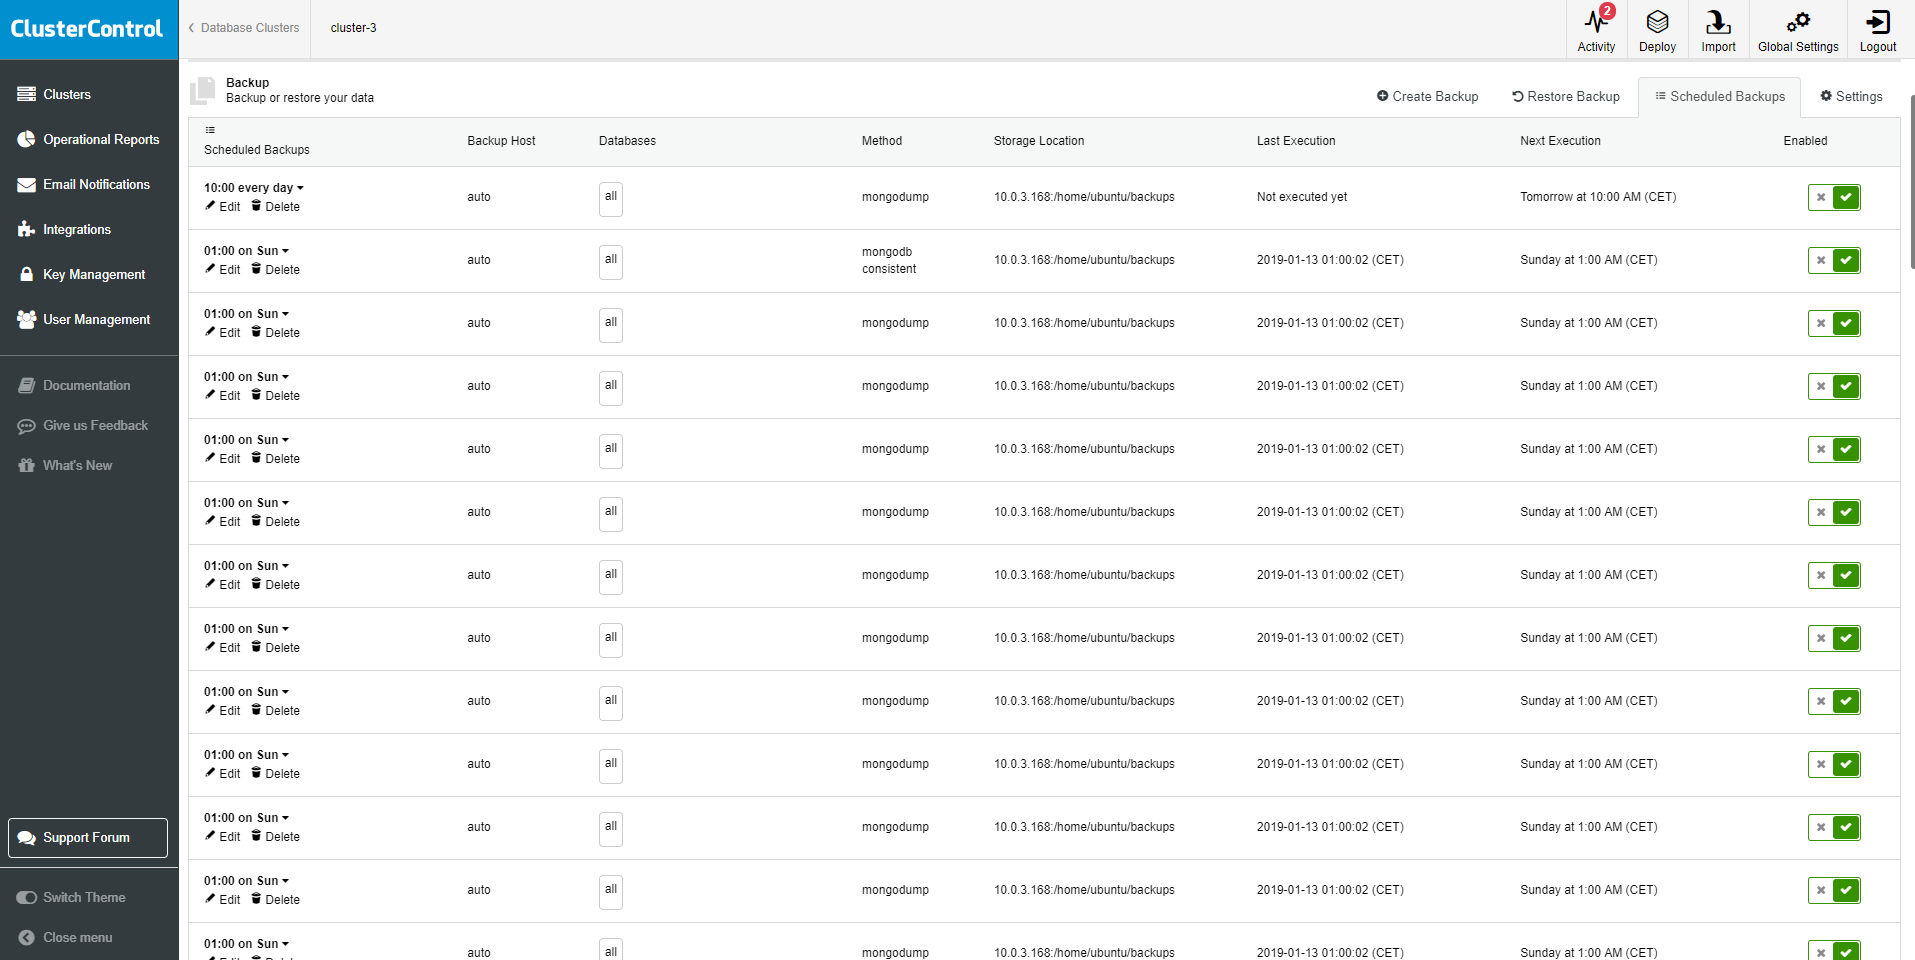
ClusterControl users can use this new feature to migrate a setup from one controller to another controller; and backup the meta-data of an entire controller or individual clusters from the s9s CLI. The backup can then be restored on a new controller with a new hostname/IP and the restore process will automatically recreate database access privileges. Check it out!

Additional New Functionalities

View the ClusterControl ChangeLog for all the details!

Download ClusterControl today!

Happy Clustering!


Deploying and Managing PostgreSQL 11: New in ClusterControl 1.7.1

$
0
0

A few days ago was the release of a new version of ClusterControl, the 1.7.1, where we can see several new features, one of the main ones being the support for PostgreSQL 11.

To install PostgreSQL 11 manually, we must first add the repositories or download the necessary packages for the installation, install them and configure them correctly, depending on our infrastructure. All these steps take time, so let’s see how we could avoid this.

In this blog, we will see how to deploy this new PostgreSQL version with a few clicks using ClusterControl and how to manage it. As pre-requisite, please install the 1.7.1 version of ClusterControl on a dedicated host or VM.

Deploy PostgreSQL 11

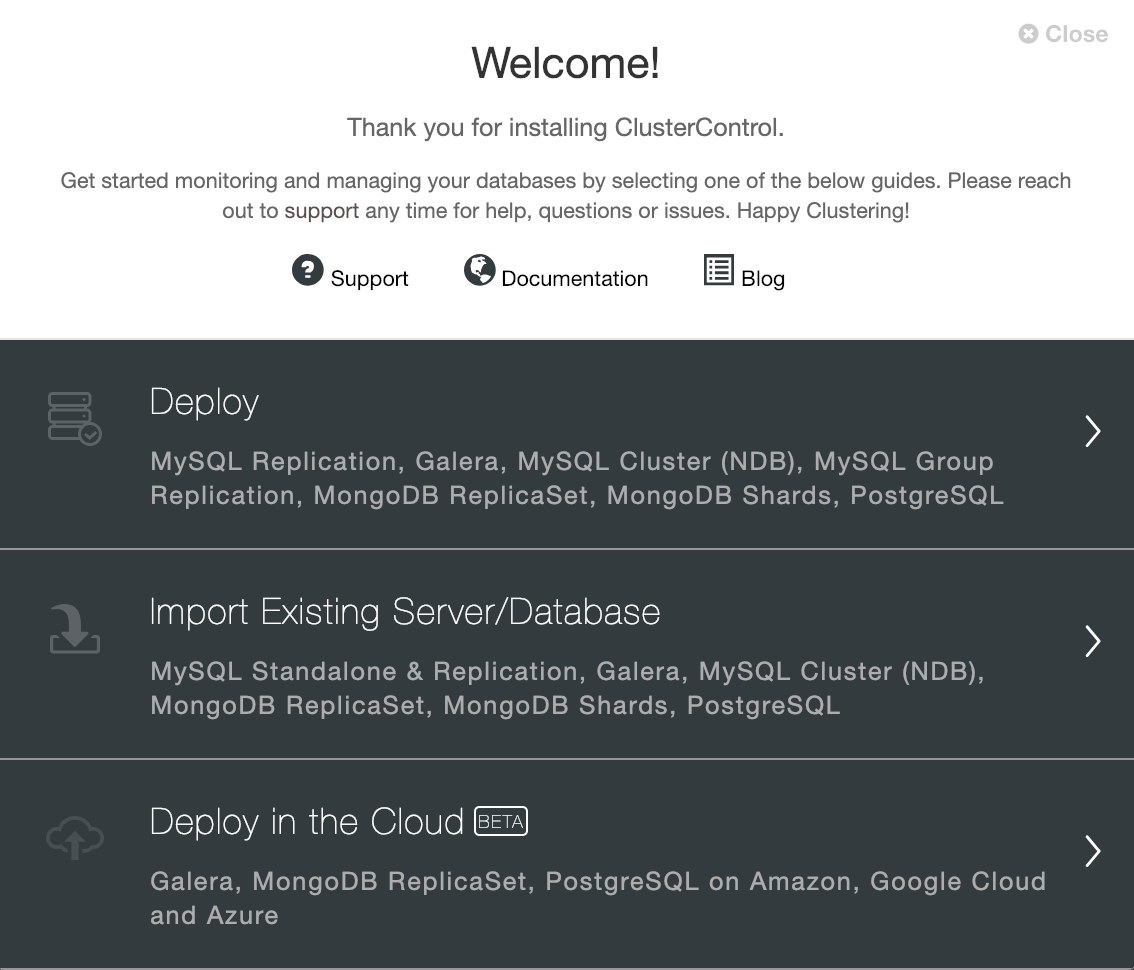
To perform a new installation from ClusterControl, simply select the option “Deploy” and follow the instructions that appear. Note that if you already have a PostgreSQL 11 instance running, then you need to select the ‘Import Existing Server/Database’ instead.

ClusterControl Deploy Option

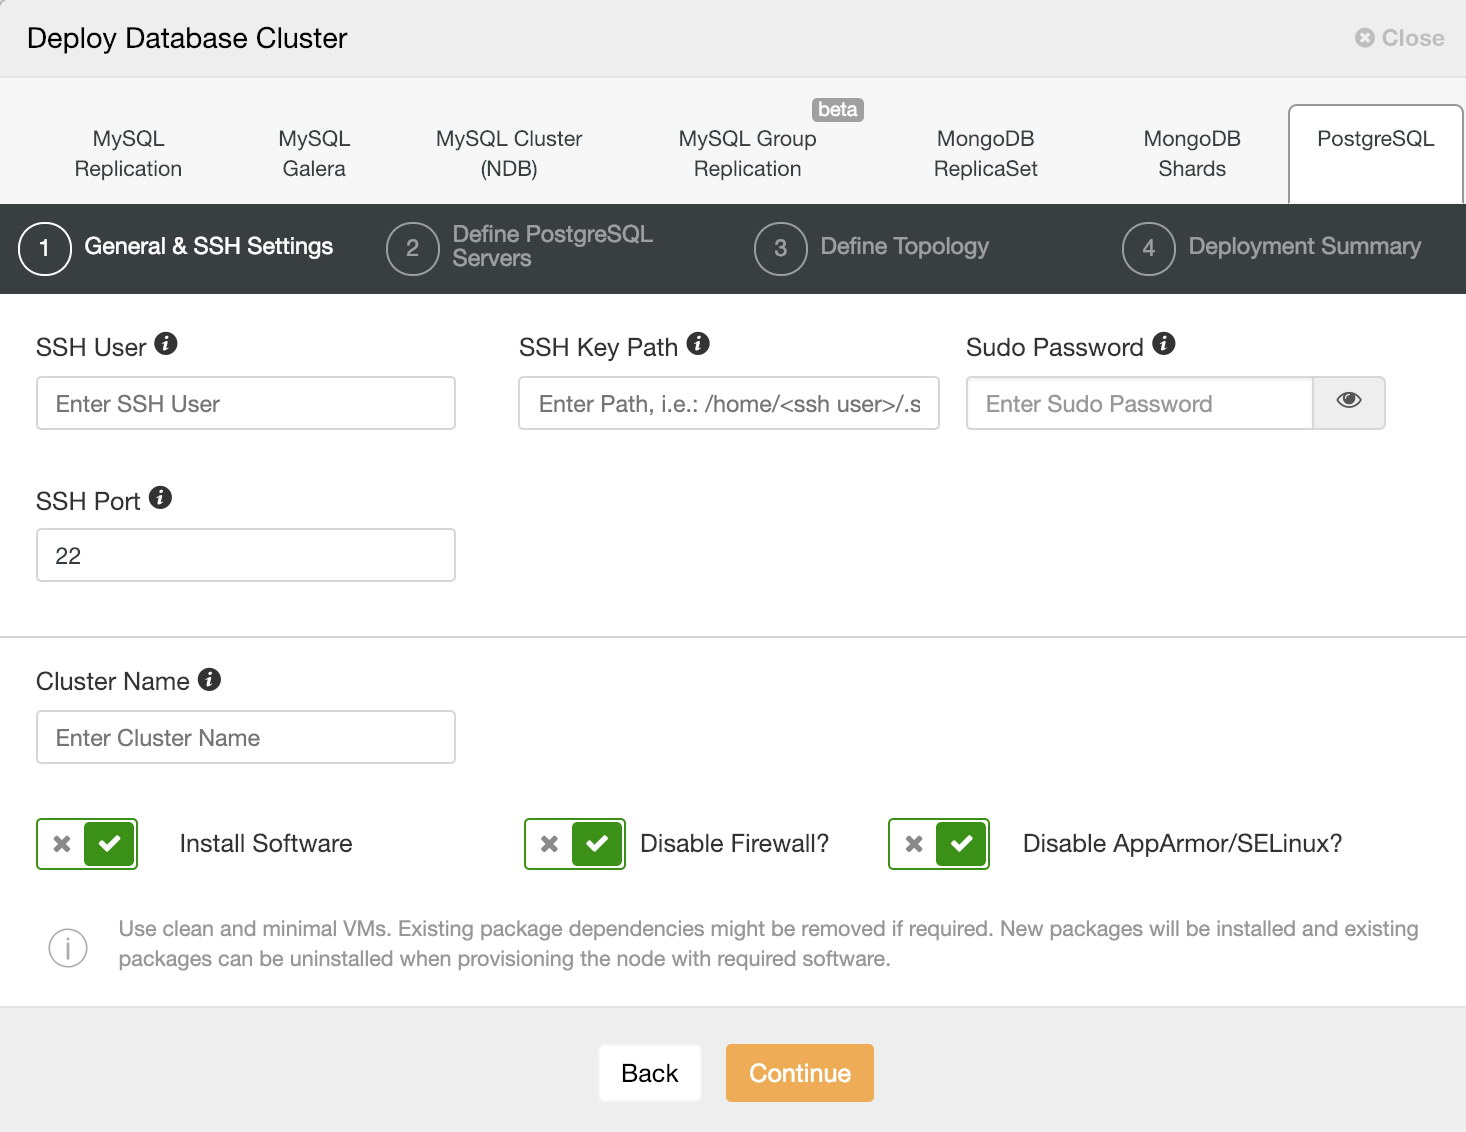
When selecting PostgreSQL, we must specify User, Key or Password and port to connect by SSH to our PostgreSQL hosts. We also need the name for our new cluster and if we want ClusterControl to install the corresponding software and configurations for us.

ClusterControl Deploy Information 1

Please check the ClusterControl user requirement for this task here.

ClusterControl Deploy Information 2

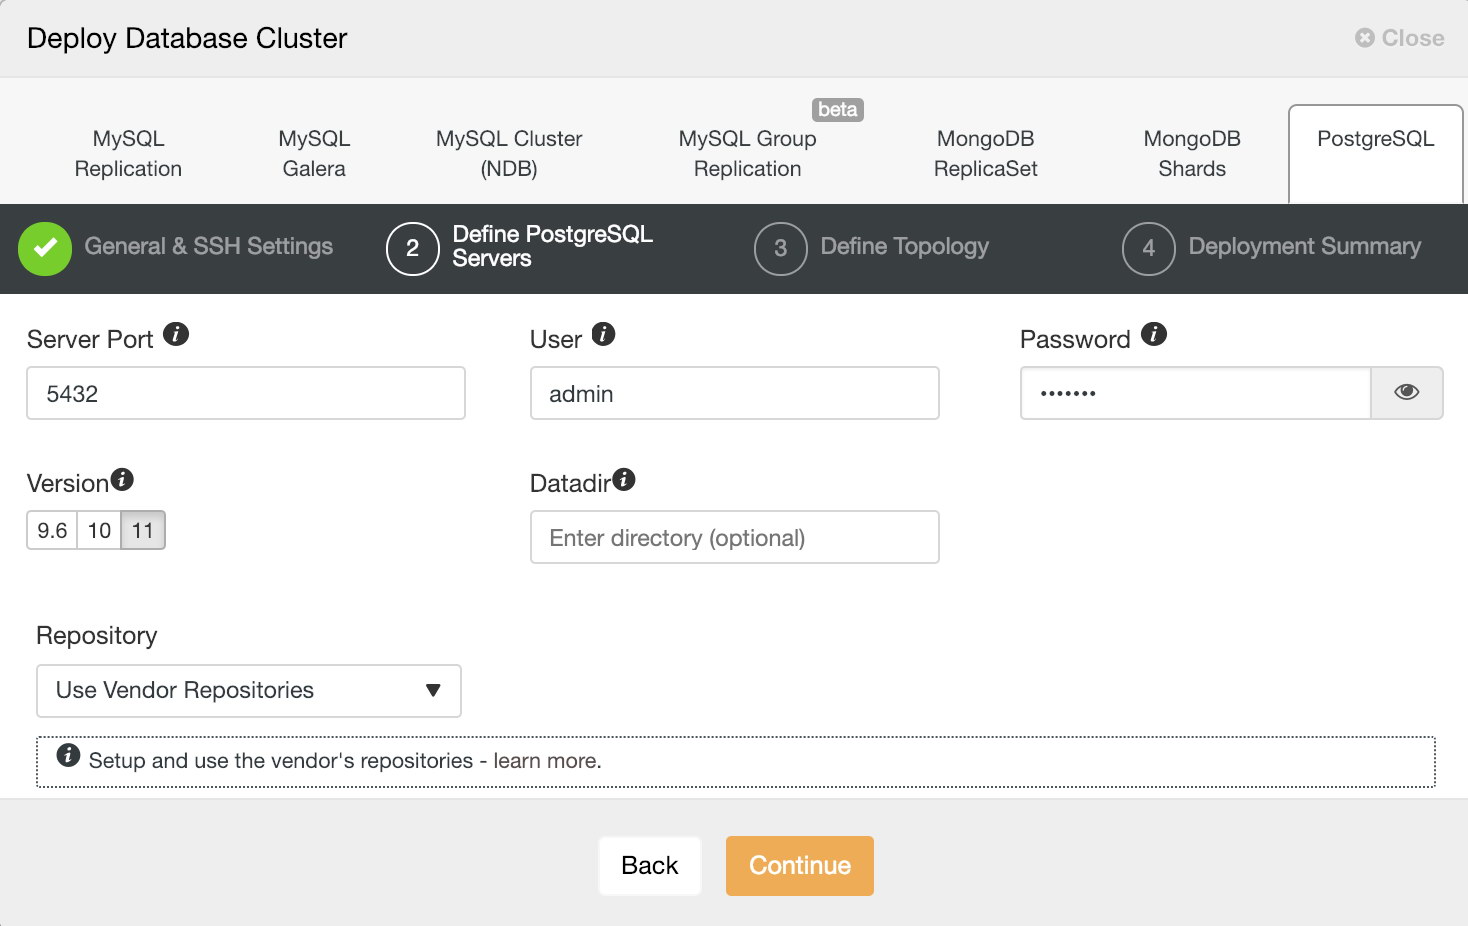
After setting up the SSH access information, we must define the database user, version and datadir (optional). We can also specify which repository to use. In this case, we want to deploy PostgreSQL 11, so just select it and continue.

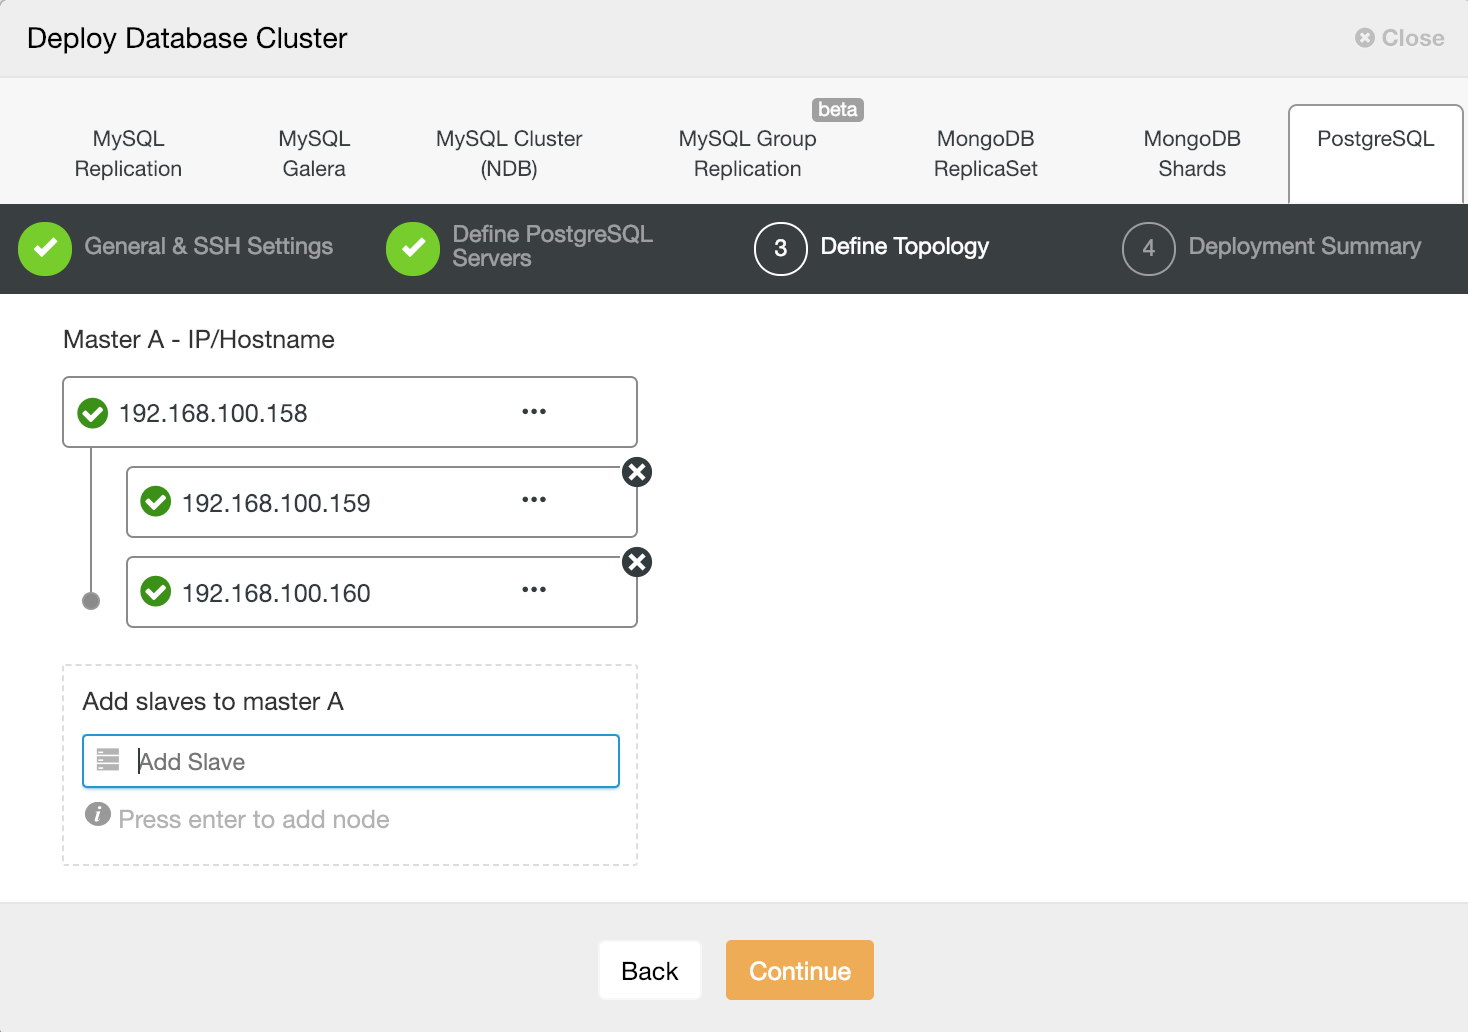
In the next step, we need to add our servers to the cluster we are going to create.

ClusterControl Deploy Information 3

When adding our servers, we can enter IP or hostname.

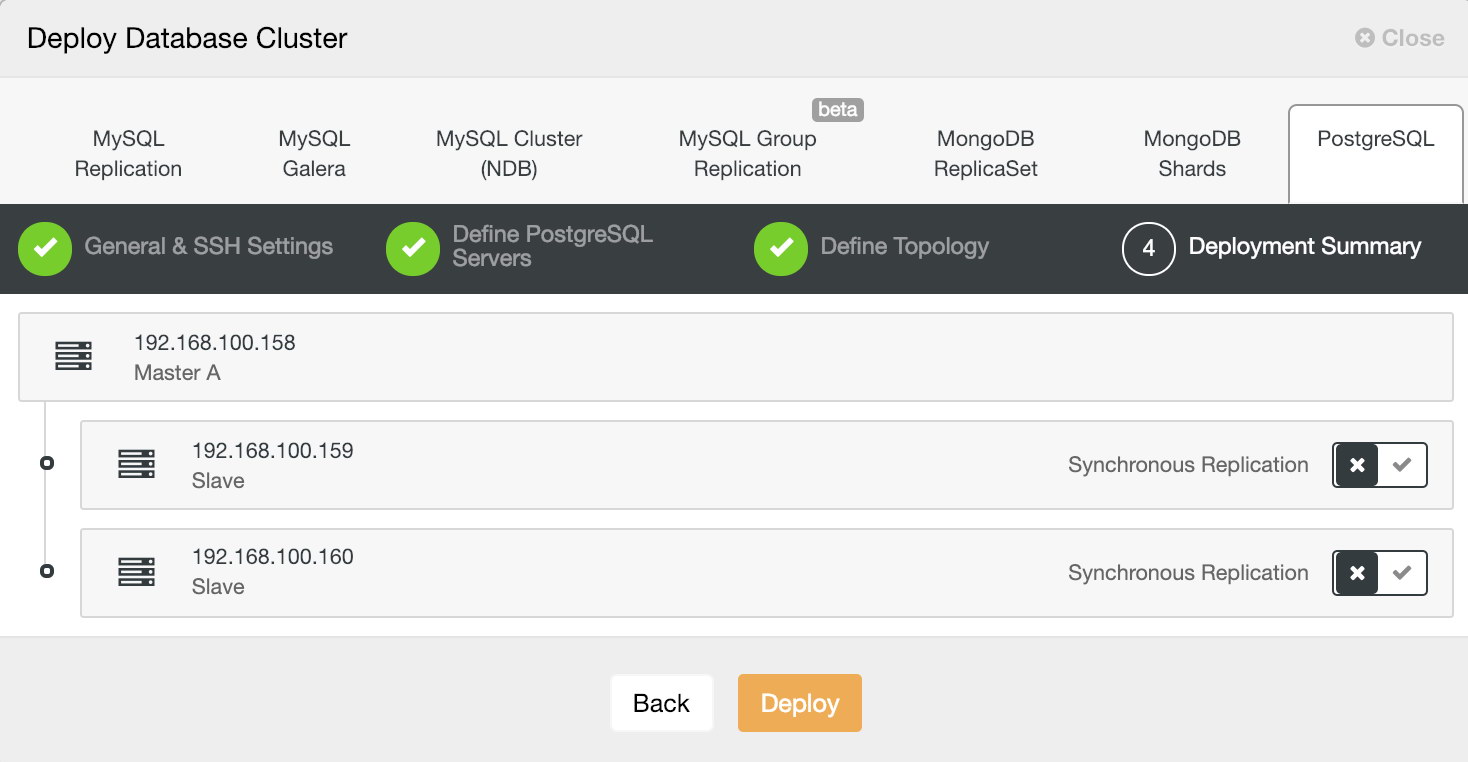
In the last step, we can choose if our replication will be Synchronous or Asynchronous.

ClusterControl Deploy Information 4

We can monitor the status of the creation of our new cluster from the ClusterControl activity monitor.

ClusterControl Activity Section

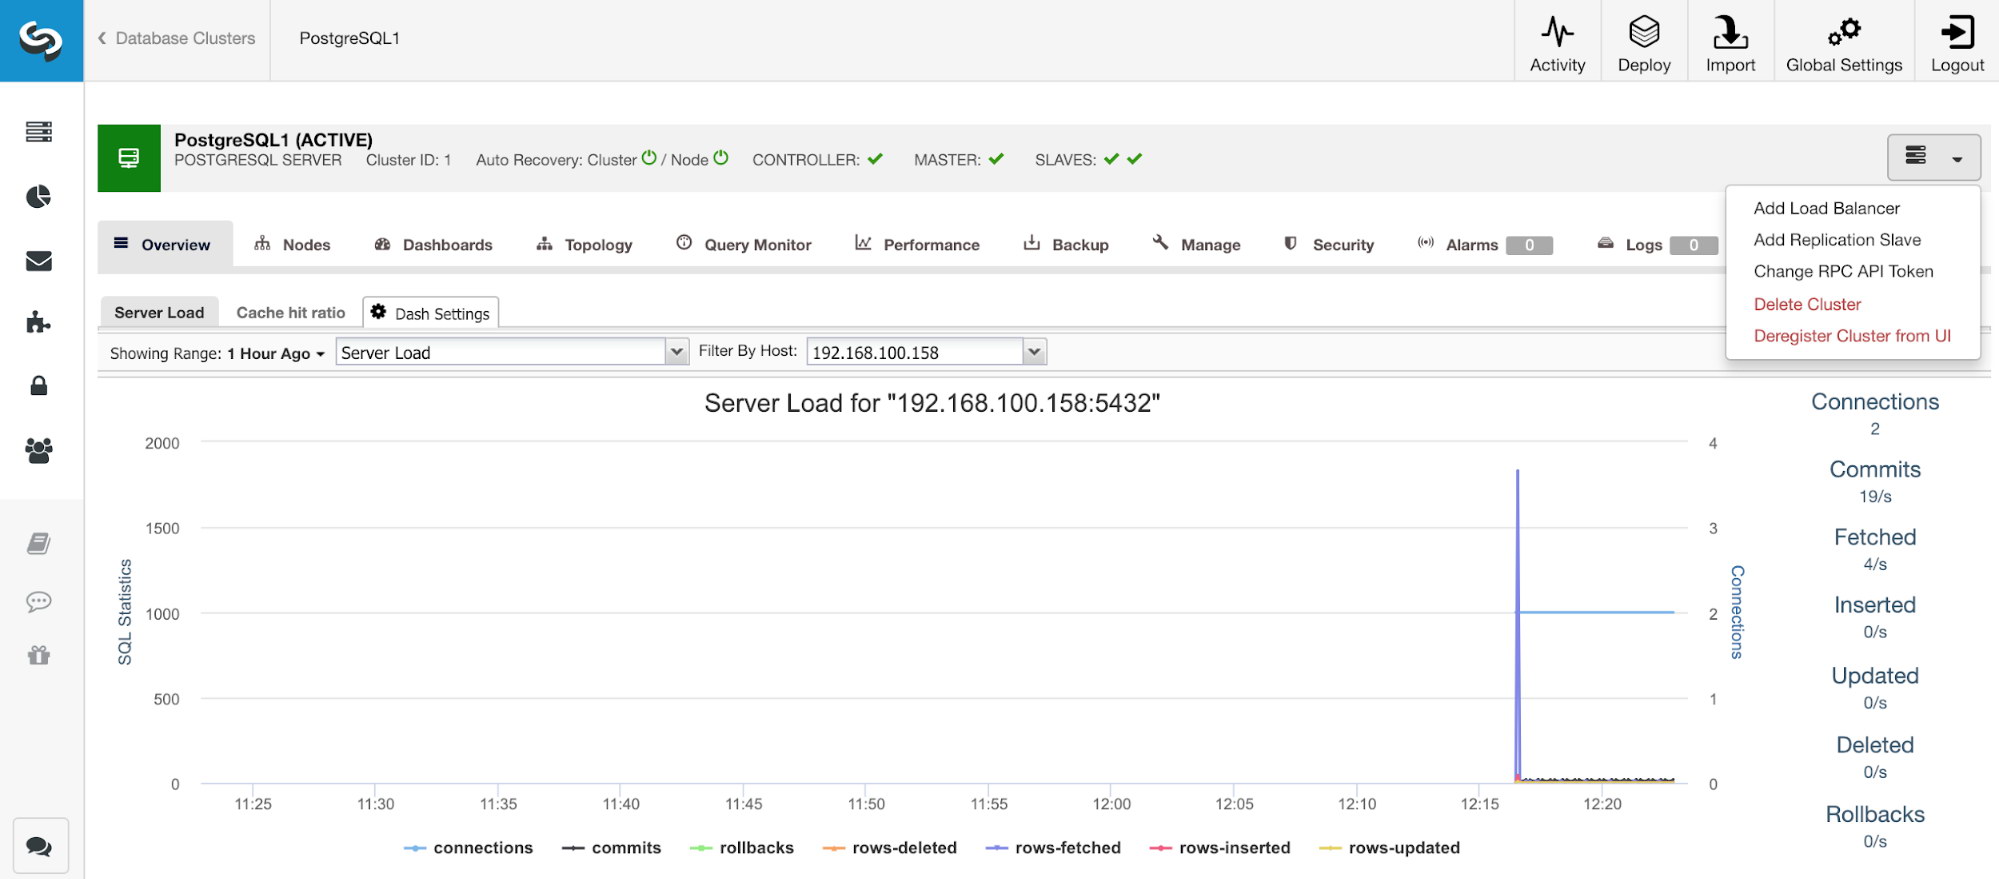
Once the task is finished, we can see our new PostgreSQL 11 cluster in the main ClusterControl screen.

ClusterControl Main Screen

Once we have our cluster created, we can perform several tasks on it, like adding a load balancer (HAProxy) or a new replica.

ClusterControl Cluster Section

Scaling PostgreSQL 11

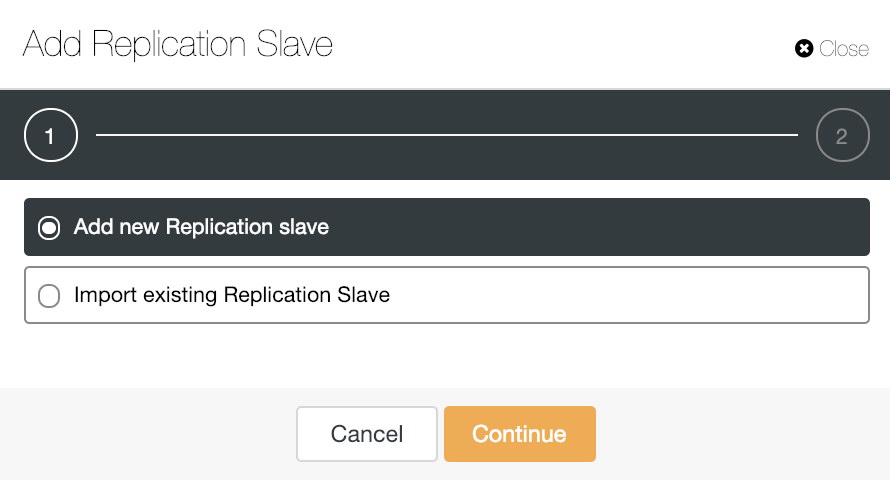
If we go to cluster actions and select “Add Replication Slave”, we can either create a new replica from scratch, or add an existing PostgreSQL database as a replica.

ClusterControl Add Replication Slave Option

Let's see how adding a new replication slave can be a really easy task.

ClusterControl Add Replication Slave Information

As you can see in the image, we only need to choose our Master server, enter the IP address for our new slave server and the database port. Then, we can choose if we want ClusterControl to install the software for us, and if the replication slave should be Synchronous or Asynchronous.

In this way, we can add as many replicas as we want and spread read traffic between them using a load balancer, which we can also implement with ClusterControl.

We can see more information about the HA for PostgreSQL in a related blog.

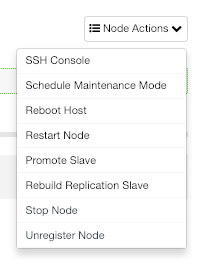
From ClusterControl, you can also perform different management tasks like Reboot Host, Rebuild Replication Slave or Promote Slave, with one click.

ClusterControl Node Actions

Backups

In previous blogs we took a look on the backup and PITR ClusterControl features for PostgreSQL. Now, in the last ClusterControl version, we have the "verify/restore backup on a standalone host" and "create a cluster from an existing backup" features.

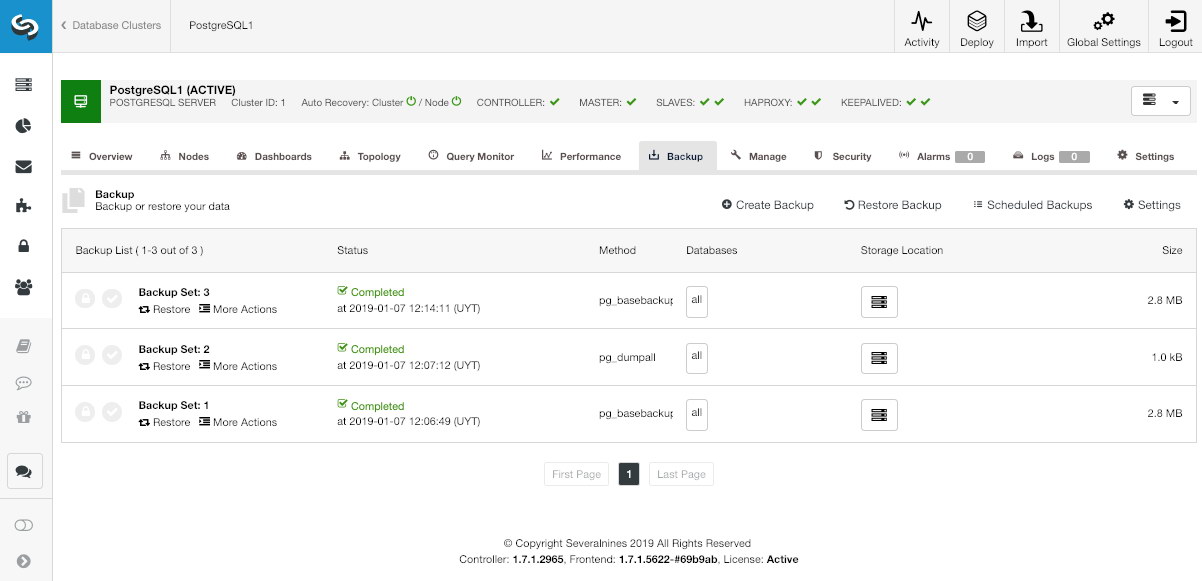
In ClusterControl, select your cluster and go to the "Backup" section to see your current backups.

ClusterControl Backups Section

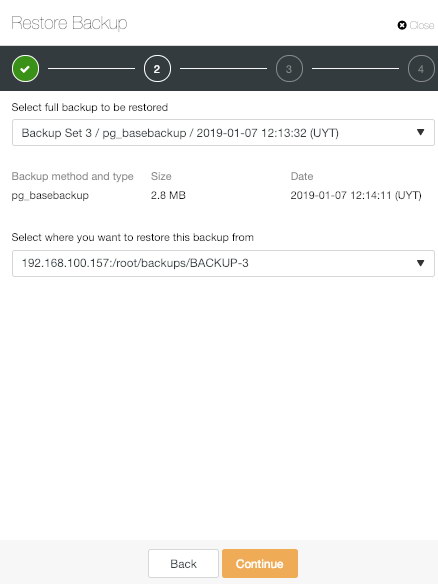
In the "Restore" option, first, you can choose which backup will be restored.

ClusterControl Restore Backup Option

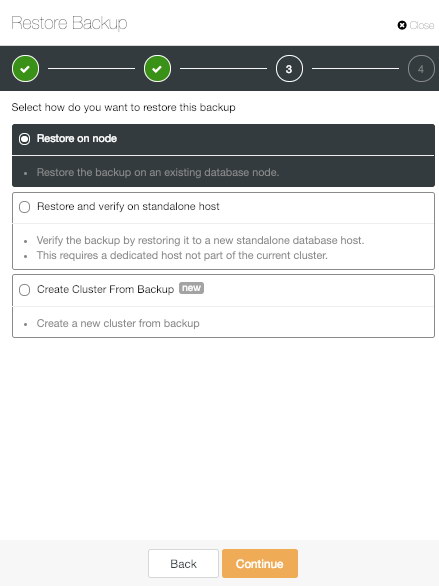
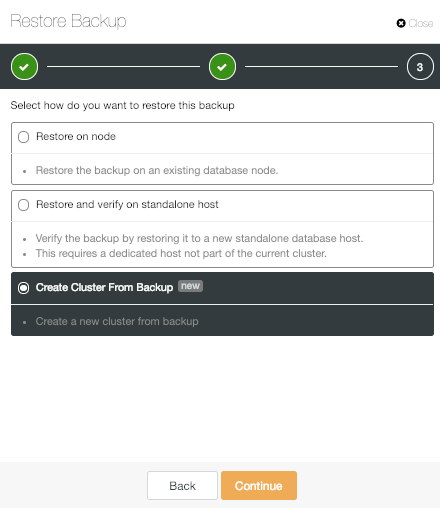
There, we have three options.

ClusterControl Restore on node Option

The first one is the classic "Restore on node" option. This just restores the selected backup on a specific node.

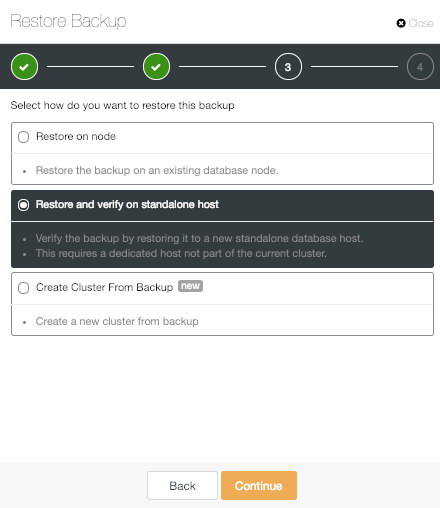
ClusterControl Restore and verify on standalone host Option

The "Restore and verify on standalone host" option is a new ClusterControl PostgreSQL feature. This allows us to test the generated backup by restoring it on a standalone host. This is really useful to avoid any surprises in a disaster recovery scenario.

To use this feature, we need a dedicated host (or VM) that is not part of the cluster.

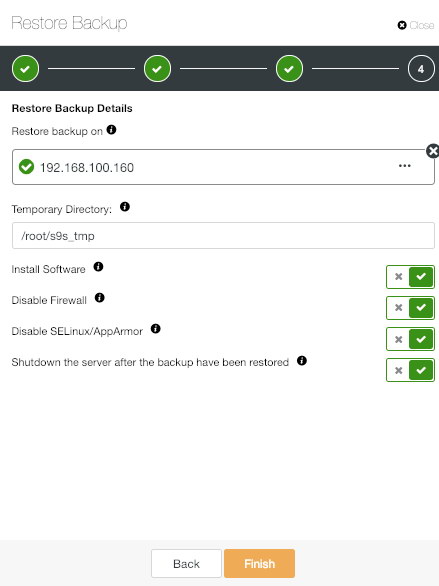
ClusterControl Restore and verify on standalone host Information

Add the dedicated host IP address and choose the desire options.

ClusterControl Verified Backup

When the backup is verified, you can see the "Verified" icon in the backup list.

ClusterControl Create Cluster From Backup Option

"Create Cluster From Backup" is another important new ClusterControl PostgreSQL feature.

As the name suggests it , this feature allow us to create a new PostgreSQL cluster with the data from the generated backup.

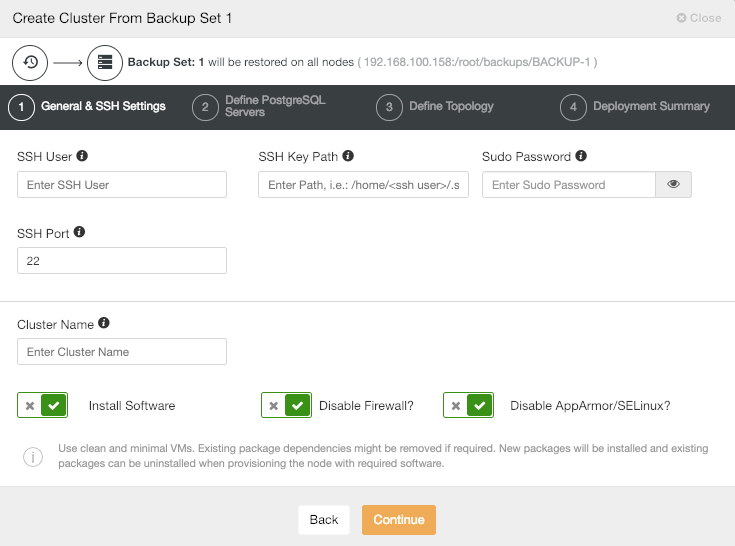
After choosing this option, we need to follow the same steps that we saw in the deploy section.

ClusterControl Create Cluster From Backup Information

All the configuration like user, number of nodes or replication type can be different in this new cluster.
When the new cluster is created, you can see both, the old and the new one in the ClusterControl main screen.

ClusterControl Main Screen

Conclusion

As we have seen above, you can now deploy the latest PostgreSQL release, version 11 using ClusterControl. Once deployed, ClusterControl provides a whole range of features, from monitoring, alerting, automatic failover, backup, point-in-time recovery, backup verification, to scaling of read replicas. This can help you manage Postgres in a friendly and intuitive way. Give it a try!

How to Monitor MongoDB with Prometheus & ClusterControl

$
0
0

SCUMM (Severalnines ClusterControl Unified Monitoring & Management) is an agent-based solution with agents installed on the database nodes. It provides a set of monitoring dashboards, that have Prometheus as the data store with its elastic query language and multi-dimensional data model. Prometheus scrapes metrics data from exporters running on the database hosts.

ClusterControl SCUMM architecture was introduced with version 1.7.0 extending monitoring functionality for MySQL, Galera Cluster, PostgreSQL & ProxySQL.

The new ClusterControl 1.7.1 adds high-resolution monitoring for MongoDB systems.

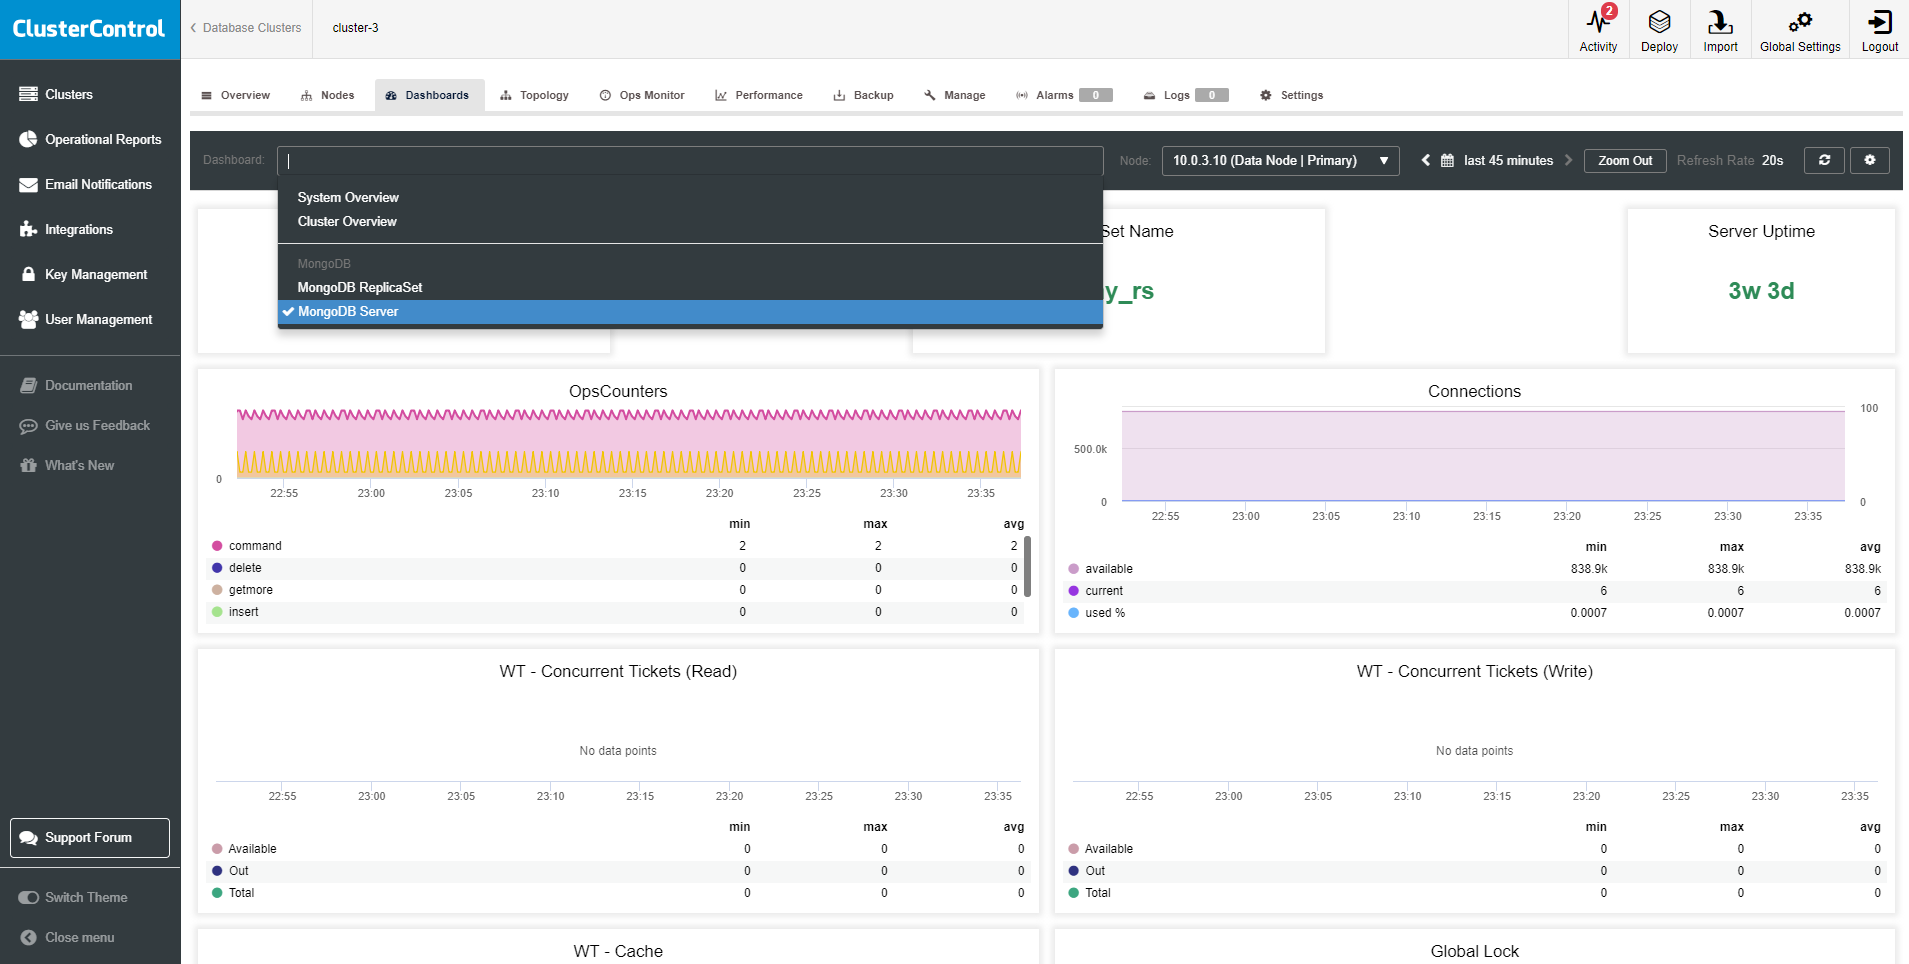
ClusterControl MongoDB dashboard list

In this article, we will describe the two main dashboards for MongoDB environments. MongoDB Server and MongoDB Replicaset.

Dashboard and Metrics List

The list of dashboards and their metrics:

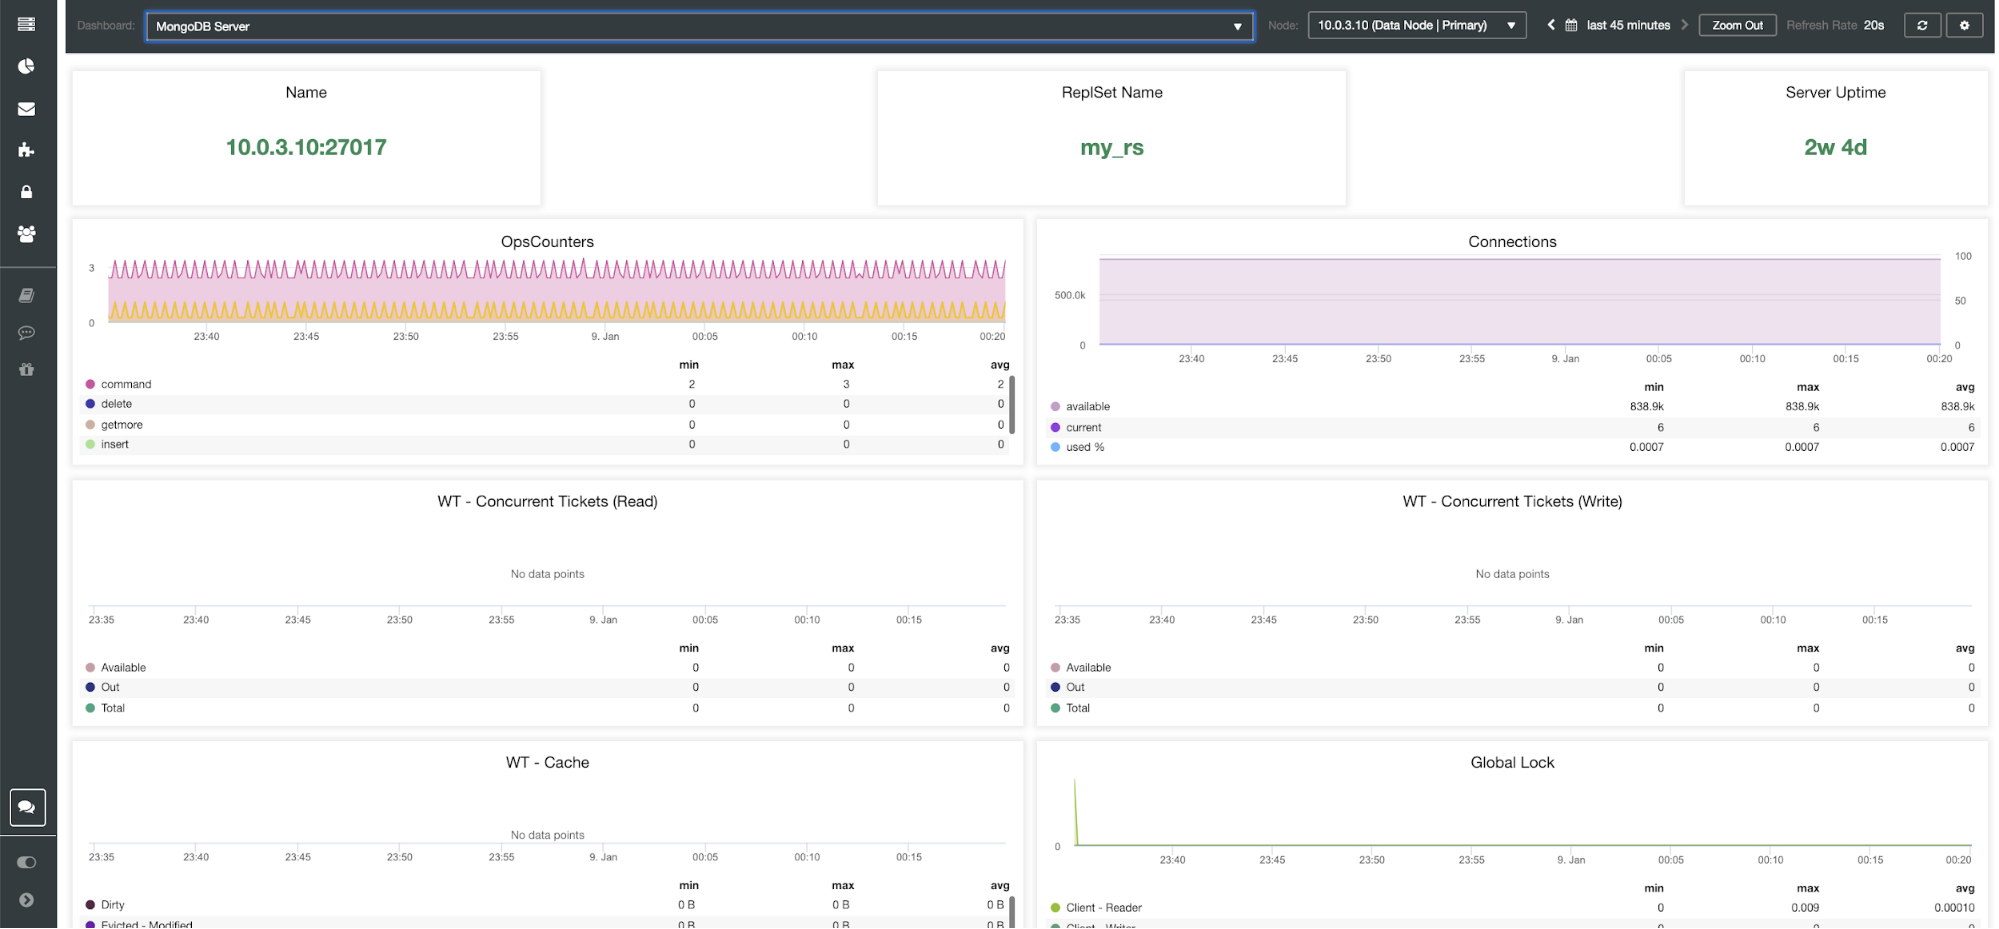
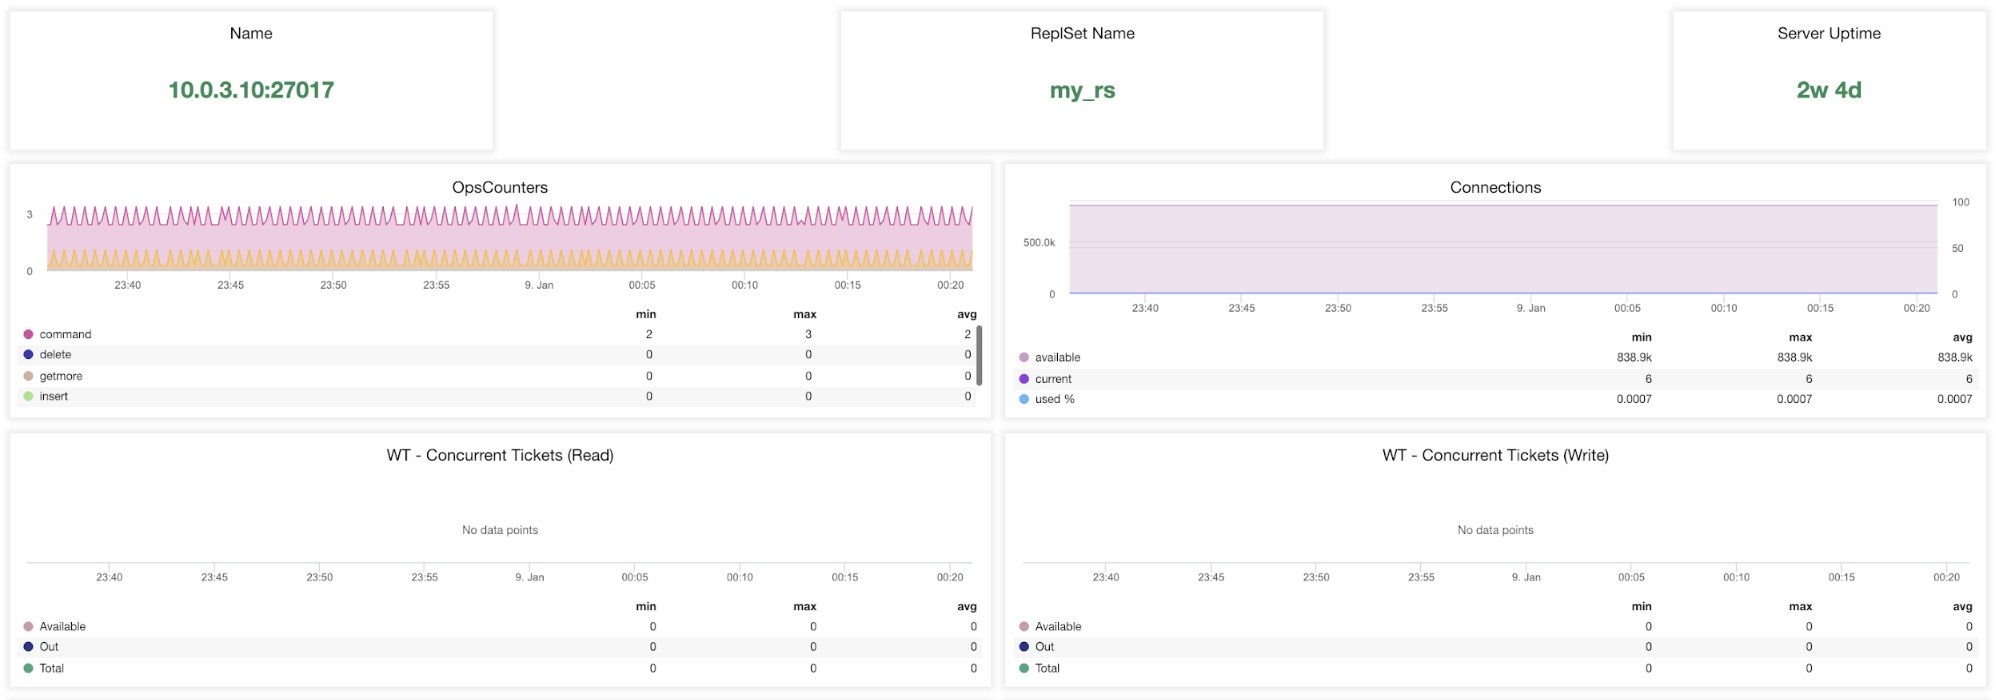
MongoDB Server 
 Name
ReplSet Name
Server Uptime
OpsCounters
Connections
WT - Concurrent Tickets (Read)
WT - Concurrent Tickets (Write)
WT - Cache
Global Lock
Asserts
ClusterControl MongoDB Server Dashboard
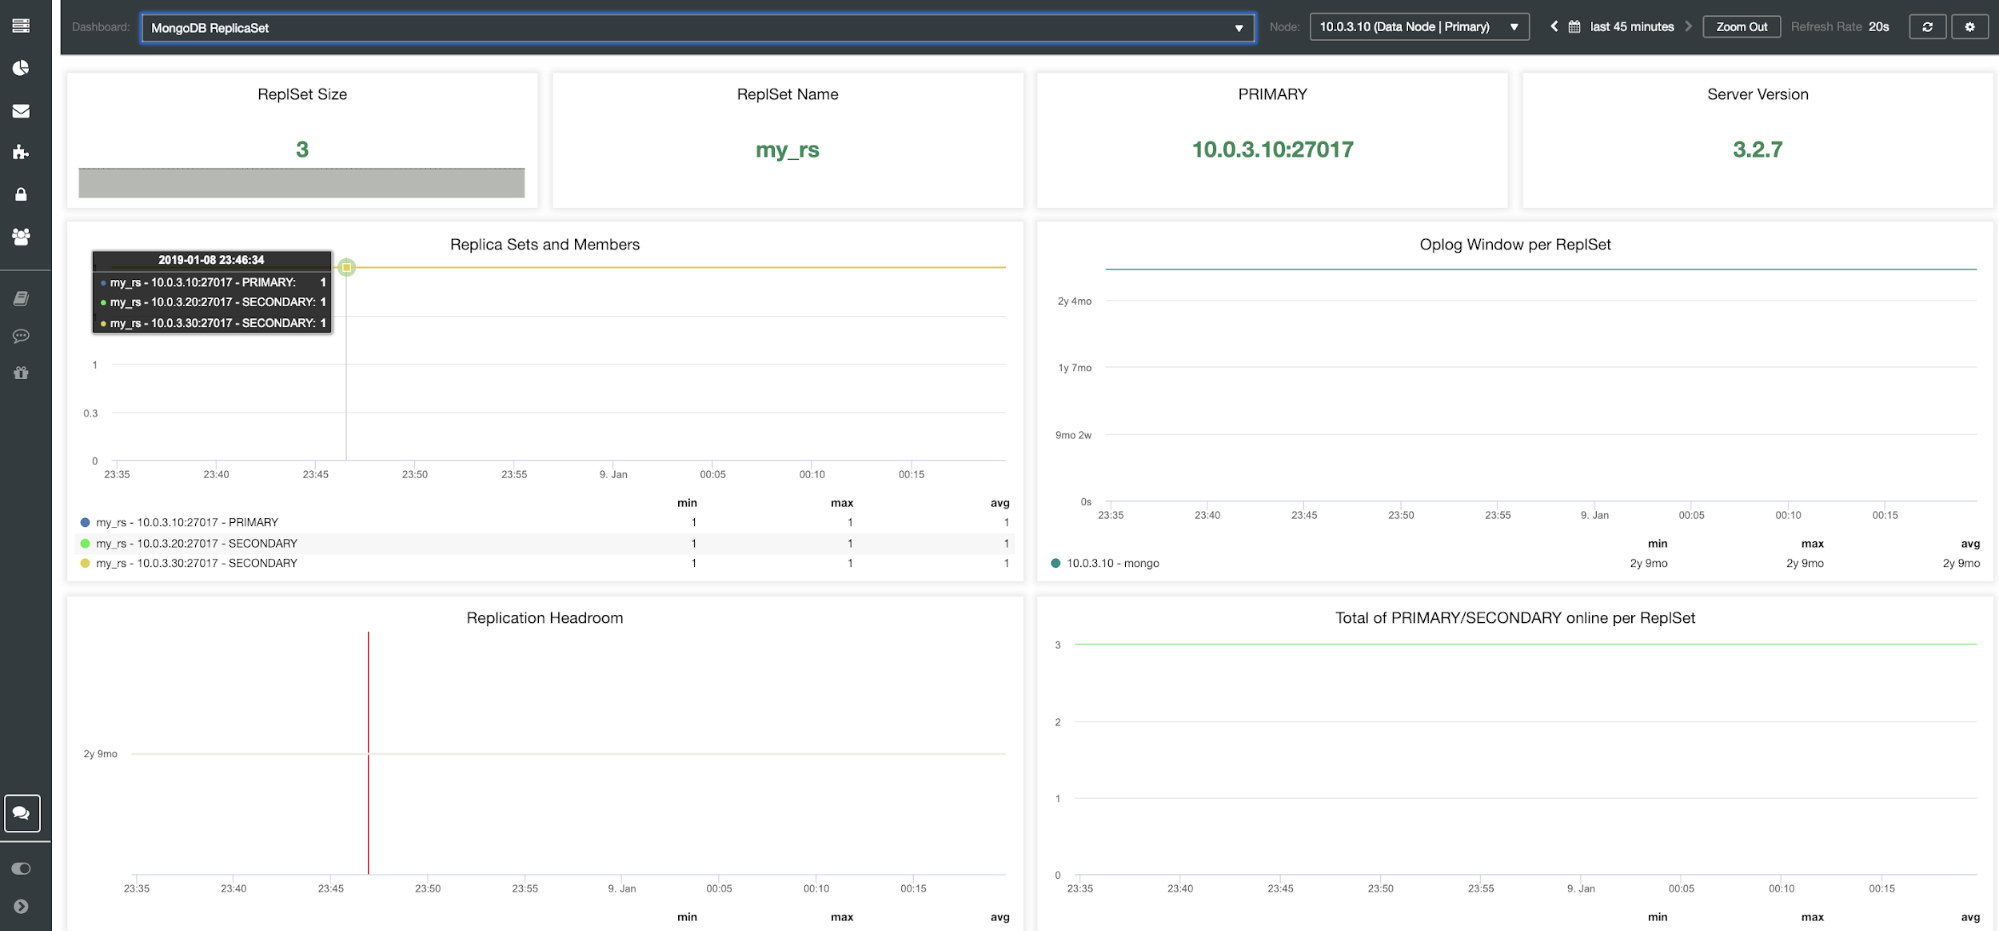
MongoDB ReplicaSet 
 ReplSet Size
ReplSet Name
PRIMARY
Server Version
Replica Sets and Members
Oplog Window per ReplSet
Replication Headroom
Total of PRIMARY/SECONDARY online per ReplSet
Open Cursors per ReplSet
ReplSet - Timed-out Cursors per Set
Max Replication Lag per ReplSet
Oplog Size
OpsCounters
Ping Time to Replica Set Members from PRIMARY(s)
ClusterControl MongoDB ReplicaSet Dashboard

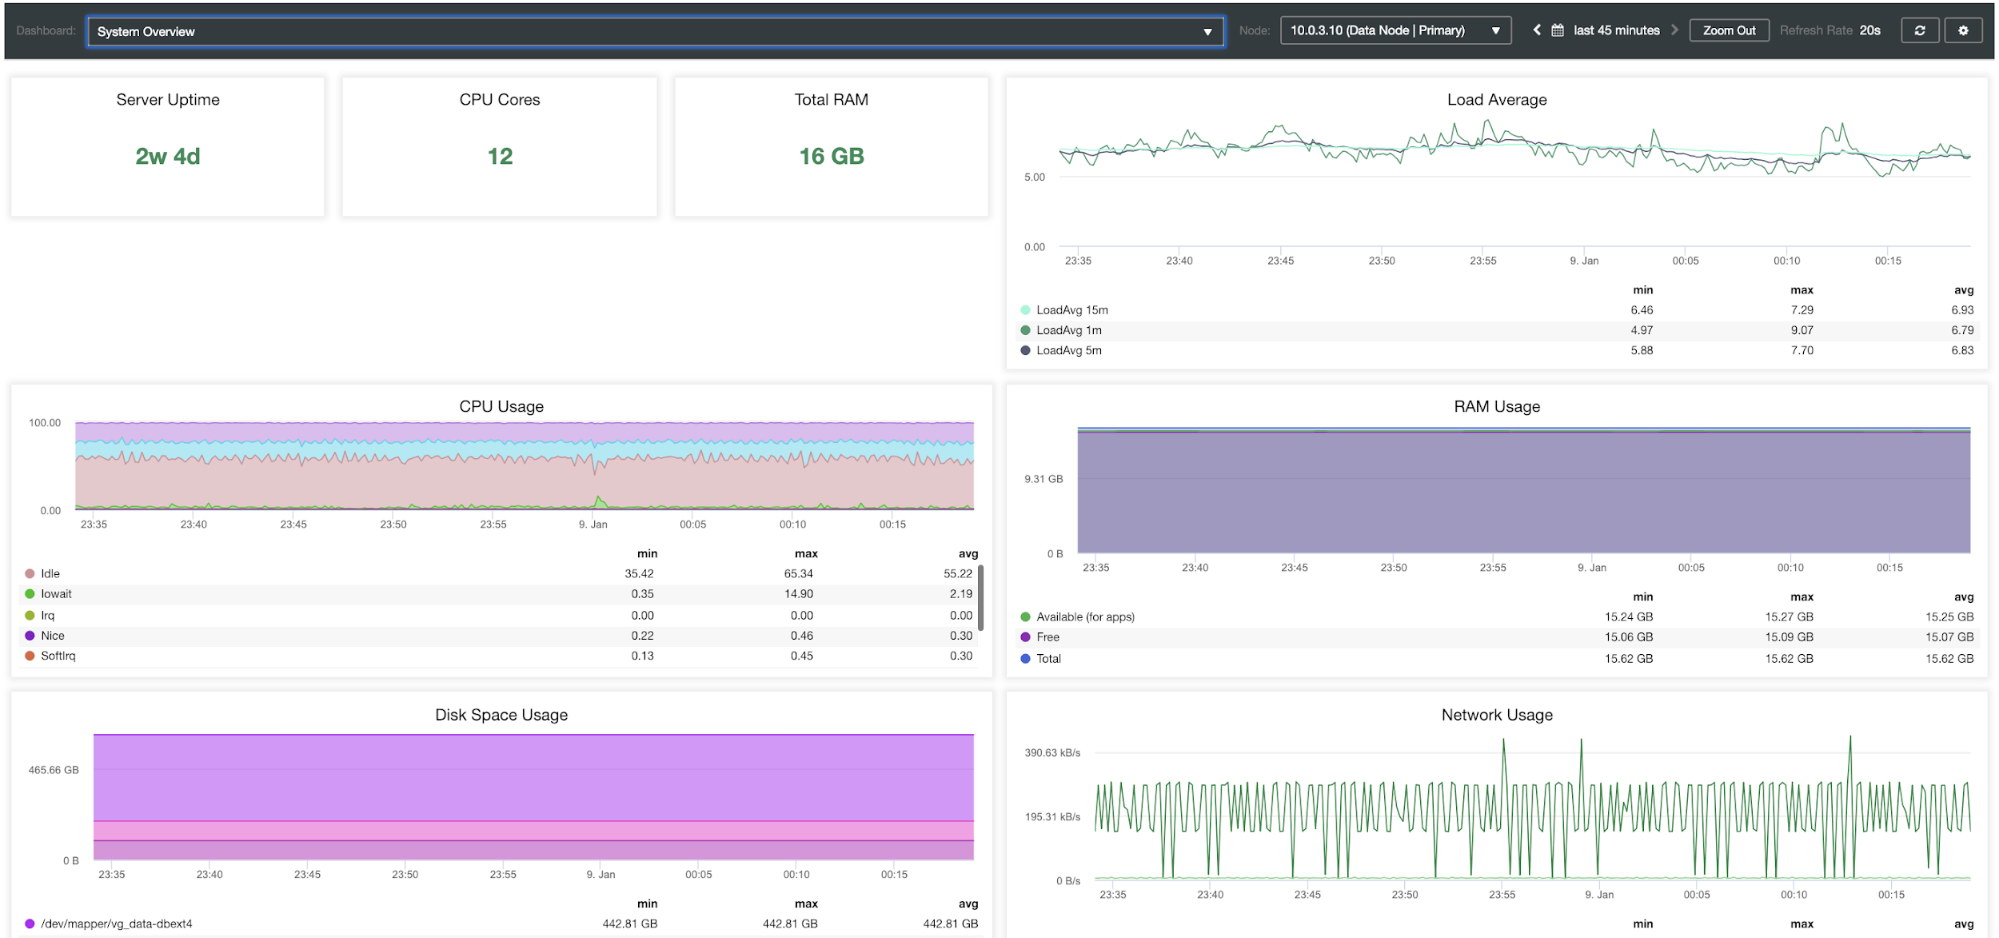
Database systems heavily depend on OS resources, so you can also find two additional dashboards for System Overview and Cluster Overview of your MongoDB environment.

System Overview 
 Server Uptime
CPU Cores
Total RAM
Load Average
CPU Usage
RAM Usage
Disk Space Usage
Network Usage
Disk IOPS
Disk IO Util %
Disk Throughput
ClusterControl System Overview Dashboard
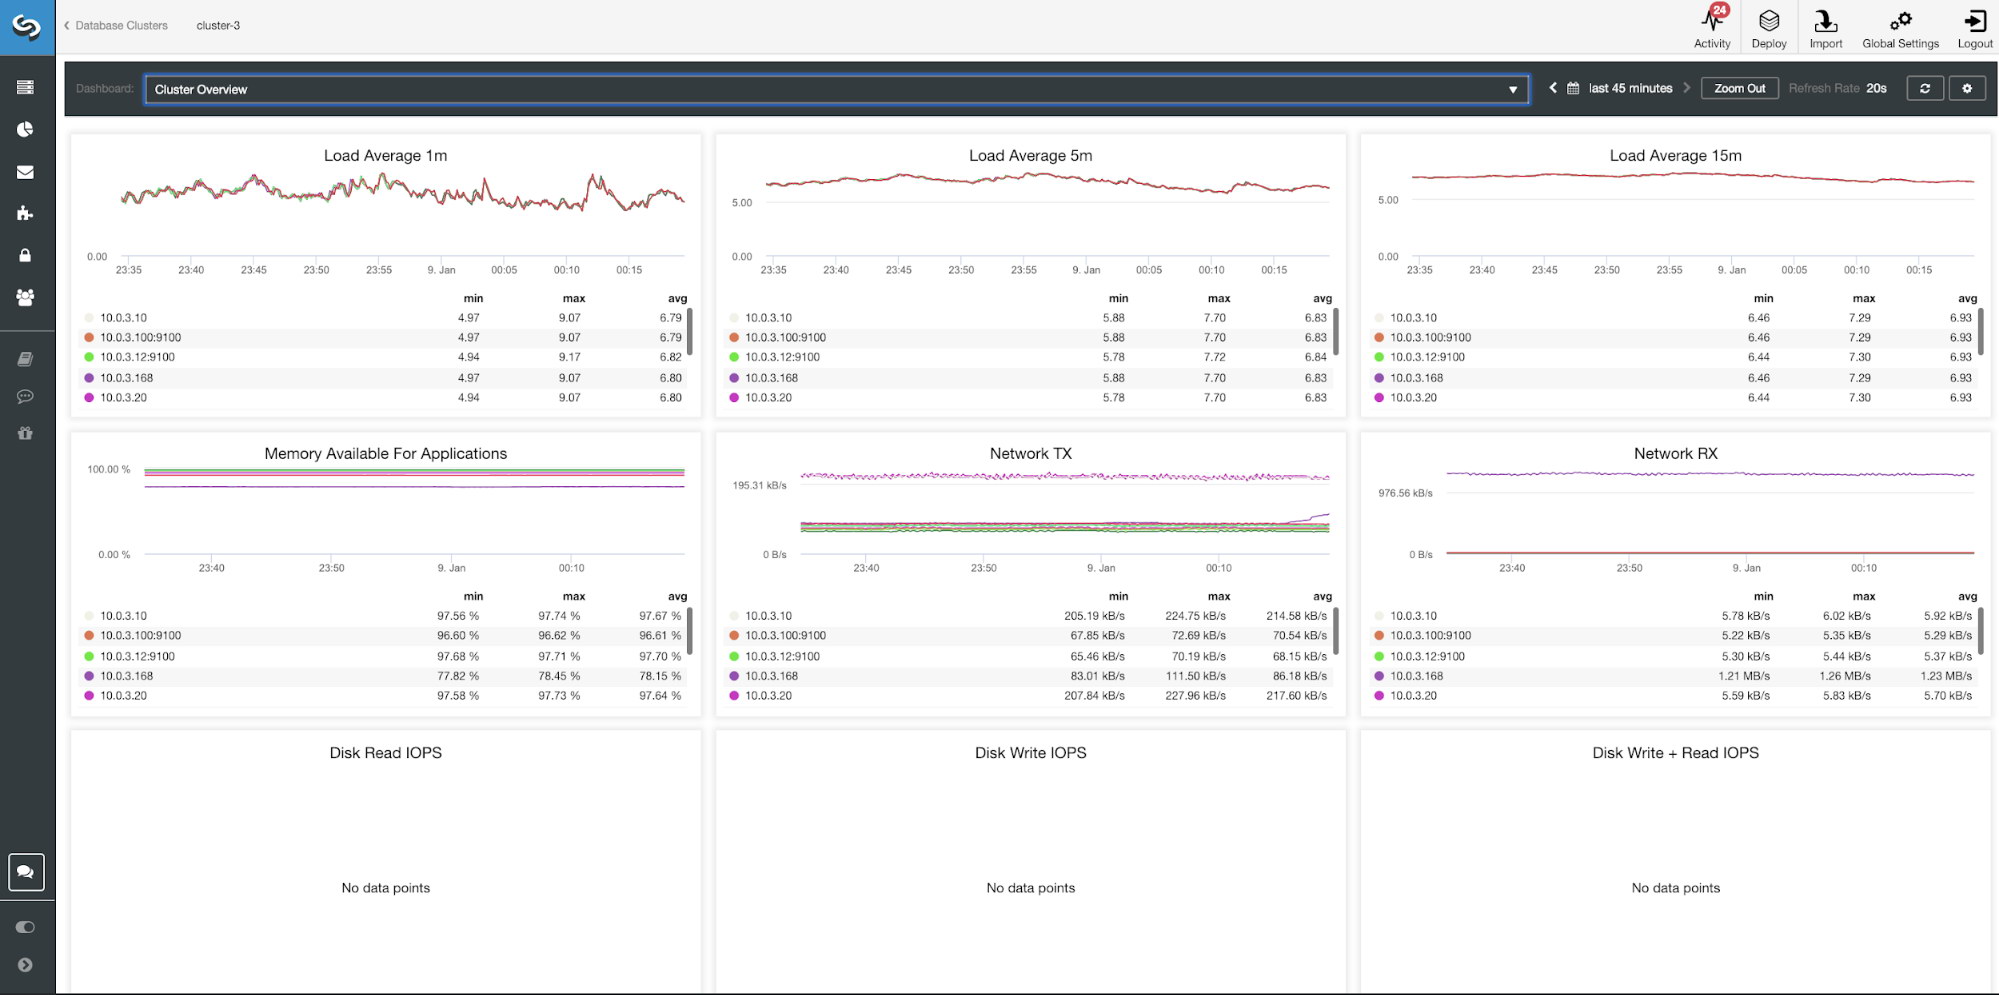
Cluster Overview 
 Load Average 1m
Load Average 5m
Load Average 15m
Memory Available For Applications
Network TX
Network RX
Disk Read IOPS
Disk Write IOPS
Disk Write + Read IOPS
ClusterControl Cluster Overview Dashboard

MongoDB Server Dashboard

ClusterControl MongoDB metrics

Name - Server address and the port.

ReplsSet Name - Presents the name of the replica set where the server belongs to.

Server Uptime - Time since last server restart.

Ops Couters - Number of requests received during the selected time period broken up by the type of the operation. These counts include all received operations, including ones that were not successful.

Connections - This graph shows one of the most important metrics to watch - the number of connections received during the selected time period including unsuccessful requests. Abnormal traffic loads can lead to performance issues. If MongoDB runs low on connections, it may not be able to handle incoming requests in a timely manner.

WT - concurrent Tickets (Read) / WT - concurrent TIckets (Write) These two graphs show read and write tickets which control concurrency in WiredTiger (WT). WT tickets control how many read and write operations can execute on the storage engine at the same time. When available read and write tickets drop to zero, the number of concurrent running operations is equal to the configured read/write values. This means that any other operations must wait until one of the running threads finishes its work on the storage engine before executing.

ClusterControl MongoDB metrics

WT - Cache (Dirty, Evicted - Modified, Evicted - Unmodified, Max) - The size of the cache is the single most important knob for WiredTiger. By default, MongoDB 3.x reserves 50% (60% in 3.2) of the available memory for its data cache.

Global Lock (Client-Read, Client - Write, Current Queue - Reader, Current Queue - Writer) - Poor schema design patterns or heavy read and write requests from many clients may cause extensive locking. When this occurs, there is a need to maintain consistency and avoid write conflicts.
To achieve this MongoDB uses multi-granularity-locking which enables locking operations to happen at different levels, such as a global, database, or collection level.

Asserts (msg, regular, rollovers, user) - This graph shows the number of asserts that are raised each second. High values and deviations from trends should be reviewed.

MongoDB ReplicaSet Dashboard

The metrics that are shown in this dashboard matter only if you use a replica set.

ClusterControl MongoDB ReplicaSet Metrics

ReplicaSet Size - The number of members in the replica set. The standard replica set deployment for the production system is a three-member replica set. Generally speaking, it is recommended that a replica set has an odd number of voting members. Fault tolerance for a replica set is the number of members that can become unavailable and still leave enough members in the set to elect a primary. The fault tolerance for three members is one, for five it is two etc.

ReplSet Name - It is the name assigned in the MongoDB configuration file. The name refers to /etc/mongod.conf replSet value.

PRIMARY - The primary node receives all the write operations and records all other changes to its data set in its operation log. The value is to identify the IP and port of your primary node in the MongoDB replica set cluster.

Server Version - Identify the server version. ClusterControl version 1.7.1 supports MongoDB versions 3.2/3.4/3.6/4.0.

Replica Sets and Members (min, max, avg) - This graph can help you to identify active members over the time period. You can track the minimum, maximum and average numbers of primary and secondary nodes and how these numbers changed over time. Any deviation may affect fault tolerance and cluster availability.

Oplog Window per ReplSet - Replication window is an essential metric to watch. The MongoDB oplog is a single collection that has been limited in a (preset) size. It can be described as the difference between the first and the last timestamp in the oplog.rs. It is the amount of time a secondary can be offline before initial sync is needed to sync the instance. These metrics inform you how much time you have left before our next transaction is dropped from the oplog.

ClusterControl MongoDB ReplicaSet Metrics

Replication Headroom - This graph presents the difference between the primary’s oplog window and the replication lag of the secondary nodes. The MongoDB oplog is limited in size and If the node lags too far, it won’t be able to catch up. If this happens, full sync will be issued and this is an expensive operation that has to be avoided at all times.

Total of PRIMARY/SECONDARY online per ReplSet - Total number of cluster nodes over the time period.

Open Cursors per ReplSet (Pinned, Timeout, Total) - A read request comes with a cursor which is a pointer to the data set of the result. It will remain open on the server and hence consume memory unless it is terminated by the default MongoDB setting. You should be identifying non-active cursors and cut them off to save on memory.

ReplSet - Timeout Cursors per SetsMax Replication Lag per ReplSet - Replication lag is very important to keep an eye on if you are scaling out reads via adding more secondaries. MongoDB will only use these secondaries if they don’t lag too far behind. If the secondary has replication lag, you risk serving out stale data that already has been overwritten on the primary.

OplogSize - Certain workloads might require larger oplog size. Updates to multiple documents at once, deletions equal the same amount of data as an insert or the significant number of in-place updates.

OpsConters - This graph shows the number of queries executions.

Ping Time to Replica Set Member from Primary - This lets you discover replica set members that are down or unreachable from the primary node.

Closing remarks

The new ClusterControl 1.7.1 MongoDB dashboard feature is available in the Community Edition for free. Database ops teams can profit from it by using the high-resolution graphs, especially when performing their daily routines as root cause analyzes and capacity planning.

It’s just a matter of one click to deploy new monitoring agents. ClusterControl installs Prometheus agents, configures metrics and maintains access to Prometheus exporters configuration via its GUI, so you can better manage parameter configuration like collector flags for the exporters (Prometheus).

By adequately monitoring the number of reads and write requests you can prevent resource overload, quickly find the origin of potential overloads, and know when to scale up.

Monitoring HAProxy Metrics And How They Change With Time

$
0
0

HAProxy is one of the most popular load balancers for MySQL and MariaDB.

Feature-wise, it cannot be compared to ProxySQL or MaxScale, but it is fast and robust and may work perfectly fine in any environment as long as the application can perform the read/write split and send SELECT queries to one backend and all writes and SELECT … FOR UPDATE to a separate backend.

Keeping track of the metrics made available by HAProxy is very important. You have to be able to know the state of your proxy, especially if you encountered any issues.

ClusterControl always made available an HAProxy status page, which showed the state in real time. With the new, Prometheus-based SCUMM (Severalnines ClusterControl Unified Monitoring & Management) dashboards, it is now possible to track how those metrics change in time.

In this blog post we will go over the different metrics presented in the HAProxy SCUMM dashboard.

First of all, by default Prometheus and SCUMM dashboards are disabled in ClusterControl. In that case, it’s just a matter of one click to deploy them for a given cluster. If you have multiple clusters monitored by ClusterControl you can reuse the same Prometheus instance for every cluster managed by ClusterControl.

Once deployed, we can access the HAProxy dashboard. We will go over the data shown in it.

As you can see, it starts with the information about the state of the backends. Here, please note this may depend on the cluster type and how you deployed HAProxy. In this case, it was a Galera cluster and HAProxy was deployed in a round-robin fashion; therefore you see three backends for reads and three for writes, six in total. It is also the reason why you see all backends marked as up. In case of the replication cluster, things are looking different as the HAProxy will be deployed in a read/write split, and the scripts will keep only one host (master) up and running in the writer’s backend:

This is why on the screen above, you can see two backend servers marked as “down”.

Next graph focuses on the data sent and received by both backend (from HAProxy to the database servers) and frontend (between HAProxy and client hosts).

We can also check the traffic distribution between backends that are configured in HAProxy. In this case we have two backends and the queries are sent via port 3308, which acts as the round-robin access point to our Galera Cluster.

We can also find graphs showing how the traffic was distributed across all backend servers. In this case, due to round-robin access pattern, data was more or less evenly distributed across all three backend Galera servers.

Next, we can see information about sessions. How many sessions were opened from HAProxy to the backend servers. We can also track how many times per second a new session was opened to the backend. You can also check how those metrics look like when you look at them on per backend server basis.

Next two graphs show what was the maximum number of sessions per backend server and also when some connectivity issues showed up. This can be quite useful for debugging purposes when you hit some configuration error on your HAProxy instance and connections started to be dropped.

Next graph might be even more valuable as it shows different metrics related to error handling - response errors, request errors, retries on the backend side etc. Then we have a Sessions graph, which shows the overview of the session metrics.

On the next graph we can track the connection errors in time, this can be also useful to pinpoint the time when the issue started to evolve.

Finally, two graphs related to queued requests. HAProxy queues requests to backend if the backend servers are oversaturated. This can point to, for example, the overloaded database servers, which cannot cope with more traffic.

As you can see, ClusterControl tracks the most important metrics of HAProxy and can show how they change in time. This is very useful in pinpointing when an issue started and, to some extent, what could be the root cause of it. Try it out (it’s free) for yourself.

How to Optimize Performance of ClusterControl and Its Components

$
0
0

Monitoring and management is critical to any production environment, and performance matters. Slow user interfaces that lag or do not respond, delayed alerts, cluster job timeouts when the server is starved of resources are all things that can cause trouble. There are ways to improve performance of ClusterControl, especially if you are managing multiple clusters and each cluster contains multiple nodes. This blog provides some tuning tips. The points elaborated here are curated based on our experience dealing with performance issues reported by our users and customers.

As an introduction, ClusterControl consists of several main components - a web application (frontend) based on PHP together with a number of daemonized processes (backend), these leverage a MySQL/MariaDB database for persistent storage. You are effectively controlling your cluster from the web application, which will be translated to a series of process calls executed by the backend processes to manage and monitor your database clusters.

MySQL Database

ClusterControl components rely on a MySQL or MariaDB database as the persistent store for monitoring data collected from the managed nodes, as well as all ClusterControl meta data (e.g. what jobs there are in the queue, backup schedules, backup statuses, etc.). By default, the installer script will install whatever version comes by the standard repository of the OS. The following is the MySQL/MariaDB version being installed by the installer:

  • CentOS/Redhat 6 - MySQL 5.1
  • CentOS/Redhat 7 - MariaDB 5.5
  • Ubuntu 18.04 (Bionic) - MySQL 5.7
  • Ubuntu 16.04 (Xenial) - MySQL 5.7
  • Ubuntu 14.04 (Trusty) - MySQL 5.5
  • Debian 9 (Stretch) - MySQL 5.5
  • Debian 8 (Jessie) - MySQL 5.5
  • Debian 7 (Wheezy) - MySQL 5.5

The installer script would do some basic tuning like configuring datadir location, MySQL port, user and also InnoDB buffer pool size at the very beginning of the installation stage. However, the tuning might not be suitable once you have imported or created more clusters/nodes. With an increased number of nodes to be monitored and managed, ClusterControl would use more resources and the database layer is commonly the first bottleneck that users encounter. Some further tuning might be needed to contain the incoming load.

ClusterControl is smart enough to detect any performance anomaly by writing up the following lines inside cmon_X.log (where X is the cluster ID):

2018-11-28 01:30:00 : (INFO) CmonSheetManager at 0x3839af0 loaded 70 values for key 'diskstat' between 2018-11-23 01:30:00 - 2018-11-28 01:30:0
0.
2018-11-28 01:30:00 : (INFO) SQL processing: 220.0000ms
2018-11-28 01:30:00 : (INFO) Parsing       : 0.0000ms
2018-11-28 01:30:00 : (INFO) Sum           : 220.0000ms

The above simply means it took 220ms (Sum value) to load 70 values for component "diskstat", where most of the processing time was happening at the SQL processing stage and 0 ms to parse the SQL resultset. This concludes that the SQL layer takes most of the processing time when ClusterControl was trying to query the dataset.

We believe most of the SQL queries executed by ClusterControl are properly optimized for single MySQL instance and use proper indexing. Simply said, if you see something like the above appearing regularly in the log file, some improvements to the database layer are in order, as shown in the next sections.

Tuning InnoDB Buffer Pool Size

Buffer pool size is an important component and has to be configured upfront to improve the MySQL performance. It allows MySQL processing to be happening inside memory, instead of hitting the disk. A simple rule of thumb is to check the InnoDB hit ratio and look for the following line under BUFFER POOL AND MEMORY section:

Buffer pool hit rate 986 / 1000

The hit rate of 986 / 1000 indicates that out of 1000 row reads, it was able to read the row in RAM 986 times. The remaining 14 times, it had to read the row of data from disk. Simply said, 1000 / 1000 is the best value that we are trying to achieve here, which means the frequently-accessed data fits fully in RAM.

Increasing the innodb_buffer_pool_size value will help a lot to accomodate more room for MySQL to work on. However, ensure you have sufficient RAM resources beforehand. By default, ClusterControl allocates 50% of the RAM to the buffer pool. If the host is dedicated to ClusterControl, you can even push it to a higher value like 70%, provided you spare at least 2GB of RAM to the OS processes and caches. If you can't allocate that much, increasing the RAM is the only solution.

Changing this value requires a MySQL restart (older than MySQL 5.7.5), thus the correct service restart ordering will be:

  1. Modify innodb_buffer_pool_size value inside my.cnf.
  2. Stop the CMON service.
  3. Restart MySQL/MariaDB service.
  4. Start the CMON service.

Or simply reboot the host if you can afford a longer downtime.

Tuning max_connections

By default, the installer script will configure max_connections value up to 512. This is rather high, although sane, since ClusterControl barely reaches 200 connections in total, unless the MySQL server is shared with other applications or you have tens of MySQL nodes monitored by ClusterControl (we are talking about 30 nodes and more).

A high max_connections value wastes resources and adjusting the value will affect the maximum memory configured for MySQL. If it is greater than System RAM then there is a chance that the MySQL Server process will terminate with an OOM exception, if all connections are used.

To check on this, simply look for max_used_connections MySQL status. The following is the maximum connections ever reached by MySQL on a ClusterControl node that monitors 2 clusters with 6 MySQL nodes in total:

mysql> SHOW STATUS like 'max_used_connections';
+----------------------+-------+
| Variable_name        | Value |
+----------------------+-------+
| Max_used_connections | 43    |
+----------------------+-------+

A good value to start is Max_used_connections x 2, and gradually increase it if the value is consistently growing. Modifying the max_connections variable can be done dynamically via SET GLOBAL statement.

Using MySQL socket file

By default, the installer script will automatically configure the following host value inside every ClusterControl database configuration files:

Configuration FileValue
/etc/cmon.cnfmysql_hostname=127.0.0.1
/etc/cmon.d/cmon_X.cnf (X is the cluster ID)mysql_hostname=127.0.0.1
/var/www/html/clustercontrol/bootstrap.phpdefine('DB_HOST', '127.0.0.1');
/var/www/html/cmonapi/config/database.phpdefine('DB_HOST', '127.0.0.1');

The above will force the MySQL client to connect via TCP networking, just like connecting to a remote MySQL host although ClusterControl is running on the same server as the MySQL server. We purposely configured it this way to simplify the installation process since almost every OS platform pre-configures MySQL socket file differently, which greatly reduce the installation failure rate.

Changing the value to "localhost" will force the client to use the MySQL Unix socket file instead:

Configuration FileValue
/etc/cmon.cnfmysql_hostname=localhost
/etc/cmon.d/cmon_X.cnf (X is the cluster ID)mysql_hostname=localhost
/var/www/html/clustercontrol/bootstrap.phpdefine('DB_HOST', 'localhost');
/var/www/html/cmonapi/config/database.phpdefine('DB_HOST', 'localhost');

On Unix based systems, MySQL programs treat the host name localhost specially, in a way that is likely different from what you expect compared to other network-based programs. For connections to localhost, MySQL programs attempt to connect to the local server by using a Unix socket file. This occurs even if a --port or -P option is given to specify a port number.

Using MySQL UNIX socket file is much more secure and will cut off the network overhead. It is always recommended over TCP. However, you need to make sure the socket file is configured correctly. It must exist on the following directives inside my.cnf and every MySQL option files on ClusterControl node, for example:

[mysqld]
socket=/var/lib/mysql/mysql.sock

[client]
socket=/var/lib/mysql/mysql.sock

[mysql]
socket=/var/lib/mysql/mysql.sock

[mysqldump]
socket=/var/lib/mysql/mysql.sock

Changing the socket file will also require a MySQL and CMON restart. If you are using the "localhost", you can then add some additional configuration options like skip-networking=1, to prevent accepting remote connections. Our ClusterControl Docker image is using this approach to overcome a limitation in docker-proxy when binding on ports.

OpenSSH with SSSD

ClusterControl uses SSH protocol as its main communication channel to manage and monitor remote nodes. The default OpenSSH configurations are pretty decent and should work in most cases. However, in some environments where SSH is integrated with other security enhancement tools like SElinux or System Security Services Daemon (SSSD), it could bring significant impact to the SSH performance.

We have seen many cases where an ever increasing amount of SSH connections established to each of the managed nodes and eventually, both the ClusterControl server and all managed nodes max out their system memory with SSH connections. In some cases, only a normal full system reboot nightly on the ClusterControl server could solve the problem.

If you running your infrastructure with System Security Services Daemon (SSSD), it's advised for you to comment the following line inside OpenSSH client configuration at /etc/ssh/ssh_config on ClusterControl node:

#ProxyCommand /usr/bin/sss_ssh_knownhostsproxy -p %p %h

The above will skip using SSSD to manage the host key, which will be handled by OpenSSH client instead.

Starting from ClusterControl 1.7.0, you have an option to use agent-based monitoring tool with Prometheus. With agent-based monitoring, ClusterControl does not use SSH to sample host metrics which can be excessive in some environments.

File System and Partitioning

ClusterControl controller writes new entry in its log file almost every second for every cluster. For those who wants to take advantage of this sequential writes on disk and would like to save cost, you can use a spindle disk for this purpose. Modify the following line inside all cmon_X.cnf:

logfile=/new/partition/log/cmon_X.log

Replace X with the cluster ID and restart CMON service to apply the changes.

If you are using ClusterControl as the backup repository, it's recommended for you to allocate sufficient disk space on a separate partition other than the root partition. It gets better if the partition resides on a networked or clustered file system for easy mounting with the targeted nodes when performing restoration operation. We have seen cases where the created backups ate up all disk space of the main partition, eventually impacting ClusterControl and its components.

Keep up to Date

ClusterControl has a short release cycle - at least one new major release every quarter of the year plus weekly maintenance patches (mostly bug fixes - if any). The reason is ClusterControl supports multiple database vendors and versions, operating systems and hardware platforms. Often there are new things being introduced and old things being deprecated from what is provided and ClusterControl has to keep up with all the changes introduced by application vendors and follow the best-practice every time.

We recommend users to always use the latest version of ClusterControl (upgrading is easy) together with the latest web browser (built and tested on Google Chrome and Mozilla Firefox), as we are very likely taking advantage of the new features available in the latest version.

Final Thoughts

Do reach us via our support channel if you face any problems or slowness issues when using ClusterControl. Suggestions and feedback are very much welcome.

Happy tuning!

One Security System for Application, Connection Pooling and PostgreSQL - The Case for LDAP

$
0
0

Traditionally, the typical application consists of the following components:

In this simple case, a basic setup would suffice:

  • the application uses a simple local authentication mechanism for its users
  • the application uses a simple connection pool
  • there is a single user defined for database access

However, as the organization evolves and gets larger more components are added:

  • more tenant apps or instances of the app accessing the database
  • more services and systems accessing the database
  • central authentication/authorization (AA) for all (or most) services
  • separation of components for easier future scaling

In the above scheme, all concerns are separated into individual components, each component serves a specialized purpose. However, still the connection pool uses a single dedicated database user as in the previous simpler setup we saw above.

Besides the new components, also new requirements arrive:

  • better fine grained control of what users can do on the database level
  • auditing
  • better more useful system logging

We can always implement all three with more application code or more layers in the application, but this is just cumbersome and hard to maintain.

In addition, PostgreSQL offers such a rich set of solutions on the aforementioned areas (security, Row Level Security, auditing, etc) that it makes perfect sense to move all those services to the database layer. In order to take those services directly from the database, we must forget about single user in the database and use real individual users instead.

This takes us to a scheme like the below:

In our use case we will describe a typical enterprise setup consisting of the above scheme where we use:

  • Wildfly app server (examples shown for version 10)
  • LDAP Authentication/Authorization Service
  • pgbouncer connection pooler
  • PostgreSQL 10

It seems like a typical setup, since jboss/wildfly has been supporting LDAP authentication and authorization for many years, PostgreSQL has been supporting LDAP for many years.

However pgbouncer only started support for LDAP (and this via PAM) since version 1.8 in late 2017, which means that someone till then could not use the hottest PostgreSQL connection pooler in such an enterprise setup (which did not sound promising by any angle we choose to look at it)!

In this blog, we will describe the setup needed in each layer.

Wildfly 10 Configuration

The data source configuration will have to look like this, I am showing the most important stuff:

<xa-datasource jndi-name="java:/pgsql" pool-name="pgsqlDS" enabled="true" mcp="org.jboss.jca.core.connectionmanager.pool.mcp.LeakDumperManagedConnectionPool">
	<xa-datasource-property name="DatabaseName">
		yourdbname
	</xa-datasource-property>
	<xa-datasource-property name="PortNumber">
		6432
	</xa-datasource-property>
	<xa-datasource-property name="ServerName">
		your.pgbouncer.server
	</xa-datasource-property>
	<xa-datasource-property name="PrepareThreshold">
		0
	</xa-datasource-property>
	<xa-datasource-class>org.postgresql.xa.PGXADataSource</xa-datasource-class>
	<driver>postgresql-9.4.1212.jar</driver>
	<new-connection-sql>
		SET application_name to 'myapp';
	</new-connection-sql>
	<xa-pool>
		<max-pool-size>400</max-pool-size>
		<allow-multiple-users>true</allow-multiple-users>
	</xa-pool>
	<security>
		<security-domain>postgresqluser</security-domain>
	</security>
</xa-datasource>

I have put in bold the important parameters and values. Remember to define the IP address (or hostname), the database name and the port according to your pgbouncer server’s setup.

Also, instead of the typical username/password, you’ll have to have a security domain defined, which must be specified in the data source section as shown above. Its definition will look like:

<security-domain name="postgresqluser">
	<authentication>
		<login-module code="org.picketbox.datasource.security.CallerIdentityLoginModule" flag="required">
			<module-option name="managedConnectionFactoryName" value="name=pgsql,jboss.jca:service=XATxCM"/>
		</login-module>
	</authentication>
</security-domain>

This way wildfly will delegate the security context to pgbouncer.

NOTE: in this blog we cover the basics, i.e. we make no use or mention of TLS, however you are strongly encouraged to use it in your installation.

The wildfly users must authenticate against your LDAP server as follows:

<login-module code="<your login module class>" flag="sufficient">
	<module-option name="java.naming.provider.url" value="ldap://your.ldap.server/"/>
	<module-option name="java.naming.security.authentication" value="simple"/>
	<module-option name="java.naming.factory.initial" value="com.sun.jndi.ldap.LdapCtxFactory"/>
	<module-option name="principalDNPrefix" value="uid="/>
	<module-option name="uidAttributeID" value="memberOf"/>
	<module-option name="roleNameAttributeID" value="cn"/>
	<module-option name="roleAttributeID" value="memberOf"/>
	<module-option name="principalDNSuffix"
	value=",cn=users,cn=accounts,dc=yourorgname,dc=com"/>
	<module-option name="userSrchBase" value="dc=yourorgname,dc=com"/>
	<module-option name="rolesCtxDN"
	value="cn=groups,cn=accounts,dc=yourorgname,dc=com"/>
	<module-option name="matchOnUserDN" value="true"/>
	<module-option name="unauthendicatedIdentity" value="foousr"/>
	<module-option name="com.sun.jndi.ldap.connect.timeout" value="5000"/>
</login-module>

The above configuration files apply to wildfly 10.0, you are advised in any case to consult the official documentation for your environment.

PostgreSQL Configuration

In order to tell PostgreSQL to authenticate (NOTE: not authorise!) against your LDAP server you have to make the appropriate changes to postgresql.conf and pg_hba.conf. The entries of interest are the following:

In postgresql.conf:

listen_addresses = '*'

and in pg_hba.conf:

#TYPE  DATABASE    USER        CIDR-ADDRESS                  METHOD
host    all         all         ip.ofYourPgbouncer.server/32 ldap ldapserver=your.ldap.server ldapprefix="uid=" ldapsuffix=",cn=users,cn=accounts,dc=yourorgname,dc=com"

Make sure the LDAP settings defined here match exactly the ones you defined in your app server configuration. There are two modes of operation that PostgreSQL can be instructed to contact the LDAP server:

  • simple bind
  • search and then bind

The simple bind mode requires only one connection to the LDAP server therefore it is faster but requires a somehow stricter LDAP dictionary organization than the second mode. The search and bind mode allows for greater flexibility. However, for the average LDAP directory, the first mode (simple bind) will work just fine. We must underline certain points about PostgreSQL LDAP authentication:

  • This has to do with authentication only (checking passwords).
  • Roles membership is still done in PostgreSQL, as usual.
  • The users must be created in PostgreSQL (via CREATE user/role) as usual.

There are some solutions to help with synchronization between LDAP and PostgreSQL users (e.g. ldap2pg) or you can simply write your own wrapper that will handle both LDAP and PostgreSQL for adding or deleting users.

Download the Whitepaper Today
 
PostgreSQL Management & Automation with ClusterControl
Learn about what you need to know to deploy, monitor, manage and scale PostgreSQL

PgBouncer Configuration

This is the hardest part of our setup, due to the fact that native LDAP support is still missing from pgbouncer, and the only option is to authenticate via PAM, which means that this depends on the correct local UNIX/Linux PAM setup for LDAP.

So the procedure is broken into two steps.

The first step is to configure and test that pgbouncer works with PAM, and the second step is to configure PAM to work with LDAP.

pgbouncer

pgbouncer must be compiled with PAM support. In order to do so you will have to:

  • install libpam0g-dev
  • ./configure --with-pam
  • recompile and install pgbouncer

Your pgbouncer.ini (or the name of your pgbouncer configuration file) must be configured for pam. Also, it must contain the correct parameters for your database and your application in accordance with the parameters described in the sections above. Things you will have to define or change:

yourdbname = host=your.pgsql.server dbname=yourdbname pool_size=5
listen_addr = *
auth_type = pam
# set pool_mode for max performance
pool_mode = transaction
# required for JDBC
ignore_startup_parameters = extra_float_digits

Of course, you will have to read the pgbouncer docs and tune your pgbouncer according to your needs. In order to test the above setup all you have to do is create a new local UNIX user and try to authenticate to pgbouncer:

# adduser testuser
<answer to all question, including password>

In order for pgbouncer to work with PAM when reading from the local passwd files, pgbouncer executable must be owned by root and with setuid:

# chown root:staff ~pgbouncer/pgbouncer-1.9.0/pgbouncer     
# chmod +s ~pgbouncer/pgbouncer-1.9.0/pgbouncer
# ls -l ~pgbouncer/pgbouncer-1.9.0/pgbouncer           
-rwsrwsr-x 1 root staff 1672184 Dec 21 16:28 /home/pgbouncer/pgbouncer-1.9.0/pgbouncer

Note: The necessity for root ownership and setuid (which is true for every debian/ubuntu system I have tested) is nowhere documented, neither on the official pgbouncer docs nor anywhere on the net.

Then we login (as pgsql superuser) to the postgresql host (or psql -h your.pgsql.server) and create the new user:

CREATE USER testuser PASSWORD 'same as the UNIX passwd you gave above';

then from the pgbouncer host:

psql -h localhost -p 6432 yourdbname -U testuser

You should be able to get a prompt and see the tables as if you were connected directly to your database server. Remember to delete this user from the system and also drop from the database when you are finished with all your tests.

PAM

In order for PAM to interface with the LDAP server, an additional package is needed: libpam-ldap . Its post install script will run a text mode dialog which you will have to answer with the correct parameters for your LDAP server. This package will make the necessary updates in /etc/pam.d files and also create a file named: /etc/pam_ldap.conf. In case something changes in the future you can always go back and edit this file. The most important lines in this file are:

base cn=users,cn=accounts,dc=yourorgname,dc=com
uri ldap://your.ldap.server/
ldap_version 3
pam_password crypt

The name/address of your LDAP server and the search base must be exactly the same as those specified in the PostgreSQL pg_hba.conf and the Wildfly standalone.xml conf files explained above. pam_login_attribute defaults to uid. You are encouraged to take a look at the /etc/pam.d/common-* files and see what changed after the installation of libpam-ldap. Following the docs, you could create a new file named /etc/pam.d/pgbouncer and define all PAM options there, but the default common-* files will suffice. Let’s take a look in /etc/pam.d/common-auth:

auth    [success=2 default=ignore]      pam_unix.so nullok_secure
auth    [success=1 default=ignore]      pam_ldap.so use_first_pass
auth    requisite                       pam_deny.so
auth    required                        pam_permit.so

Unix passwd will be checked first, and if this fails then LDAP will be checked, so bear in mind that you will have to erase any local passwords for those users who are defined both to the local linux/unix /etc/passwd and in LDAP. Now it is time to do the final test. Choose a user who is defined in your LDAP server and also created in PostgreSQL, and try to authenticate from the DB (via pgsql -h your.pgsql.server ), then from pgbouncer (also via psql -h your.pgbouncer.server), and finally via your app. You just made having one single security system for app, connection pooler and PostgreSQL a reality!

Database Security - How to Use Encryption to Protect Your MongoDB Data

$
0
0

Database security is a key factor to consider for any application that involves highly sensitive data such as financial and health reports. Data protection can be achieved through encryption at different levels starting from the application itself to files holding the data.

Since MongoDB is a non-relational database, one does not need to define columns before inserting data; and therefore documents in the same collection could have different fields from one another.

On the other hand, for SQL DBMS, one has to define columns for the data, hence all the rows have the same columns. One can decide to encrypt individual columns, entire database file or data from the application before being involved in the database process.

Encryption of individual columns is most preferred since it is cheaper and less data is encrypted thus improving on latency. In general, overall performance impacts as a result of the encryption.

For NoSQL DBMS, this approach however will not be the best. Considering that not all documents may have all the fields you want to use in your encryption, column-level encryption cannot be performed.

Encrypting data at application level is quite costly and difficult to implement. We therefore remain with an option of encrypting data at database level.

MongoDB provides native encryption which does not require one to pay an extra cost for securing your sensitive data.

Encrypting Data in MongoDB

Any database operation involves either of these two data forms, data at rest or data in motion.

Data in motion is a stream of data moving through any kind of network whereas data at rest is static hence not moving anywhere.

Both of these wo data types are prone to external interference by anonymous users not unless encryption is involved. The encryption process involves:

  • Generating a master key for the entire database
  • Generating unique keys for each database
  • Encrypting your data with the database keys you generated
  • Encrypting the entire database with the master key

Encrypting Data in Transit

Data is transacted between MongoDB and the server application in two ways that is, through Transport Layer Security (TLS) and Secure Socket Layer (SSL).

These two are the most used encryption protocols for securing sent and received data between two systems. Basically, the concept is to encrypt connections to the mongod and mongos instances such that the network traffic is only readable by the intended client.

TLS/SSL are used in MongoDB with some certificates as PEM files which are issued by the certificate authority or can be a self-signed certificate. The latter has a limitation in that however the communication channel is encrypted, there is always no validation against the server identity hence vulnerable to external attacks midway. It is thus advisable to use trusted authority certificates which permit MongoDB drivers to also verify the server identity.

Besides encryption, TLS/SSL can be used in the authentication of the client and internal auths of members of replica sets and sharded clusters through the certificates.

TLS/SSL Configuration for Clients

There are various TLS/SSL option settings that can be used in the configuration of these protocols.

For example, if you want to connect to a Mongod instance using encryption, you would start your instance like,

mongo --ssl --host example.com --sslCAFile /etc/ssl/ca.pem

--ssl enables the TLS/SSL connection.

--sslCAFile specifies the certificate authority (CA) pem file for verification of the certificate presented by the mongod or the mongos. The Mongo shell will therefore verify the certificate issued by the mongod instance against the specified CA file and the hostname.

You may also want to connect MongoDB instance that requires a client certificate. We use the code sample below

mongo --ssl --host hostname.example.com --sslPEMKeyFile /etc/ssl/client.pem --sslCAFile /etc/ssl/ca.pem

The option --sslPEMKeyFile specifies the .pem file that contains the mongo shell certificate and a key to present to the mongod or mongos instance. During the connection process:

The mongo shell will verify if the certificate is from the specified Certificate Authority that is the (--sslCAFile) and if not, the shell will fail to connect.

Secondly, the shell will also verify if the hostname specified in the --host option matches the SAN/CN in the certificate presented by the mongod or mongos. If this hostname does not match either of the two, then the connection will fail.

If you don’t want to use self-signed certificates, you must ensure the network of connection is trusted.

Besides, you need to reduce the exposure of private key, especially where replica sets/ sharded cluster is involved. This can be achieved by using different certificates on different servers.

Additional options that can be used in the connections are:

requireSSL: this will restrict each server to use only TLS/SSL encrypted connections.

--sslAllowConnectionsWithoutCertificates: This allows validation if only the client presents a certificate otherwise if there is no certificate, the client will still be connected in an encrypted mode. For example:

mongod --sslMode requireSSL --sslAllowConnectionsWithoutCertificates --sslPEMKeyFile /etc/ssl/mongodb.pem --sslCAFile /etc/ssl/ca.pem

sslDisabledProtocols: this option prevents servers from accepting incoming connections that use specific protocols. This can be done with:

mongod --sslMode requireSSL --sslDisabledProtocols TLS1_0,TLS1_1 --sslPEMKeyFile /etc/ssl/mongodb.pem --sslCAFile /etc/ssl/ca.pem

Encrypting Data at Rest

From version 3.2, MongoDB introduced a native encryption option for the WiredTiger storage engine. Access to data in this storage by a third party can only be achieved through a decryption key for decoding the data into a readable format.

The commonly used encryption cipher algorithm in MongoDB is the AES256-GCM. It uses the same secret key to encrypt and decrypt data. Encryption can is turned on using the FIPS mode thus ensuring the encryption meets the highest standard and compliance.

The whole database files are encrypted using the Transparent data encryption (TDE) at the storage level.

Whenever a file is encrypted, a unique private encryption key is generated and is good to understand how these keys are managed and stored. All the database keys generated are thereafter encrypted with a master key.

The difference between the database keys and the master key is that the database keys can be stored alongside the encrypted data itself but for the master key, MongoDB advises it to be stored in a different server from the encrypted data such as third-party enterprise key management solutions.

With replicated data, the encryption criteria are not shared to the other nodes since the data is not natively encrypted over the wire. One can reuse the same key for the nodes but the best practice is to use unique individual keys for every node.

Rotating Encryption Keys

Managed key used for decrypting sensitive data should be rotated or replaced at least once a year. There are two options in MongoDB for achieving the rotation.

KMIP Master Rotation

In this case, only the master key is changed since it is externally managed. The process for rotating the key is as described below.

  1. The master key for the secondary members in the replica set is rotated one at a time. I.e

    mongod --enableEncryption --kmipRotateMasterKey \ --kmipServerName <KMIP Server HostName> \--kmipServerCAFile ca.pem --kmipClientCertificateFile client.pem

    After the process is completed, mongod will exit and you will need to restart the secondary without the kmipRotateMasterKey parameter

    mongod --enableEncryption --kmipServerName <KMIP Server HostName> \
      --kmipServerCAFile ca.pem --kmipClientCertificateFile client.pem
  2. The replica set primary is stepped down:
    Using the rs.stepDown()method, the primary is deactivated hence forcing an election of a new primary.

  3. Check the status of the nodes using the rs.status() method and if the primary indicates to have been stepped down the rotate its master key. Restart the stepped down member including the kmipRotateMasterKey option.

    mongod --enableEncryption --kmipRotateMasterKey \
      --kmipServerName <KMIP Server HostName> \
      --kmipServerCAFile ca.pem --kmipClientCertificateFile client.pem

Logging

MongoDB always works with a log file for recording some status or specified information at different intervals.

However, the log file is not encrypted as part of the storage engine. This poses a risk in that a mongod instance running with logging may output potentially sensitive data to the log files just as part of the normal logging.

From the MongoDB version 3.4, there is the security.redactClientLogData setting which prevents potentially sensitive data from being logged in the mongod process log. However, this option can complicate the log diagnostics.

Severalnines
 
Become a MongoDB DBA - Bringing MongoDB to Production
Learn about what you need to know to deploy, monitor, manage and scale MongoDB

Encryption Performance in MongoDB

Encryption at some point results in increased latency hence degrading the performance of a database. This is usually the case when a large volume of documents is involved.

Encrypting and decrypting require more resources hence is important to understand this relationship in order to adjust capacity planning accordingly.

Regarding the MongoDB tests, an encrypted storage engine will experience a latency of between 10% to 20% at the highest load. This often the case when a user writes a large amount of data to the database hence resulting in reduced performance. For read operations, the performance degradation is negligible, about 5 - 10%.

For a better encryption practice in MongoDB, the WiredTiger storage engine is most preferred due to its high performance, security, and scalability. Further, it optimizes encryption of database files to page level which has great merit in that, if a user reads or writes data to the encrypted database, the throughput operation will only be applied to the page on which the data is stored rather than the entire database.

This will reduce the amount of data that will need to be encrypted and decrypted for processing a single piece of data.

Summary

Data security for sensitive information is a must and there is need to protect it without degrading the performance of the database system.

MongoDB provides a robust native encryption procedures that can help us secure our data both one at rest and that in motion. Besides, the encryption procedures should comply with the set standards by different organizations.

The advanced WiredTiger storage engine provides a better option due to its associated merits such as high performance, scalability, and security. When encrypting data in replica sets, it is a good practice to use different master keys for each besides changing them at least once a year.

However the availability of third-party encryption options, there is no guarantee that your deployment will match alongside them in terms of scalability. It is thus quite considerate to employ database level encryption.

How to Backup and Restore ClusterControl

$
0
0

ClusterControl 1.7.1 introduced a new feature which allows you to backup your ClusterControl server and restore it (together with metadata about your managed databases) onto another server. It backs up the ClusterControl application as well as all its configuration data. Migrating ClusterControl to a new server used to be a pain, but not any more.

This blog post walks you through this new feature.

We will migrate ClusterControl from one server to another, preserving all the configurations and settings.

We will also show you how to transfer the management of a cluster from one ClusterControl instance to another.

Our example architecture started with two production clusters (shown in the screenshot below):

  • Cluster ID 1: 3 Galera nodes (PXC) + 1 HAProxy + 1 ProxySQL (5 nodes)
  • Cluster ID 2: 1 MySQL master + 2 MySQL slaves + 1 ProxySQL (4 nodes)

Introduction

ClusterControl CLI (s9s) is a command line interface tool to interact, control and manage database clusters using the ClusterControl Platform. Starting from version 1.4.1, the installer script will automatically install this package on the ClusterControl node.

There are basically 4 new options introduced under "s9s backup" command, which can be used to achieve our objective:

FlagDescription
--save-controllerSaves the state of the controller into a tarball.
--restore-controllerRestores the entire controller from a previously created tarball (created by using the --save-controller
--save-cluster-infoSaves the information the controller has about one cluster.
--restore-cluster-infoRestores the information the controller has about a cluster from a previously created archive file.

This blog post will cover example use cases on how to utilize those options. At the moment, they are in release candidate stage and only available via ClusterControl CLI tool.

Backing Up ClusterControl

In order to do this, the ClusterControl server must be at least on v1.7.1 and later. To backup ClusterControl controller, simply run the following command on the ClusterControl node as root user (or with sudo):

$ s9s backup \
--save-controller \
--backup-directory=$HOME/ccbackup \
--output-file=controller.tar.gz \
--log

The --output-file must be a filename or physical path (if you want to omit --backup-directory flag), and the file must not exist beforehand. ClusterControl won't replace the output file if it already exists. By specifying --log, it will wait until the job is executed and the job logs will be shown in the terminal. The same logs can be accessed via ClusterControl UI under Activity -> Jobs -> Save Controller:

The 'Save Controller' job basically performs the following procedures:

  1. Retrieve the controller configuration and export it to JSON
  2. Export CMON database as MySQL dump file
  3. For every database cluster:
    1. Retrieve the cluster configuration and export it to JSON

In the output, you may notice the job found is N + 1 cluster, for example "Found 3 cluster(s) to save" even though we only have two database clusters. This includes cluster ID 0, which carries special meaning in ClusterControl as the global initialized cluster. However, it does not belong to CmonCluster component, which is the database cluster under ClusterControl management.

Restoring ClusterControl to a new ClusterControl server

Supposed ClusterControl is already installed on the new server, we would like to migrate the database clusters to be managed by the new server. The following diagram illustrates our migration exercise:

Firstly, transfer the backup from the old server into the new server:

$ scp $HOME/ccbackup/controller.tar.gz 192.168.0.190:~

Before we perform the restoration, we have to set up passwordless SSH to all nodes from the new ClusterControl server:

$ ssh-copy-id 192.168.0.11 #proxysql cluster 1
$ ssh-copy-id 192.168.0.12 #proxysql cluster 1
$ ssh-copy-id 192.168.0.21 #pxc cluster 1
$ ssh-copy-id 192.168.0.22 #pxc cluster 1
$ ssh-copy-id 192.168.0.23 #pxc cluster 1
$ ssh-copy-id 192.168.0.30 #proxysql cluster 2
$ ssh-copy-id 192.168.0.31 #mysql cluster 2
$ ssh-copy-id 192.168.0.32 #mysql cluster 2
$ ssh-copy-id 192.168.0.33 #mysql cluster 2

Then, on the new server, perform the restoration:

$ s9s backup \
--restore-controller \
--input-file=$HOME/controller.tar.gz \
--debug \
--log

Then we have to sync the cluster in the UI by going to Global Settings -> Cluster Registrations -> Synchronize Cluster. Then if you go back to the ClusterControl main dashboard, you would see the following:

Don't panic. The new ClusterControl UI is not able to retrieve the monitoring and management data because of incorrect RPC API token. We just need to update it accordingly. First, retrieve the rpc_key value for the respective clusters:

$ cat /etc/cmon.d/cmon_*.cnf | egrep 'cluster_id|rpc_key'
cluster_id=1
rpc_key=8fgkzdW8gAm2pL4L
cluster_id=2
rpc_key=tAnvKME53N1n8vCC

In the UI, click the link "here" at the then of the "Change the RPC API token here" line. It will pop up the following dialog:

Paste the respective rpc_key value in the text field and click Save. Repeat for the next cluster. Wait for a moment and the cluster list should be refreshed automatically.

The last step is to fix the MySQL cmon user privileges for the new ClusterControl IP address changes, 192.168.0.190. Login to one of the PXC node and run the following:

$ mysql -uroot -p -e 'GRANT ALL PRIVILEGES ON *.* TO cmon@"192.168.0.190" IDENTIFIED BY "<password>" WITH GRANT OPTION';

** Replace <password> with identical cmon MySQL password as in mysql_password value inside /etc/cmon.cnf. Repeat the same step on the second cluster, MySQL replication but only execute it once on the master node.

Once the privilege is set up, you should see the cluster list is in green, similar to the old one:

It's worth to mention that by default, ClusterControl will disable the cluster automatic recovery (as you can see the red icon next to the word 'Cluster') to avoid race condition with another ClusterControl instance. It's recommended to enable this feature (by clicking the icon to green) once the old server has been decommissioned.

Our migration is now completed. All the configurations and settings from the old server are preserved and transferred to the new server.

Migrating the Management of a Cluster to another ClusterControl server

Backing Up Cluster Information

This is about backing up cluster metadata and information so we can transfer it to another ClusterControl server, also known as partial backup. Otherwise, we have to perform "Import Existing Server/Cluster" to re-import them into the new ClusterControl which means you would lose the monitoring data from the old server. If you have load balancers or asynchronous slave instances, this would have to be imported once the cluster is imported, one node at a time. So it is a bit hassle if you have a complete set of production setup.

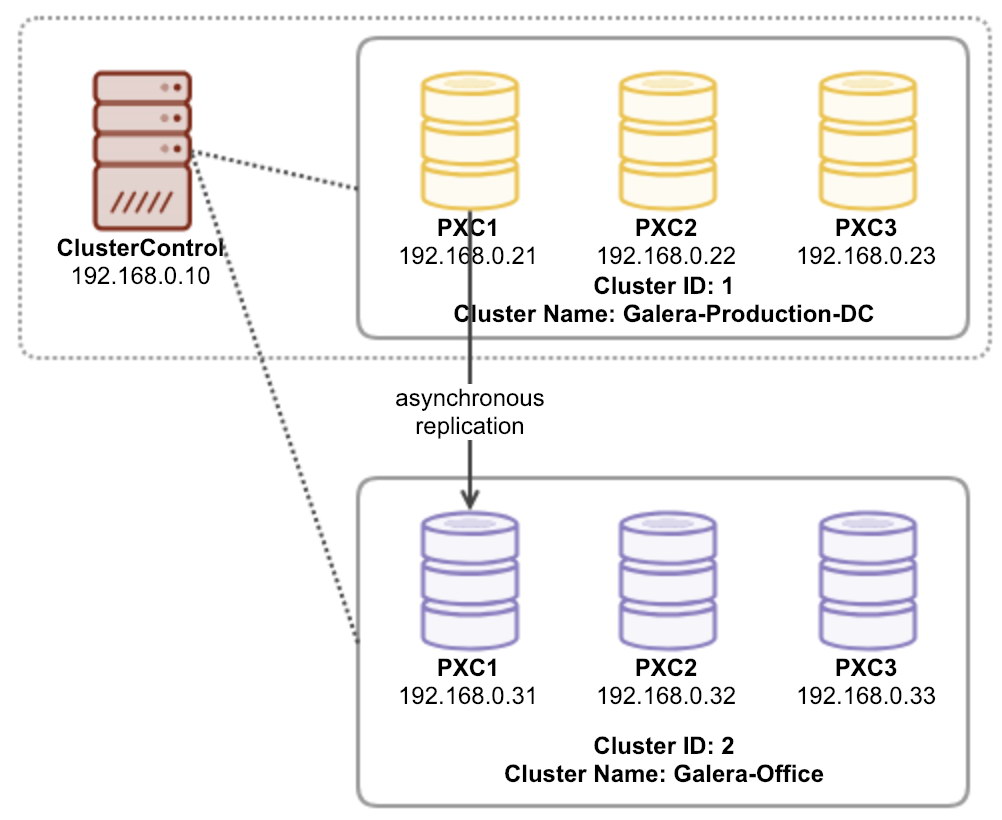
The cluster "manager" migration exercise is illustrated in the following diagram:

Basically, we want to migrate out our MySQL Replication (cluster ID: 2) to be managed by another ClusterControl instance. We are going to use --save-cluster-info and --restore-cluster-info options for this one. The --save-cluster-info option will export the corresponding cluster information to be saved somewhere else. Let's export our MySQL Replication Cluster (cluster ID: 2). On the current ClusterControl server, do:

$ s9s backup \
--save-cluster-info \
--cluster-id=2 \
--backup-directory=$HOME/ccbackup \
--output-file=cc-replication-2.tar.gz \
--log

You will see a bunch of new lines printed in the terminal, indicating the backup job is running (the output is also accessible via ClusterControl -> Activity -> Jobs):

If you look at the job logs closely, you would notice the job was trying to export all the related information and metadata for cluster ID 2. The output is stored as a compressed file and located under path that we have specified under using --backup-directory flag. If this flag is ignored, ClusterControl will save the output to the default backup directory which is the home directory of the SSH user, under $HOME/backups.

Restoring Cluster Information

The steps explained here are similar with the restoration steps for ClusterControl full backup. Transfer the backup from the current server to the other ClusterControl server:

$ scp $HOME/ccbackup/cc-replication-2.tar.gz 192.168.0.190:~

Before we perform the restoration, we have to set up passwordless SSH to all nodes from the new ClusterControl server:

$ ssh-copy-id 192.168.0.30 #proxysql cluster 2
$ ssh-copy-id 192.168.0.31 #mysql cluster 2
$ ssh-copy-id 192.168.0.32 #mysql cluster 2
$ ssh-copy-id 192.168.0.33 #mysql cluster 2
$ ssh-copy-id 192.168.0.19 #prometheus cluster 2

Then, on the new server, perform the cluster information restoration for our MySQL Replication:

$ s9s backup \
--restore-cluster-info \
--input-file=$HOME/cc-replication-2.tar.gz \
--log

You can verify the progress under Activity -> Jobs -> Restore Cluster:

If you look at the job messages closely, you can see that ClusterControl automatically re-assigns cluster ID to 1 on this new instance (it was cluster ID 2 on the old instance).

Then sync the cluster in the UI by going to Global Settings -> Cluster Registrations -> Synchronize Cluster. If you go back to the ClusterControl main dashboard, you would see the following:

The error means the new ClusterControl UI is not able to retrieve the monitoring and management data because of incorrect RPC API token. We just need to update it accordingly. Firstly, retrieve the rpc_key value for our cluster ID 1:

$ cat /etc/cmon.d/cmon_1.cnf | egrep 'cluster_id|rpc_key'
cluster_id=1
rpc_key=tAnvKME53N1n8vCC

In the UI, click the link "here" at the then of the "Change the RPC API token here" line. It will pop up the following dialog:

Paste the respective rpc_key value in the text field and click Save. Wait for a moment and the cluster list should be refreshed automatically.

The last step is to fix the MySQL cmon user privileges for the new ClusterControl IP address changes, 192.168.0.190. Login to the master node (192.168.0.31) and run the following statement:

$ mysql -uroot -p -e 'GRANT ALL PRIVILEGES ON *.* TO cmon@"192.168.0.190" IDENTIFIED BY "<password>" WITH GRANT OPTION';

** Replace <password> with identical cmon MySQL password as in mysql_password value inside /etc/cmon.cnf.

You may also revoke the old user privileges (revoke won't delete the user) or simply drop the old user:

$ mysql -uroot -p -e 'DROP USER cmon@"192.168.0.19"'

Once the privilege is set up, you should see everything is green:

At this point, our architecture is looking something like this:

Our migration exercise is now complete.

Final Thoughts

It's now possible to perform full and partial backup of your ClusterControl instances and the clusters they manage, allowing you to move them freely between hosts with little efforts. Suggestions and feedback are welcome.


An Overview of JSON Capabilities Within PostgreSQL

$
0
0

What is JSON?

JSON stands for “JavaScript Object Notification” which is a type of data format popularly used by web applications. This means, the data would be transmitted between web applications and servers in such a format. JSON was introduced as an alternative to the XML format. In the “good old days” the data used to get transmitted in XML format which is a heavy weight data type compared to JSON.Below is an example of JSON formatted string:

{ "ID":"001","name": "Ven", "Country": "Australia",  "city": "Sydney", "Job Title":"Database Consultant"}

A JSON string can contain another JSON object with-in itself like shown below:

{ "ID":"001", "name": "Ven", "Job Title":"Database Consultant", "Location":{"Suburb":"Dee Why","city": "Sydney","State":"NSW","Country": "Australia"}}

Modern day web and mobile applications mostly generate the data in JSON format, also termed as “JSON Bytes” which are picked up by the application servers and are sent across to the database. The JSON bytes are in-turn processed, broken down into separate column values and inserted into an RDBMS table.
Example:

{ "ID":"001","name": "Ven", "Country": "Australia",  "city": "Sydney", "Job Title":"Database Consultant"}

Above JSON data is converted to an SQL like below..

Insert into test (id, name, country,city,job_title) values  (001,'Ven','Australia','Sydney','Database Consultant');

When it comes to storing and processing the JSON data, there are various NoSQL databases supporting it and the most popular one is MongoDB. When it comes to RDBMS databases, until recent times, JSON strings were treated as normal text and there were no data types which specifically recognize, store or process JSON format strings. PostgreSQL, the most popular open-source RDBMS database has come up with JSON data-type which turned out to be highly beneficial for performance, functionality and scalability when it comes to handling JSON data.

PostgreSQL + JSON

PostgreSQL database has become more-and-more popular ever since the JSON data-type was introduced. In-fact, PostgreSQL has been outperforming MongoDB when it comes to processing a large amount of JSON data. The applications can store JSON strings in the PostgreSQL database in the standard JSON format. Developers just need to tell the application to send across the JSON strings to the database as a json data-type and retrieve back in the JSON format. Storing of JSON string in JSON data-type has several advantageous compared to storing the same in TEXT data-type. JSON data-type can accept only valid JSON formatted strings, if the string is not in correct JSON format, an error is generated. JSON data-type helps the application perform efficient and Index based searches which, we will see in detail shortly.

The JSON data-type was introduced in PostgreSQL-9.2 post which, significant enhancements were made. The major addition came-up in PostgreSQL-9.4 with the addition of JSONB data-type. JSONB is an advanced version of JSON data-type which stores the JSON data in binary format. This is the major enhancement which made a big difference to the way JSON data was searched and processed in PostgreSQL. Let us have a detailed look at the advantages of JSON data types.

JSON and JSONB Data Types

JSON data-type stores json formatted strings as a text which is not very powerful and does not support many JSON related functions used for searches. It supports only traditional B-TREE indexing and does not support other Index types which are imperative for faster and efficient search operations across JSON data.

JSONB, the advanced version of JSON data type, is highly recommended for storing and processing JSON documents. It supports a wide range of json operators and has numerous advantages over JSON, like storing JSON formatted strings in binary format, and supporting JSON functions and indexing, to perform efficient searches.

Let us look at the differences.

 JSONJSONB
1Pretty much like a TEXT data type which stores only valid JSON document.Stores the JSON documents in Binary format.
2Stores the JSON documents as-is including white spaces.Trims off white spaces and stores in a format conducive for faster and efficient searches
3Does not support FULL-TEXT-SEARCH IndexingSupports FULL-TEXT-SEARCH Indexing
4Does not support wide range of JSON functions and operatorsSupports all the JSON functions and operators

Example for #4 Listed Above

JSON

Below is a table with JSON data type

dbt3=# \d product
                   Table "dbt3.product"
     Column     |  Type  | Collation | Nullable | Default
----------------+--------+-----------+----------+---------
 item_code      | bigint |           | not null |
 productdetails | json   |           |          |
Indexes:
    "product_pkey" PRIMARY KEY, btree (item_code)

Does not support traditional JSON operators (like “@>” or “#>”). Full-Text-Search through JSON data is done using “@>” or “#>” in an SQL which is not supported by JSON data type

dbt3=# select * from product where productdetails @> '{"l_shipmode":"AIR"}' and productdetails @> '{"l_quantity":"27"}';
ERROR:  operator does not exist: json @> unknown
LINE 1: select * from product where productdetails @> '{"l_shipmode"...
                                                   ^
HINT:  No operator matches the given name and argument types. You might need to add explicit type casts.
dbt3=#

JSONB

Below is a table with JSONB data type

dbt3=# \d products
                  Table "dbt3.products"
    Column     |  Type  | Collation | Nullable | Default
---------------+--------+-----------+----------+---------
 item_code     | bigint |           | not null |
 order_details | jsonb  |           |          |
Indexes:
    "products_pkey" PRIMARY KEY, btree (item_code)

Supports FULL-TEXT-SEARCHING through JSON data using operators (like “@>”)

dbt3=# select * from products where order_details @> '{"l_shipmode" : "AIR"}' limit 2;
 item_code |                                                                                        order_details
-----------+----------------------------------------------------------------------------------------------------------------------------------------------------------------------------------------------
         4 | {"l_partkey": 21315, "l_orderkey": 1, "l_quantity": 28, "l_shipdate": "1996-04-21", "l_shipmode": "AIR", "l_commitdate": "1996-03-30", "l_shipinstruct": "NONE", "l_extendedprice": 34616.7}
         8 | {"l_partkey": 42970, "l_orderkey": 3, "l_quantity": 45, "l_shipdate": "1994-02-02", "l_shipmode": "AIR", "l_commitdate": "1994-01-04", "l_shipinstruct": "NONE", "l_extendedprice": 86083.6}
(2 rows)
Download the Whitepaper Today
 
PostgreSQL Management & Automation with ClusterControl
Learn about what you need to know to deploy, monitor, manage and scale PostgreSQL

How to Query JSON Data

Let us take a look at some PostgreSQL JSON capabilities related to data operationsBelow is how the JSON data looks in a Table. Column “order_details” is of type JSONB

dbt3=# select * from product_details ;
 item_code |                                                                                                 order_details
-----------+---------------------------------------------------------------------------------------------------------------------------------------------------------------------------------------------------------------
         1 | {"l_partkey": 1551894, "l_orderkey": 1, "l_quantity": 17, "l_shipdate": "1996-03-13", "l_shipmode": "TRUCK", "l_commitdate": "1996-02-12", "l_shipinstruct": "DELIVER IN PERSON", "l_extendedprice": 33078.9}
         2 | {"l_partkey": 673091, "l_orderkey": 1, "l_quantity": 36, "l_shipdate": "1996-04-12", "l_shipmode": "MAIL", "l_commitdate": "1996-02-28", "l_shipinstruct": "TAKE BACK RETURN", "l_extendedprice": 38306.2}
         3 | {"l_partkey": 636998, "l_orderkey": 1, "l_quantity": 8, "l_shipdate": "1996-01-29", "l_shipmode": "REG AIR", "l_commitdate": "1996-03-05", "l_shipinstruct": "TAKE BACK RETURN", "l_extendedprice": 15479.7}
         4 | {"l_partkey": 21315, "l_orderkey": 1, "l_quantity": 28, "l_shipdate": "1996-04-21", "l_shipmode": "AIR", "l_commitdate": "1996-03-30", "l_shipinstruct": "NONE", "l_extendedprice": 34616.7}
         5 | {"l_partkey": 240267, "l_orderkey": 1, "l_quantity": 24, "l_shipdate": "1996-03-30", "l_shipmode": "FOB", "l_commitdate": "1996-03-14", "l_shipinstruct": "NONE", "l_extendedprice": 28974}
         6 | {"l_partkey": 156345, "l_orderkey": 1, "l_quantity": 32, "l_shipdate": "1996-01-30", "l_shipmode": "MAIL", "l_commitdate": "1996-02-07", "l_shipinstruct": "DELIVER IN PERSON", "l_extendedprice": 44842.9}
         7 | {"l_partkey": 1061698, "l_orderkey": 2, "l_quantity": 38, "l_shipdate": "1997-01-28", "l_shipmode": "RAIL", "l_commitdate": "1997-01-14", "l_shipinstruct": "TAKE BACK RETURN", "l_extendedprice": 63066.3}
         8 | {"l_partkey": 42970, "l_orderkey": 3, "l_quantity": 45, "l_shipdate": "1994-02-02", "l_shipmode": "AIR", "l_commitdate": "1994-01-04", "l_shipinstruct": "NONE", "l_extendedprice": 86083.6}
         9 | {"l_partkey": 190355, "l_orderkey": 3, "l_quantity": 49, "l_shipdate": "1993-11-09", "l_shipmode": "RAIL", "l_commitdate": "1993-12-20", "l_shipinstruct": "TAKE BACK RETURN", "l_extendedprice": 70822.1}
        10 | {"l_partkey": 1284483, "l_orderkey": 3, "l_quantity": 27, "l_shipdate": "1994-01-16", "l_shipmode": "SHIP", "l_commitdate": "1993-11-22", "l_shipinstruct": "DELIVER IN PERSON", "l_extendedprice": 39620.3}
(10 rows)

Select all the item codes including their shipment dates

dbt3=# select item_code, order_details->'l_shipdate' as shipment_date from product_details ;

 item_code | shipment_date
-----------+---------------
         1 | "1996-03-13"
         2 | "1996-04-12"
         3 | "1996-01-29"
         4 | "1996-04-21"
         5 | "1996-03-30"
         6 | "1996-01-30"
         7 | "1997-01-28"
         8 | "1994-02-02"
         9 | "1993-11-09"
        10 | "1994-01-16"
(10 rows)

Get the item_code, quantity and price of all the orders arrived by air

dbt3=# select item_code, order_details->'l_quantity' as quantity, order_details->'l_extendedprice' as price, order_details->'l_shipmode' as price from product_details where order_details->>'l_shipmode'='AIR';

 item_code | quantity |  price  | price
-----------+----------+---------+-------
         4 | 28       | 34616.7 | "AIR"
         8 | 45       | 86083.6 | "AIR"
(2 rows)

The JSON operators “->” and “->>” are used for selections and comparisons in the SQL query. The “->” operator returns the JSON Object field as a field in quotes and the operator “->>” returns the JSON object field as TEXT.  The above two SQLs are examples of displaying JSON field values as-is. Below is the example of extracting the JSON field in the TEXT form.
Below is an example of fetching the JSON field in the form of TEXT

dbt3=# select item_code, order_details->>'l_shipdate' as shipment_date from product_details ;
 item_code | shipment_date
-----------+---------------
         1 | 1996-03-13
         2 | 1996-04-12
         3 | 1996-01-29
         4 | 1996-04-21
         5 | 1996-03-30
         6 | 1996-01-30
         7 | 1997-01-28
         8 | 1994-02-02
         9 | 1993-11-09
        10 | 1994-01-16
(10 rows)

There is another operator called “#>” which is used to query the data part of a JSON Element which is in-turn part of a JSON string. Let us look at an example.
Below is the data in the table.

dbt3=# select * from test_json ;
  id   |                                                                                                details
-------+--------------------------------------------------------------------------------------------------------------------------------------------------------------------------------------------------------
 10000 | {"Job": "Database Consultant", "name": "Venkata", "Location": {"city": "Sydney", "State": "NSW", "Suburb": "Dee Why", "Country": "Australia"}}
 20000 | {"Job": "Database Consultant", "name": "Smith", "Location": {"city": "Sydney", "State": "NSW", "Suburb": "Manly", "Country": "Australia"}}
 30000 | {"Job": "Developer", "name": "John", "Location": {"city": "Sydney", "State": "NSW", "Suburb": "Brookvale", "Country": "Australia"}}
 50000 | {"cars": {"Ford": [{"doors": 4, "model": "Taurus"}, {"doors": 4, "model": "Escort"}], "Nissan": [{"doors": 4, "model": "Sentra"}, {"doors": 4, "model": "Maxima"}, {"doors": 2, "model": "Skyline"}]}}
 40000 | {"Job": "Architect", "name": "James", "Location": {"city": "Melbourne", "State": "NSW", "Suburb": "Trugnania", "Country": "Australia"}}

I want to see all the details with “State” “NSW” and “State” is the JSON object key which is part of the key “Location”. Below is how to query the same.

dbt3=# select * from test_json where details #> '{Location,State}'='"NSW"';
  id   |                                                                    details
-------+------------------------------------------------------------------------------------------------------------------------------------------------
 10000 | {"Job": "Database Consultant", "name": "Venkata", "Location": {"city": "Sydney", "State": "NSW", "Suburb": "Dee Why", "Country": "Australia"}}
 20000 | {"Job": "Database Consultant", "name": "Smith", "Location": {"city": "Sydney", "State": "NSW", "Suburb": "Manly", "Country": "Australia"}}
 30000 | {"Job": "Developer", "name": "John", "Location": {"city": "Sydney", "State": "NSW", "Suburb": "Brookvale", "Country": "Australia"}}
 30000 | {"Job": "Architect", "name": "James", "Location": {"city": "Melbourne", "State": "NSW", "Suburb": "Trugnania", "Country": "Australia"}}
(4 rows)

Arithmetic operations can be performed on JSON data. Type casting is needed as the data part of JSON column is TEXT.

dbt3=# select item_code, order_details->'l_quantity' as quantity, order_details->'l_extendedprice' as price, order_details->'l_shipmode' as price from product_details where (order_details->'l_quantity')::int > 10;
 item_code | quantity |  price  |  price
-----------+----------+---------+---------
         1 | 17       | 33078.9 | "TRUCK"
         2 | 36       | 38306.2 | "MAIL"
         4 | 28       | 34616.7 | "AIR"
         5 | 24       | 28974   | "FOB"
         6 | 32       | 44842.9 | "MAIL"
         7 | 38       | 63066.3 | "RAIL"
         8 | 45       | 86083.6 | "AIR"
         9 | 49       | 70822.1 | "RAIL"
        10 | 27       | 39620.3 | "SHIP"
(9 rows)

Apart from all of the above, following operations can also be performed on JSON using SQLs including JOINs

  1. Sorting the data using ORDER BY clause
  2. Aggregation using aggregate functions like SUM, AVG, MIN, MAX etc
  3. Group the data using GROUP BY clause

How About Performance?

The data in JSON columns will be of text in nature and based on the data size performance problems can be expected. Searches through JSON data can taketime and computing power resulting in slow responses to the application(s). It is imperative for DBAs to ensure SQLs hitting the JSON columns are responding fast enough and rendering good performance. Since the data extraction is done via SQL, The option the DBAs would look for is the possibility of Indexing and yes, JSON Data types do support Indexing options.

Let us take a look at the Indexing options JSON brings us.

Indexing JSONB

JSONB data type supports FULL-TEXT-SEARCH Indexing. This is the most important capability of JSONB which DBAs will be looking forward to when using JSONB data types. A normal Index on an JSON Object key may not help when using JSON specific operators in the search queries.Below is an TEXT SEARCH query which goes for a FULL-TABLE-SCAN

dbt3=# explain select * from products where order_details @> '{"l_shipmode" : "AIR"}';
                             QUERY PLAN
--------------------------------------------------------------------
 Seq Scan on products  (cost=0.00..4205822.65 rows=59986 width=252)
   Filter: (order_details @> '{"l_shipmode": "AIR"}'::jsonb)
(2 rows)

JSONB supports FULL-TEXT-SEARCH Index type called GIN which helps queries like above.
Now, let me create a GIN Index and see if that helps

dbt3=# create index od_gin_idx on products using gin(order_details jsonb_path_ops);
CREATE INDEX

If you can observe below, the query pickups the GIN Index

dbt3=# explain select * from products where order_details @> '{"l_shipmode" : "AIR"}';
                                  QUERY PLAN
-------------------------------------------------------------------------------
 Bitmap Heap Scan on products  (cost=576.89..215803.18 rows=59986 width=252)
   Recheck Cond: (order_details @> '{"l_shipmode": "AIR"}'::jsonb)
   ->  Bitmap Index Scan on od_gin_idx  (cost=0.00..561.90 rows=59986 width=0)
         Index Cond: (order_details @> '{"l_shipmode": "AIR"}'::jsonb)

And a B-TREE index instead of GIN would NOT help

dbt3=# create index idx on products((order_details->>'l_shipmode'));
CREATE INDEX

dbt3=# \d products
                  Table "dbt3.products"
    Column     |  Type  | Collation | Nullable | Default
---------------+--------+-----------+----------+---------
 item_code     | bigint |           | not null |
 order_details | jsonb  |           |          |
Indexes:
    "products_pkey" PRIMARY KEY, btree (item_code)
    "idx" btree ((order_details ->> 'l_shipmode'::text))

You can see below, the query prefers FULL-TABLE-SCAN

dbt3=# explain select * from products where order_details @> '{"l_shipmode" : "AIR"}';
                             QUERY PLAN
--------------------------------------------------------------------
 Seq Scan on products  (cost=0.00..4205822.65 rows=59986 width=252)
   Filter: (order_details @> '{"l_shipmode": "AIR"}'::jsonb)

What is GIN Index ?

GIN stands for Generalised Inverted Index. The core capability of GIN Index is to speed up full text searches. When performing searching based on specific Keys or elements in a TEXT or a document, GIN Index is the way to go. GIN Index stores “Key” (or an element or a value) and the “position list” pairs. The position list is the rowID of the key. This means, if the “Key” occurs at multiple places in the document, GIN Index stores the Key only once along with its position of occurrences which not only keeps the GIN Index compact in size and also helps speed-up the searches in a great way. This is the enhancement in Postgres-9.4.

Challenges with GIN Index

Depending on the complexity of the data, maintaining GIN Indexes can be expensive. Creation of GIN Indexes consumes time and resources as the Index has to search through the whole document to find the Keys and their row IDs. It can be even more challenging if the GIN index is bloated. Also, the size of the GIN index can be very big based on the data size and complexity.

Indexing JSON

JSON does not support text searching and Indexes like GIN

dbt3=# create index pd_gin_idx on product using gin(productdetails jsonb_path_ops);
ERROR:  operator class "jsonb_path_ops" does not accept data type json

Normal Indexing like B-TREE is supported by both JSON and JSONB

Yes, normal indexes like B-TREE Index is supported by both JSON and JSONB data types and is not conducive for text search operations. Each JSON object key can be Indexed individually which would really help ONLY when the same object key is used in the WHERE clause.
Let me create an B-TREE Index on JSONB and see how it works

dbt3=# create index idx on products((order_details->>'l_shipmode'));
CREATE INDEX

dbt3=# \d products
                  Table "dbt3.products"
    Column     |  Type  | Collation | Nullable | Default
---------------+--------+-----------+----------+---------
 item_code     | bigint |           | not null |
 order_details | jsonb  |           |          |
Indexes:
    "products_pkey" PRIMARY KEY, btree (item_code)
    "idx" btree ((order_details ->> 'l_shipmode'::text))

We have already learned above that a B-TREE index is NOT useful for speeding up SQLs doing FULL-TEXT-SEARCHING on the JSON data using operators (like “@>”) , and such Indexes would ONLY help speed-up the queries like the one below, which are typical RDBMS type SQLs (which are not search queries). Each of the JSON Object key can be Indexed individually, which would help queries speed-up when those Indexed JSON Object Keys are used the WHERE clause.
The example below query uses “l_shipmode” Object Key in the WHERE clause and since it is Indexed the query is going for an index scan. If you wish to search using a different Object Key, then, the query would choose to do a FULL-TABLE-SCAN.

dbt3=# explain select * from products where order_details->>'l_shipmode'='AIR';
                                   QUERY PLAN
---------------------------------------------------------------------------------
 Index Scan using idx on products  (cost=0.56..1158369.34 rows=299930 width=252)
   Index Cond: ((order_details ->> 'l_shipmode'::text) = 'AIR'::text)

Same works with JSON data type as well

dbt3=# create index idx on products((order_details->>'l_shipmode'));
CREATE INDEX

dbt3=# \d products
                  Table "dbt3.products"
    Column     |  Type  | Collation | Nullable | Default
---------------+--------+-----------+----------+---------
 item_code     | bigint |           | not null |
 order_details | json  |           |          |
Indexes:
    "products_pkey" PRIMARY KEY, btree (item_code)
    "idx" btree ((order_details ->> 'l_shipmode'::text))

If you can observe, the query is using the Index

dbt3=# explain select * from products where order_details->>'l_shipmode'='AIR';
                                   QUERY PLAN
---------------------------------------------------------------------------------
 Index Scan using idx on products  (cost=0.56..1158369.34 rows=299930 width=252)
   Index Cond: ((order_details ->> 'l_shipmode'::text) = 'AIR'::text)

Conclusion

Here are some things to remember when using PostgreSQL JSON Data...

  • PostgreSQL is one of the best options to store and process JSON Data
  • With all the powerful features, PostgreSQL can be your document database
  • I have seen architectures where two or more data stores are chosen, with a mixture of PostgreSQL and NoSQL databases like MongoDB or Couchbase database. A REST API would help applications push the data to different data stores. With PostgreSQL supporting JSON this complexity in architecture can be avoided by just choosing one data store.
  • JSON data in PostgreSQL can be queried and Indexed which renders incredible performance and scalability
  • JSONB Data type is the most preferred option as it is good at storage and performance. Fully supports FULL-TEXT-SEARCHING and Indexing. Renders good performance
  • Use JSON data type only if you want to store JSON strings as JSON and you are not performing much complex text searches
  • The biggest advantage of having JSON in PostgreSQL is that the search can be performed using SQLs
  • The JSON search performance in PostgreSQL has been on-par with best NoSQL databases like MongoDB

Analytics with MariaDB AX - the Open Source Columnar Datastore

$
0
0

Long gone are the days of the one-database-fits-all approach.

With increasing requirements on velocity, performance and agility, numerous datastores emerged, which are intended to solve one particular problem. We have relational databases, document stores, time-series databases, columnar databases, full text search engines.

It is quite common to see multiple datastores work together in the same environment.

So how does MariaDB AX fit in the picture? How does it compare with MariaDB TX and what problem does it solve?

In this blog post, we will have a look at MariaDB AX, and see why you may want to use it.

What is MariaDB AX?

First things first, so what is MariaDB AX?

It is a column store, and it stores its data by ...column! It is implemented as a separate engine in MariaDB 10.3 database.

As you may know, MySQL and MariaDB are designed to use pluggable storage engines. Every storage engine, be it InnoDB, Aria, MyRocks, Spider or any other engines are plugins.

In the same way, MariaDB AX uses ColumnStore engine:

MariaDB [(none)]> SHOW ENGINES\G
*************************** 1. row ***************************
      Engine: Columnstore
     Support: YES
     Comment: Columnstore storage engine
Transactions: YES
          XA: NO
  Savepoints: NO

This results in an interesting combination. The SQL parsing is done by MariaDB, thus you can expect to work with query syntax which is very similar to what you are used to in MariaDB. This makes it also easier to combine access to both MariaDB AX and MariaDB TX in the same application. No need for any specific connectors or libraries to connect to two datastores. All can be done using MySQL or MariaDB client library. You can also utilize MaxScale for both datastores, which can help to build high availability for MariaDB AX.

Why Should We Use a Columnar Datastore?

Let’s go through a short introduction to the idea behind columnar datastores.

What makes MariaDB AX different from MariaDB TX?

The main difference is how the data is structured. In typical database data is stored as rows.

Id, Product, Price, Code, Warehouse
1, Door, 10, 12334, EU1
2, Window, 9, 9523, EU1
3, Glass, 12, 97643, EU2

As you can see, we have three rows, each containing all the data about a product entry.

The problem is, this way of storing data is not really efficient when you want to get just a subset of this data. Let’s say you want to get just the “Product” and “Price” columns - to do that you have to read whole rows, all the data and then discard the unneeded columns. It is also tricky to sort the data. If you would like to sort the dataset from the most expensive to the cheapest product you have to read everything and then do the sort.

We all know that databases utilize indexes to speed up access. An index is structured in a way that it contains the content of the indexed column as well as a pointer to the full row (in InnoDB that’s the Primary Key). For example, an index on the “Product” column, assuming that “Id” is the Primary Key, may look like as follows:

Product, Id
Door, 1
Window, 2
Glass, 3

This speeds up the access to the data as there’s no need to read full row just to find a value in “Product” column. Once database finds it, it can read the rest of the row (if needed) by following the pointer.

In a column store, things are different. Data is structured not as rows but as columns. To some extend this is similar to the index. Our table in columnar datastore may look like this:

Id: 1, 2, 3
Product: Door, Window, Glass
Price: 10, 9, 12
Code: 12334, 9523, 97643
Warehouse: EU1, EU1, EU2

In MariaDB AX, columns are stored in separate files, each entry for a given “row” starts at the same offset.

The main advantage here is that if you want to run a query which will work with just a subset of data, you only need to read data from columns which are relevant to the query.

In our example earlier, instead of reading whole dataset, we can just load data for columns ‘Product” and “Price”. It reduces the data needed to be accessed on disk and speeds up the process.

What’s also important, storing data in columns make them less distinct which makes it compress better. For example, in our “Warehouse” column we have just two types of entries. Even in real world scenario it is very likely that we will end up with a small number of warehouses compared to the number of products. This makes the “Warehouse” column very good target for compression.

As a result of all of this, columnar datastores can handle large dataset better and can query it in more efficient way than “standard” OLTP-focused databases.

ClusterControl
Single Console for Your Entire Database Infrastructure
Find out what else is new in ClusterControl

Why Should I Use MariaDB AX?

Disk access is a major bottleneck in databases. A columnar datastore improves performance by reducing the amount of data that needs to be read from disk. It reads only the data necessary to answer the query.

Of course, MariaDB AX is not the only columnar datastore out there. There are many others like, for example, Clickhouse or Apache HBase.

The truth is, none of the other options support full SQL syntax that MySQL does. They require different connectors, different approach to querying the data while MariaDB AX can be queried just like you would query the ‘normal’ MariaDB.

What’s also important, given that MariaDB AX utilizes ColumnStore engine, it is perfectly fine to mix it with other engines. You can mix and join InnoDB and ColumnStore tables in the same query without any problem.

On top of that, tools that come with MariaDB TX, like MaxScale, will work just fine with MariaDB AX making it easier to build an integrated, easy to use environment. So when you are running ClusterControl with MariaDB 10.3 and MaxScale, you can easily add MariaDB AX into the mix and it will work with other parts of the setup.

MariaDB AX comes with tools which are intended to help with transferring the data from other sources. If you happen to use Kafka or Spark, there are connectors to use when importing data from those sources into MariaDB AX.

Additionally, even though regular replication between MariaDB TX (InnoDB) and MariaDB AX (ColumnStore) is not performing well due to ColumnStore limitations (it’s always better to do batch inserts in columnar datastores than single inserts, as it’s done on replication), it is possible to build a pipeline which would consist of MaxScale configured as binlog server and Avro CDC router, MaxScale CDC Data Adapter and MariaDB AX, which will receive data from the adapter almost in real time.

We hope this blog post will give you some insight into what MariaDB AX is and how it can be utilized alongside MariaDB TX environment deployed and managed by ClusterControl (download it for free!).

Monitoring & Ops Management of MongoDB 4.0 with ClusterControl

$
0
0

While MongoDB has spent nearly a decade achieving maturity (initial release Feb 2009), the technology is a bit of a mystery to those experienced in conventional relational database (RDBMS) environments. Integrating NoSQL into an existing environment without in-depth knowledge can be challenging. It is not uncommon to see MongoDB running along MySQL or another RDBMS database.

The experience of RDBMS may help to understand some of the processes, but you need to know how to translate your expertise into the NoSQL world. Managing production environments involves steps like deployment, monitoring uptime and performance, maintaining system security, managing HA, backups and so on. Both RDBMS and NoSQL are viable options, but there are specific critical differences between the two that users must keep in mind while implementing or managing MongoDB. Technology changes rapidly and we need to adapt fast.

When MongoDB is suddenly your responsibility, management tools guarantees that the MongoDB databases you manage are stable and secure. Using predefined processes and automation can not only save you time but also protect from the common mistakes. A management platform that systematically addresses all the different aspects of the database lifecycle will be more robust than patching together a number of point solutions.

At the heart of ClusterControl is its automation functionality that lets you automate the database tasks you have to perform regularly, like deploying new databases, adding and scaling new nodes, managing backups, high availability and failover, topology changes, upgrades, and more. ClusterControl provides programmed security, keeping the integrity of your database infrastructure. Moreover, with ClusterControl, MongoDB users are no longer subject to vendor lock-in; something that was questioned by many recently. You can deploy and import a variety of MongoDB versions and vendors from a single console for free. Users of MongoDB often have to use a mixture of tools and homegrown scripts to achieve their requirements, and it's good to know you can find them combined in the one product.

In this article, we will show you how to deploy and manage MongoDB 4.0 in an automated way. You will find here how to do:

  • ClusterControl installation
  • MongoDB deployment process
    • Deploy a new cluster
    • Import existing cluster
  • Scaling MongoDB
    • Read scaling (replicaSet)
    • Write scaling (sharding)
  • Securing MongoDB
  • Monitoring and Trending
  • Backup and Recovery

ClusterControl installation

To start with ClusterControl you need a dedicated virtual machine or host. The VM and supported systems requirements are described here. The base VM can start from 2 GB, 2 cores and Disk space 20 GB storage space, either on-prem or in the cloud.

The installation is well described in the documentation but basically, it comes to download of the installation script which will walk you through the wizard. The wizard script set up the internal database, installs necessary packages, repositories, and do other necessary tweaks. For the internet lock environments, you can use the offline installation process.

ClusterControl requires SSH access to the database hosts, and monitoring can be agent-based or agentless. Management is agentless.

Setup passwordless SSH to all target nodes (ClusterControl and all database hosts) involves running following commands on the ClusterControl server:

$ ssh-keygen -t rsa # press enter on all prompts
$ ssh-copy-id -i ~/.ssh/id_rsa [ClusterControl IP address]
$ ssh-copy-id -i ~/.ssh/id_rsa [Database nodes IP address] # repeat this to all target database nodes

MongoDB Deployment and Scaling

Deploy a New MongoDB 4.0 Cluster

Once we enter the ClusterControl interface, the first thing to do is deploy a new cluster or import an existing one. The new version 1.7.1 introduces support for version 4.0. You can now deploy/import and manage MongoDB v4.0 with support for SSL connections.

Select the option “Deploy Database Cluster” and follow the instructions that appear.

ClusterControl Deploy Database Cluster

When choosing MongoDB, we must specify User, Key or Password and port to connect by SSH to our servers. We also need the name for our new cluster and if we want ClusterControl to install the corresponding software and configurations for us.

After setting up the SSH access information, we must enter the data to access our database. We can also specify which repository to use. Repository configuration is an important aspect for database servers and clusters. You can have three types of the repository when deploying database server/cluster using ClusterControl:

  • Use Vendor Repository
    Provision software by setting up and using the database vendor’s preferred software repository. ClusterControl will install the latest version of what is provided by the database vendor repository.
  • Do Not Setup Vendor Repositories
    Provision software by using the pre-existing software repository already set up on the nodes. The user has to set up the software repository manually on each database node and ClusterControl will use this repository for deployment. This is good if the database nodes are running without internet connections.
  • Use Mirrored Repositories (Create new repository)
    Create and mirror the current database vendor’s repository and then deploy using the local mirrored repository. This allows you to “freeze” the current versions of the software packages.

In the next step, we need to add our servers to the cluster that we are going to create. When adding our servers, we can enter IP or hostname. For the latter, we must have a DNS server or have added our MongoDB servers to the local resolution file (/etc/hosts) of our ClusterControl, so it can resolve the corresponding name that you want to add. For our example, we will deploy a ReplicaSet with three servers, one primary and two secondaries. It is possible to deploy only 2 MongoDB nodes (without arbiter). The caveat of this approach is no automatic failover, since a 2-node setup is vulnerable to split brain. If the primary node goes down then manual failover is required to make the other server as primary. Automatic failover works fine with 3 nodes and more. It is recommended that a replica set has an odd number of voting members. Fault tolerance for a replica set is the number of members that can become unavailable and still leave enough members in the set to elect a primary. The fault tolerance for three members is one, for five it is two etc.

On the same page you can choose from different MongoDB versions:

ClusteControl Deploy MongoDB version 4.0

When all is set hit the deploy button. You can monitor the status of the creation of our new cluster from the ClusterControl activity monitor. Once the task is finished, we can see our cluster in the main ClusterControl screen and on the topology view.

ClusterControl Topology view

As we can see in the image, once we have our cluster created, we can perform several tasks on it, like converting replica set to shard or adding nodes to the cluster.

ClusterControl Scaling

Import a New Cluster

We also have the option to manage an existing cluster by importing it into ClusterControl. Such environment can be created by ClusterControl or other methods like docker installation.

ClusterControl import MongoDB

First, we must enter the SSH access credentials to our servers. Then we enter the access credentials to our database, the server data directory, and the version. We add the nodes by IP or hostname, in the same way as when we deploy, and press on Import. Once the task is finished, we are ready to manage our cluster from ClusterControl.

Scaling MongoDB

One of the cornerstones of MongoDB is that it is built with high availability and scaling in mind. Scaling can be done either vertically by adding more resources to the server or horizontally with more nodes. Horizontal scaling is what MongoDB is good at, and it is not much more than spreading the workload to multiple machines. In effect, we’re making use of multiple low-cost commodity hardware boxes, rather than upgrading to a more expensive high-performance server. MongoDB offers both read- and write scaling, and we will uncover the differences between these two strategies for you. Whether to choose read- or write scaling all depends on the workload of your application: if your application tends to read more often than it writes data you will probably want to make use of the read scaling capabilities of MongoDB.

With ClusterControl adding more servers to the cluster is an easy step. You can do that from the GUI or CLI. For more advanced users you can use ClusterControl Developer Studio and write an resource base condition to expand your cluster horizontally.

MongoDB ReplicaSet
MongoDB ReplicaSet

Sharding

The MongoDB sharding solution is similar to existing sharding frameworks for other major database solutions. It makes use of a typical lookup solution, where the sharding is defined in a shard-key and the ranges are stored inside a configuration database. MongoDB works with three components to find the correct shard for your data. A typical sharded MongoDB environment looks like this:

MongoDB Sharding
MongoDB Sharding

The first component used is the shard router called mongos. All read and write operations must be sent to the shard router, making all shards act as a single database for the client application. The shard router will route the queries to the appropriate shards by consulting the Configserver.

ClusterControl Convert to Shard

Shard management is really easy in MongoDB. You can add and remove shards online and the MongoDB shard router will automatically adjust to what you tell it to. If you wish to know more in-depth about how best to manage shards, please read our blog post about managing MongoDB shards.

Securing MongoDB

MongoDB comes with very little security out of the box: for instance, authentication is disabled by default. In other words: by default, anyone has root rights over any database. One of the changes MongoDB applied to mitigate risks was to change its default binding to 127.0.0.1. This prevents it from being bound to the external IP address, but naturally, this will be reverted by most people who install it. ClusterControl removes human error and provides access to a suite of security features, to automatically protect your databases from hacks and other threats. We previously published a short video with security tips.

The new version of ClusterControl offers SSL support for MongoDB connections. Enabling SSL adds another level of security for communication between the applications (including ClusterControl) and database. MongoDB clients open encrypted connections to the database servers and verify the identity of those servers before transferring any sensitive information.

To enable SSL connection you need to use the latest s9s client. You can install it with

wget http://repo.severalnines.com/s9s-tools/install-s9s-tools.sh
chmod 755 install-s9s-tools.sh
./install-s9s-tools.sh

Or follow other possible installation methods described here.

Once you have s9s tools installed (min version 1.7-93.1) you can use --enable-ssl flag to enable SSL connection.

Example below:

[root@cmon ~]# s9s cluster --cluster-id=3 --enable-ssl --log
This is an RPC V2 job (a job created through RPC V2).
The job owner is 'admin'.
Accessing '/.runtime/jobs/jobExecutor' to execute...
Access ok.
Stopping the cluster
node1:27017: Node is already stopped by the user.
node2:27017: Node is already stopped by the user.
node3:27017: Node is already stopped by the user.
Checking/generating (expire 1000 days) server and CA certificate.
node1:27017: setting up SSL as required way of connection.
Using certificate 'mongodb/cluster_3/server'
node1:27017: installed /etc/ssl/mongodb/cluster_3/server.crt, /etc/ssl/mongodb/cluster_3/server.key and /etc/ssl/mongodb/cluster_3/server_ca.crt
node1:27017: Deploying client certificate 'mongodb/cluster_3/client'
Writing file 'node1:/etc/mongod.conf'.
node1:27017: /etc/mongod.conf [mongod] set: ssl_cert, ssl_key and ssl_ca values.
node2:27017: setting up SSL as required way of connection.
Using certificate 'mongodb/cluster_3/server'
node2:27017: installed /etc/ssl/mongodb/cluster_3/server.crt, /etc/ssl/mongodb/cluster_3/server.key and /etc/ssl/mongodb/cluster_3/server_ca.crt
node2:27017: Deploying client certificate 'mongodb/cluster_3/client'
Writing file 'node2:/etc/mongod.conf'.
node2:27017: /etc/mongod.conf [mongod] set: ssl_cert, ssl_key and ssl_ca values.
node3:27017: setting up SSL as required way of connection.
Using certificate 'mongodb/cluster_3/server'
node3:27017: installed /etc/ssl/mongodb/cluster_3/server.crt, /etc/ssl/mongodb/cluster_3/server.key and /etc/ssl/mongodb/cluster_3/server_ca.crt
node3:27017: Deploying client certificate 'mongodb/cluster_3/client'
Writing file 'node3:/etc/mongod.conf'.
node3:27017: /etc/mongod.conf [mongod] set: ssl_cert, ssl_key and ssl_ca values.
Starting the cluster
node3:27017: Doing some preparation for starting the node.
node3:27017: Disable transparent huge page and its defrag according to mongo suggestions.
node3:27017: Checking file permissions and ownership.
node3:27017: Starting mongod MongoDb server with command:
ulimit -u 32000 -n 32000 &&  runuser -s /bin/bash mongod '-c mongod -f /etc/mongod.conf'
node3:27017: Verifing that 'mongod' process is started.
SSL setup done.

ClusterControl will execute all necessary steps including certification creation on all cluster nodes. Such certificates can be maintained later on in the Key Management tab.

ClusterControl Key Management

Monitoring

When working with database systems, you should be able to monitor them. That will enable you to identify trends, plan for upgrades or improvements or react effectively to any problems or errors that may arise.

ClusterControl MongoDB overview

The new ClusterControl 1.7.1 adds high-resolution monitoring for MongoDB based. It's using Prometheus as the data store with PromQL query language. The list of dashboards includes MongoDB Server, MongoDB ReplicaSet, System Overview, and Cluster Overview Dashboards. ClusterControl installs Prometheus agents, configures metrics and maintains access to Prometheus exporters configuration via its GUI, so you can better manage parameter configuration like collector flags for the exporters (Prometheus). We described in details what can be monitored recently in the article How to Monitor MongoDB with Prometheus & ClusterControl.

ClusterControl MongoDB SCUMM Dashboards

Alerting

As a database operator, we need to be informed whenever something critical occurs on our database. The three main methods in ClusterControl to get an alert includes:

  • email notifications
  • integrations
  • advisors

You can set the email notifications on a user level. Go to Settings > Email Notifications. Where you can choose between criticality and type of alert to be sent.

The next method is to use Integration services. This is to pass the specific category of events to the other service like ServiceNow tickets, Slack, PagerDuty etc. so you can create an advanced notification methods and integrations within your organization.

ClusterControl Integration Services

The last one is to involve sophisticated metrics analysis in Advisor section, where you can build intelligent checks and triggers. An example here could be an disk space usage prediction or cluster scaling by adding nodes when the workload reach preset level.

ClusterControl Advisors for MongoDB

Backup and Recovery

Now that you have your MongoDB replicaSet up and running, and have your monitoring in place, it is time for the next step: ensure you have a backup of your data.

ClusterControl Create Backup Policy

ClusterControl provides an interface for MongoDB backup management with support for scheduling and creative reports. It gives you two options for backup methods.

  • Mongodump
  • Mongodb consistent backup

Mongodump dumps all the data in Binary JSON (BSON) format to the specified location. Mongorestore can later on use the BSON files to restore your database. ClusterControl MongoDB consistent backup includes the transactions from the oplog that were executing while making the backup.

ClusterControl Backup Encryption

A good backup strategy is a critical part of any database management system. ClusterControl offers many options for backups and recovery/restore.

ClusterControl Backup Schedule Control

ClusterControl backup retention is configurable; you can choose to retain your backup for any time period or to never delete backups. AES256 encryption is employed to secure your backups against rogue elements. For rapid recovery, backups can be restored directly into the backup cluster - ClusterControl handles the full restore process from launch to cluster recovery, removing error-prone manual steps from the process.

How to Automate & Manage PostgreSQL with ClusterControl

$
0
0
Tuesday, January 22, 2019 - 21:00

Running PostgreSQL in production comes with the responsibility for a business critical environment; this includes high availability, disaster recovery, and performance. Ops staff worry whether databases are up and running, if backups are taken and tested for integrity, whether there are performance problems that might affect end user experience, if failover will work properly in case of server failure without breaking applications, and the list goes on.

ClusterControl can be used to operationalize your PostgreSQL footprint across your enterprise. It offers a standard way of deploying high-availability replication setups with auto-failover, integrated with load balancers offering a single endpoint to applications. It provides constant health and performance monitoring through rich dashboards, as well as backup management and point-in-time recovery

See how much time and effort can be saved, as well as risks mitigated, with the help of a unified management platform over the more traditional, manual methods.

We’ve seen a 152% increase in ClusterControl installations by PostgreSQL users last year, so make sure you don’t miss out on the trend!

Webinar Replay: How to Automate & Manage PostgreSQL with ClusterControl

$
0
0

Thanks to everyone who joined our first webinar of 2019!

Our colleague Sebastian Insausti walked us through all the ins and outs of how to automate and manage PostgreSQL with ClusterControl!

You can now watch the replay and read through the slides of this webinar to see how much time and effort can be saved, as well as risks mitigated, with the help of a unified management platform over the more traditional, manual methods

Running PostgreSQL in production comes with the responsibility for a business critical environment, which includes high availability, disaster recovery, and performance.

Ops staff worry whether …

  • Databases are up and running
  • Backups are taken and tested for integrity
  • There are performance problems that might affect end user experience
  • Failover will work properly in case of server failure without breaking applications
  • And the list goes on ...

ClusterControl can be used to operationalize your PostgreSQL footprint across your enterprise.

It offers a standard way of deploying high-availability replication setups with auto-failover, integrated with load balancers offering a single endpoint to applications. It provides constant health and performance monitoring through rich dashboards, as well as backup management and point-in-time recovery.

We’ve seen a 152% increase in ClusterControl installations by PostgreSQL users last year, so make sure you don’t miss out on the trend - and watch the replay of this webinar today.

Agenda

  • Managing PostgreSQL “the old way”:
    • Common challenges
    • Important tasks to perform
    • Tools that are available to help
  • PostgreSQL automation and management with ClusterControl:
    • Deployment
    • Backup and recovery
    • HA setups
    • Failover
    • Monitoring
    • Live Demo

Speaker

Sebastian Insausti has loved technology since his childhood, when he did his first computer course (Windows 3.11). And from that moment he was decided on what his profession would be. He has since built up experience with MySQL, PostgreSQL, HAProxy, WAF (ModSecurity), Linux (RedHat, CentOS, OL, Ubuntu server), Monitoring (Nagios), Networking and Virtualization (VMWare, Proxmox, Hyper-V, RHEV).

Prior to joining Severalnines, Sebastian worked as a consultant to state companies in security, database replication and high availability scenarios. He’s also a speaker and has given a few talks locally on InnoDB Cluster and MySQL Enterprise together with an Oracle team. Previous to that, he worked for a Mexican company as chief of sysadmin department as well as for a local ISP (Internet Service Provider), where he managed customers' servers and connectivity.

How to Manage Your PostgreSQL Databases from the ClusterControl CLI

$
0
0

Did you know that apart from the ClusterControl web UI, you can also use a command line interface to manage your PostgreSQL instances?

ClusterControl supports PostgreSQL streaming replication (both asynchronous and synchronous replication) as well as standalone PostgreSQL instance. We have put our best effort to make the command line interface to be close to the UI in terms of functionality available.

Why would you want to use the CLI?

It allows you to deploy an entire replication setup in one command, or perform a failover, or add new nodes to the setup. This integrates very well with your existing infrastructure automation code written in Ansible, Chef or Puppet.

This blog post provides a walkthrough on how to manage a PostgreSQL streaming replication cluster using ClusterControl CLI, or s9s.

Take note that most of the functionalities shown in this blog post requires you to have ClusterControl installed and running with a valid subscription, either commercial license or free trial license (valid up to 30-day after ClusterControl installation).

Cluster Deployment and Import

Deploying a new cluster

Before deploying a new cluster, or importing an existing PostgreSQL cluster into ClusterControl, ensure passwordless SSH from ClusterControl node to all database nodes is configured beforehand. Supposed we would want to deploy a new three-node PostgreSQL streaming replication, run the following commands on ClusterControl node:

$ whoami
root
$ ssh-keygen -t rsa # if you haven't generated SSH key
$ ssh-copy-id 192.168.0.91 # PostgreSQL1
$ ssh-copy-id 192.168.0.92 # PostgreSQL2
$ ssh-copy-id 192.168.0.93 # PostgreSQL3

On ClusterControl node, verify if you can the following command without password:

$ ssh 192.168.0.91 "ls /root"

If you can see the directory content, you are in a good shape. Next, use ClusterControl CLI with --create flag to deploy the cluster:

$ s9s cluster \
--create \
--cluster-type=postgresql \
--nodes="192.168.0.91?master;192.168.0.92?slave;192.168.0.93?slave" \
--provider-version='11' \
--db-admin='postgres' \
--db-admin-passwd='s3cr3tP455' \
--os-user=root \
--os-key-file=/root/.ssh/id_rsa \
--cluster-name='PostgreSQL 11 Streaming Replication' \
--wait
Creating PostgreSQL Cluster
\ Job 259 RUNNING    [█▋        ]  15% Installing helper packages

We specified the first node, 192.168.0.91 as the master and the rest are slaves. Since we already configured passwordless SSH via root user, we specified the OS user as "root" together with the corresponding SSH key file using --os-key-file flag. The --wait flag means the job will wait and report the progress until the it finishes.

You can also monitor the deployment progress from ClusterControl UI under Activity > Jobs > Creating PostgreSQL Cluster:

Once the deployment completes, we can see the summary of the running cluster by using the --stat flag:

$ s9s cluster --stat

Importing an existing cluster

If let's say you already have a PostgreSQL streaming replication cluster deployed manually, you can import it into ClusterControl using the --register flag as shown in the following command:

$ s9s cluster \
--register \
--cluster-type=postgresql \
--nodes="192.168.0.91;192.168.0.92;192.168.0.93" \
--provider-version='11' \
--db-admin='postgres' \
--db-admin-passwd='s3cr3tP455' \
--os-user=root \
--os-key-file=/root/.ssh/id_rsa \
--cluster-name="PostgreSQL 11" \
--wait
Register PostgreSQL
- Job 263 RUNNING    [        █ ] ---% Importing Cluster

ClusterControl will then connect to the specified nodes, discover the topology and register the cluster into ClusterControl. You can verify with 's9s cluster --stat' command as shown above.

Node and Cluster Management

Service Control

To perform a rolling restart of a cluster, specify the cluster ID and use --rolling-restart flag:

$ s9s cluster --rolling-restart --cluster-id=8 --wait
Rolling Restart
- Job 264 RUNNING    [██▊       ]  27% Waiting for 192.168.0.91

Use the --stop flag for component "cluster" to stop a cluster. To see the job output instead of progress bar, we can use --log flag instead:

$ s9s cluster --stop --cluster-id=8 --log
This is an RPC V2 job (a job created through RPC V2).
The job owner is 'admin'.
Accessing '/.runtime/jobs/jobExecutor' to execute...
Access ok.
Setting cluster to 'SHUTTING_DOWN' state.
192.168.0.91:5432: Stopping PostgreSQL service.
192.168.0.91:5432: Waiting PostgreSQL top stop.
192.168.0.92:5432: Stopping PostgreSQL service.
192.168.0.92:5432: Waiting PostgreSQL top stop.
192.168.0.93:5432: Stopping PostgreSQL service.
192.168.0.93:5432: Waiting PostgreSQL top stop.
Setting cluster to 'STOPPED' state.

It will report the same job messages as the web UI. Similar to the above, to start a cluster, simply use the --start flag (we use --wait flag instead to see the progress instead of the job logs):

$ s9s cluster --start --cluster-id=8 --wait
Starting Cluster
\ Job 272 RUNNING    [     █    ] ---% Start Cluster

To restart the PostgreSQL service on a database node, we use the "node" component and --restart flag:

$ s9s node \
--restart \
--cluster-id=8 \
--nodes=192.168.0.92 \
--log
Preparing to restart host.
192.168.0.92:5432: Stopping PostgreSQL service.
192.168.0.92:5432: Waiting to stop.
192.168.0.92:5432: Starting PostgreSQL.
192.168.0.92:5432: The postgresql service was started.
192.168.0.92:5432: Waiting to start.

To stop and start a PostgreSQL node, simply apply the same command with --stop or --start flag, as shown below:

$ s9s node --stop --cluster-id=8 --nodes=192.168.0.92
$ s9s node --start --cluster-id=8 --nodes=192.168.0.92

Take note that those actions will not reboot the system.

Scaling Node

To remove a node from a cluster, use the --remove-node flag:

$ s9s cluster \
--remove-node \
--nodes=192.168.0.93 \
--cluster-id=8 \
--log
Removing node 192.168.0.93: checking job parameters.
192.168.0.93:5432: Stopping PostgreSQL service.
192.168.0.93:5432: Waiting to stop.
192.168.0.93:5432: removed PostgreSQL Server
Updating load balancers.

Adding a new node works similarly, but you must ensure the node is accessible via passwordless SSH beforehand. Configure it first and then add the node using the --add-node flag:

$ s9s cluster \
--add-node \
--nodes=192.168.0.93 \
--cluster-id=8 \
--log
addNode: Verifying job parameters.
Found a master candidate: 192.168.0.91:5432, adding 192.168.0.93:5432 as a slave.
Verifying job parameters.
192.168.0.93:5432: Disabling SELinux/Apparmor.
192.168.0.93: Checking firewall.
192.168.0.93: Disabling firewalld.
192.168.0.93: Flushing iptables.
192.168.0.93:5432: Installing new node.
192.168.0.93:5432: Using the master's data directory '/var/lib/pgsql/11/data'.
192.168.0.91: Checking size of '/var/lib/pgsql/11/data'.
192.168.0.91: /var/lib/pgsql/11/data size is 103.00 MiB.
192.168.0.93: Checking free space in '/var/lib/pgsql/11/data'.
192.168.0.93: /var/lib/pgsql/11/data has 34.19 GiB free space.
192.168.0.93:5432: Setting SELinux in permissive mode.
192.168.0.93:5432: Disabling firewall.
192.168.0.93:5432: Tuning OS parameters.
192.168.0.93:5432: Setting vm.swappiness = 1.
192.168.0.93:5432: Installing helper packages.
192.168.0.93: Upgrading nss.
192.168.0.93: Upgrading ca-certificates.
192.168.0.93: Installing net-tools.
192.168.0.93: Installing netcat.
192.168.0.93: Installing nc.
192.168.0.93: Installing socat.
192.168.0.93: Installing perl-Data-Dumper.
192.168.0.93: Installing which.
192.168.0.93: Installing perl-Data-Dumper-Names.
192.168.0.93: Installing psmisc.
192.168.0.93: Installing rsync.
192.168.0.93: Installing libaio.
192.168.0.93: Installing libevent.
192.168.0.93: Installing wget.
192.168.0.93: Installing curl.
192.168.0.93: Installing gnupg2.
192.168.0.93: Installing pigz.
192.168.0.93: Installing bzip2.
192.168.0.93: Installing iproute2.
192.168.0.93: Installing tar.
192.168.0.93: Installing openssl.
192.168.0.93: Upgrading openssl openssl-libs.
192.168.0.93: Finished with helper packages.
192.168.0.93:5432: Using External repositories.
192.168.0.93:5432: Setting up PostgreSQL repositories.
192.168.0.93:5432: Uninstalling old PostgreSQL packages.
192.168.0.93:5432: Installing PostgreSQL 11 packages (centos-7).
192.168.0.93:5432: PostgreSQL installed, init-name: postgresql-11.
192.168.0.93: Updating PostgreSQL port (5432) and directory.
192.168.0.93:5432: Granting remote access to PostgreSQL server.
192.168.0.93:5432: Granting controller (10.0.2.15,192.168.0.19).
192.168.0.93:5432: Updating configuration.
192.168.0.93:5432: Enabling stat_statements plugin.
192.168.0.93:5432: Setting wal options.
192.168.0.93:5432: Performance tuning.
192.168.0.93:5432: Selected workload type: mixed
Detected system memory: 991.18 MiB
Using the following fine-tuning options:
  checkpoint_completion_target: 0.9
  effective_cache_size: 761229kB
  maintenance_work_mem: 63435kB
  max_connections: 100
  shared_buffers: 253743kB
  wal_keep_segments: 32
  work_mem: 5074kB
Writing file '192.168.0.93:/var/lib/pgsql/11/data/postgresql.conf'.
192.168.0.93:5432: Restarting PostgreSQL service
192.168.0.93:5432: Testing connection (attempt #1).
192.168.0.93:5432: Connected ok.
192.168.0.93:5432: Using the master's data directory '/var/lib/pgsql/11/data'.
192.168.0.91:5432(master): Verifying PostgreSQL version.
Setting up replication 192.168.0.91:5432->192.168.0.93:5432
Collecting server variables.
192.168.0.91:5432: Using the pg_hba.conf contents for the slave.
192.168.0.93:5432: Updating slave configuration.
Writing file '192.168.0.93:/var/lib/pgsql/11/data/postgresql.conf'.
192.168.0.93:5432: GRANT new node on members to do pg_basebackup.
192.168.0.91:5432: granting 192.168.0.93:5432.
192.168.0.93:5432: Stopping slave.
192.168.0.93:5432: Cleaning up slave data directory: /var/lib/pgsql/11/data
192.168.0.93:5432: detected version: 11.1
192.168.0.93:5432: Doing initial sync (pg_basebackup) from 192.168.0.91:5432.
192.168.0.93:5432: Synchronizing pg_hba.conf from master.
Writing file '192.168.0.93:/var/lib/pgsql/11/data/postgresql.conf'.
192.168.0.93:5432: Creating '/var/lib/pgsql/11/data/recovery.conf': Setting 192.168.0.91:5432 as master.
192.168.0.93:5432: Successfully created '/var/lib/pgsql/11/data/recovery.conf'.
192.168.0.93:5432: Restarting PostgreSQL
192.168.0.93:5432: Grant cluster members on the new node (for failover).
Grant connect access for new host in cluster.
Adding grant on 192.168.0.91:5432.
Adding grant on 192.168.0.92:5432.
192.168.0.93:5432: Waiting until service starts.
192.168.0.93:5432: Registering node.
192.168.0.93:5432: Verifying configuration.
192.168.0.93:5432: Checking 'listen_addresses'.
192.168.0.93:5432: Checking variables.
192.168.0.93:5432: Detected PostgreSQL 11.1.
192.168.0.93:5432: Registering host with host manager.
192.168.0.93:5432: Added host to cluster.
Replication slave job finished.
192.168.0.93: Installing cronie.
192.168.0.91:5432: [postgres] Pulling '/var/lib/pgsql/11/data/postgresql.conf'.
192.168.0.92:5432: [postgres] Pulling '/var/lib/pgsql/11/data/postgresql.conf'.
192.168.0.93:5432: [postgres] Pulling '/var/lib/pgsql/11/data/postgresql.conf'.

From the job logs, we can see that since the cluster already has a master running (192.168.0.91), the new node will be deployed as a slave to the master. ClusterControl will then perform all necessary actions and prepare the new node as the given role accordingly.

Switchover to a new master

To perform the switchover, pick one of the slave to become the new master with --promote-slave flag:

$ s9s cluster \
--promote-slave \
--nodes=192.168.0.92 \
--cluster-id=8 \
--log
192.168.0.92:5432: Promoting server to master.
192.168.0.92:5432: Current master is 192.168.0.91:5432.

SERVER           HOST_STATUS            STATUS            ROLE RECEIVE/REPLAY
192.168.0.91     CmonHostOnline   NODE_CONNECTED         master 0/9000EF0; 0/9000EF0
192.168.0.92     CmonHostOnline   NODE_CONNECTED         slave  0/9000EF0; 0/9000EF0
192.168.0.93     CmonHostOnline   NODE_CONNECTED         slave  0/9000EF0; 0/9000EF0

Switching over to 192.168.0.92:5432 (previous master is 192.168.0.91:5432)
192.168.0.91:5432: Stopping the current master.
192.168.0.91:5432: Stopping PostgreSQL service.
192.168.0.91:5432: Waiting to stop.
192.168.0.92:5432: Failover, using file.
192.168.0.92:5432: Waiting to become a master.
192.168.0.92:5432: Became master, ok.
Switching slaves to the new master.
192.168.0.93:5432: Stopping PostgreSQL service.
192.168.0.93:5432: Waiting to stop.
192.168.0.92:5432: Granting host (192.168.0.93:5432).
Running /usr/pgsql-11/bin/pg_rewind --target-pgdata=/var/lib/pgsql/11/data --source-server="host=192.168.0.92 port=5432 user=cmon password=***** dbname=postgres"
192.168.0.93: servers diverged at WAL location 0/9000F60 on timeline 1
no rewind required
192.168.0.93:5432: Creating '/var/lib/pgsql/11/data/recovery.conf': Setting 192.168.0.92:5432 as master.
192.168.0.93:5432: Successfully created '/var/lib/pgsql/11/data/recovery.conf'.
192.168.0.93:5432: Starting PostgreSQL.
192.168.0.93:5432: The postgresql service was started.
192.168.0.93:5432: Waiting to start.
192.168.0.93:5432: Restarted with new master.
192.168.0.91:5432: Stopping PostgreSQL service.
192.168.0.91:5432: Waiting to stop.
192.168.0.92:5432: Granting host (192.168.0.91:5432).
Running /usr/pgsql-11/bin/pg_rewind --target-pgdata=/var/lib/pgsql/11/data --source-server="host=192.168.0.92 port=5432 user=cmon password=***** dbname=postgres"
192.168.0.91: servers diverged at WAL location 0/9000F60 on timeline 1
no rewind required
192.168.0.91:5432: Creating '/var/lib/pgsql/11/data/recovery.conf': Setting 192.168.0.92:5432 as master.
192.168.0.91:5432: Successfully created '/var/lib/pgsql/11/data/recovery.conf'.
192.168.0.91:5432: Starting PostgreSQL.
192.168.0.91:5432: The postgresql service was started.
192.168.0.91:5432: Waiting to start.
192.168.0.91:5432: Restarted with new master.
Servers after promote:
SERVER           HOST_STATUS            STATUS            ROLE RECEIVE/REPLAY
192.168.0.91     CmonHostOnline   NODE_CONNECTED         slave  0/9001F90; 0/9001F90
192.168.0.92     CmonHostOnline   NODE_CONNECTED         master 0/9001F90; 0/9001F90
192.168.0.93     CmonHostOnline   NODE_CONNECTED         slave  0/9001F90; 0/9001F90

192.168.0.92:5432: promote finished (this is the new master).
Successfully promoted a new master.

The job messages show that ClusterControl will first discover the current topology and stop all nodes in the cluster. Then, it configures the new master and gets the other nodes to replicate from it. It will also attempt to run pg_rewind to re-synchronise the PGDATA of the downgraded master with a new base backup. At the end of the job, ClusterControl reports the current topology and the state of the promotion.

We can then verify by listing out all nodes for cluster ID 8:

$ s9s node --list --cluster-id=8 --long
STAT VERSION    CID CLUSTER       HOST         PORT COMMENT
coC- 1.7.1.2985   8 PostgreSQL 11 192.168.0.19 9500 Up and running.
poS- 11.1         8 PostgreSQL 11 192.168.0.91 5432 Up and running.
poM- 11.1         8 PostgreSQL 11 192.168.0.92 5432 Up and running.
poS- 11.1         8 PostgreSQL 11 192.168.0.93 5432 Up and running.

The state "poM-" on the leftmost column carries the following meaning:

  • p - PostgreSQL node
  • o - online
  • M - master

Database Management

To list out all databases found on the cluster, use the --list-database flag on component cluster:

$ s9s cluster \
--list-database \
--long \
--cluster-id=8
SIZE      #TBL #ROWS   OWNER  GROUP  CLUSTER                          DATABASE
  7340032    0       0 system admins PostgreSQL Streaming Replication postgres
  7340032    0       0 system admins PostgreSQL Streaming Replication template1
  7340032    0       0 system admins PostgreSQL Streaming Replication template0
382730240   12 1156642 system admins PostgreSQL Streaming Replication sbtest

Take note that if the cluster has a lot of databases, this option might not show some of them. Sampling a huge number of databases would generate high load and so the controller has an upper limit built into it.

If you want to create a new database for the cluster, simply do:

$ s9s cluster \
--create-database \
--cluster-id=8 \
--db-name=my_shopping_db

To create a new database user, together with a database associated with it (using the same database name), use the --create-account with --with-database flag:

$ s9s cluster \
--create-account \
--cluster-id=1 \
--account=mysystem:passwd@10.10.1.100 \
--with-database
Account 'mysystem' created.
192.168.0.91:5432: Allowing connections from 192.168.0.15.
192.168.0.92:5432: Allowing connections from 192.168.0.15.
192.168.0.93:5432: Allowing connections from 192.168.0.15.
Database 'mysystem' created.
Access for 'mysystem' to 'mysystem' granted.

ClusterControl will perform the necessary actions to create the database and user account with proper privileges and allow it on all database nodes.

ClusterControl
Single Console for Your Entire Database Infrastructure
Find out what else is new in ClusterControl

Backup Management

ClusterControl supports two backup methods for PostgreSQL:

  • pgdump - Alias to pg_dumpall, a utility for writing out all PostgreSQL databases of a cluster into one script file.
  • pg_basebackup - A utility to create a full, file system-level backup of a PostgreSQL database.

Creating a backup

To create a new backup using pg_dumpall, pick one database node and specify "pgdump" in the --backup-method flag:

$ s9s backup \
--create \
--backup-method=pgdump \
--cluster-id=8 \
--nodes=192.168.0.92 \
--backup-directory=/storage/backups \
    --on-controller

The --on-controller flag indicates that we would want the created backup to be stored under /storage/backups directory on the ClusterControl node. Omit the flag if you want to store it on the database node itself. The same command can be applied to create pg_basebackup backup. Just replace "pgdump" with "pg_basebackup" would do.

To list out the backup, simply use the --list and --cluster-id flags:

$ s9s backup --list --long --cluster-id=8
ID PI CID V I STATE     OWNER          HOSTNAME     CREATED  SIZE    TITLE
 8  -   8 - F COMPLETED admin          192.168.0.92 08:42:47    1204 Untitled Backup Record
 9  -   8 - F COMPLETED admin          192.168.0.92 08:45:52 3865462 Untitled Backup Record

Scheduling a backup

Scheduling a backup is similar to the command we used to create a backup, with additional --recurrence flag:

$ s9s backup \
--create \
--backup-method=pg_basebackup \
--cluster-id=8 \
--nodes=192.168.0.92 \
--backup-directory=/storage/backups \
--on-controller \
--recurrence='30 0 * * *'

The value of recurrence must be enclosed with quote and in crontab format.

Restoring a backup

To restore a backup to a cluster, use the --restore flag and point out the backup ID that you want to use:

$ s9s backup \
--restore \
--cluster-id=8 \
--backup-id=9 \
--log
192.168.0.19: Checking 'socat' availability.
Stop slaves as restoring offline backup to master.
192.168.0.91:5432: Stopping PostgreSQL service.
192.168.0.91:5432: Waiting to stop.
192.168.0.93:5432: Stopping PostgreSQL service.
192.168.0.93:5432: Waiting to stop.
192.168.0.92:5432: Stopping node for restoring a base-backup.
192.168.0.92:5432: Stopping PostgreSQL service.
192.168.0.92:5432: Waiting to stop.
192.168.0.92:5432: Backing up the current datadir.
192.168.0.92: Mount point of '/var/lib/pgsql/11/data': '/'
192.168.0.92: Creating copy of datadir (using 'mv'): /var/lib/pgsql/11/data_bak
192.168.0.92: Checking 'socat' availability.
192.168.0.92: Starting: su - postgres -c 'socat -u tcp-listen:9999,reuseaddr stdout | tar -C/var/lib/pgsql/11/data -xzf-' 2>&1 > /tmp/netcat.pg.log
192.168.0.92: socat/nc is started.
192.168.0.92: Restoring from '192.168.0.19':'/storage/backups/BACKUP-9/base.tar.gz'
192.168.0.92:5432: Starting node after restored a base-backup.
192.168.0.92:5432: Starting PostgreSQL.
192.168.0.92:5432: The postgresql service was started.
192.168.0.92:5432: Waiting to start.
You may now rebuild your slaves.
Finished restoring.
Checking the cluster.
Setting cluster to 'STARTING' state.
192.168.0.91:5432: Starting PostgreSQL.
192.168.0.91:5432: The postgresql service was started.
192.168.0.93:5432: Starting PostgreSQL.
192.168.0.93:5432: The postgresql service was started.
Cluster is successfully started.
Cluster status is STARTED.

Take note that for pg_basebackup's backup, the restore operation requires database downtime. All PostgreSQL nodes will be stopped prior to the restoration and the restoration takes place on the last known master. This master will be brought up first (followed by all slaves) after the restoration completes.

Verifying a backup

To restore and verify the backup, use --verify flag and specify the destination server using the --test-server flag:

$ s9s backup \
--verify \
--cluster-id=8 \
--backup-id=9 \
--test-server=192.168.0.99 \
--log

The test server must not be part of the cluster and must be accessible via passwordless SSH from ClusterControl node. ClusterControl will first install the target server with the same PostgreSQL version, stream and restore the backup on that node. The backup verification looks for the last exit code after restoration. If the backup is restorable, ClusterControl will then stop the test server and remove it from ClusterControl (but ClusterControl won't shut it down). You should see the following once the job completes:

Backup 9 was successfully verified.

Create Cluster from Backup

ClusterControl introduced a new feature in v1.7.1, where one can create a new cluster based on a backup taken by an existing cluster. This can be very useful to test out your database on a different platform or database version. In this example, we would like to deploy a two-node PostgreSQL 9.6 cluster based on backup ID 214:

$ s9s cluster \
--create \
--cluster-type=postgresql \
--nodes="192.168.0.101?master;192.168.0.102?slave" \
--provider-version=9.6 \
--db-admin=postgres \
--db-admin-passwd='s3cr3tP455' \
--os-user=root \
--os-key-file=/root/.ssh/id_rsa \
--cluster-name="PostgreSQL 9.6 - Test"
--backup-id=214 \
--wait

Take note that the the admin user password for the new cluster must be identical with the PostgreSQL admin password as included in the backup. Basically, ClusterControl performs the deployment job based on the following order:

  1. Install necessary softwares and dependencies on all PostgreSQL nodes.
  2. Start the first node.
  3. Stream and restore backup on the first node (with auto-restart flag).
  4. Configure and add the rest of the nodes.

You can then verify the cluster list by using the following command:

$ s9s cluster --stat

Configuration Management

To list out the PostgreSQL configuration of a node, use the --list-config flag:

$ s9s node --list-config --cluster-id=8 --nodes=192.168.0.92
GROUP OPTION NAME                  VALUE
-     data_directory               '/var/lib/pgsql/11/data'
-     listen_addresses             '*'
-     port                         5432
-     max_connections              100
-     shared_buffers               253743kB
-     work_mem                     5074kB
-     maintenance_work_mem         63435kB
-     dynamic_shared_memory_type   posix
-     wal_level                    hot_standby
-     full_page_writes             on
-     wal_log_hints                on
-     max_wal_size                 1GB
-     min_wal_size                 80MB
-     checkpoint_completion_target 0.9
-     max_wal_senders              16
-     wal_keep_segments            32
-     hot_standby                  on
-     effective_cache_size         761229kB
-     log_destination              'stderr'
-     logging_collector            on
-     log_directory                'log'
-     log_filename                 'postgresql-%a.log'
-     log_truncate_on_rotation     on
-     log_rotation_age             1d
-     log_rotation_size            0
-     log_line_prefix              '%m [%p] '
-     log_timezone                 'UTC'
-     track_activity_query_size    2048
-     datestyle                    'iso, mdy'
-     timezone                     'UTC'
-     lc_messages                  'en_US.UTF-8'
-     lc_monetary                  'en_US.UTF-8'
-     lc_numeric                   'en_US.UTF-8'
-     lc_time                      'en_US.UTF-8'
-     default_text_search_config   'pg_catalog.english'
-     shared_preload_libraries     'pg_stat_statements'
-     pg_stat_statements.track     all

ClusterControl returns the output of OPTION NAME and VALUE accordingly. The GROUP column is not applicable in PostgreSQL thus you should see '-' value.

To change a configuration option, use --change-config flag and specify the parameter and value using --opt-name and --opt-value respectively:

$ s9s node \
--change-config \
--nodes=192.168.0.92 \
--opt-name=min_wal_size \
--opt-value='100MB'
192.168.0.92:5432: Changed a read-only parameter. Node restart is required for change to take effect.

You should see ClusterControl return the configuration modification status and advise the follow-up procedure to make sure the configuration change takes affect. You may then use the "s9s node --restart" command to restart the particular node.

Final Thoughts

ClusterControl offers great flexibility when it comes to managing and monitoring your PostgreSQL database cluster. You have the choice of web UI, which is fairly simple and straightforward plus command line interface, which empowers you to achieve full database automation via scripting. Happy managing!

Top GUI Tools for PostgreSQL

$
0
0

Managing databases from the command line does come with a learning curve to get the most out of it.

The command line can sometimes be arduous and the display may not be optimal for what you are doing.

Browsing through databases and tables, checking indexes or user privileges, monitoring, managing, and even coding can get really messy when trying to handle it through the console.

It’s not that you don't need to manage the command line commands (it's for sure a must), but there are some tools that can help you speed up many of the daily DBA tasks.

Let's look at what these tools are about and review some of them.

What is a GUI Tool?

A GUI or Graphical User Interface is a software that simplifies the tasks of the users through graphical icons and visual indicators. The actions are performed by using graphical elements.

Why Should I Use a GUI Tool?

Using a GUI is not a must, but it can be useful. One of the main advantages of the GUIs is that they are, in general, easier to learn than a lot of commands and probably one action on the GUI could generate a few commands to perform the task.

Another advantage could be that the GUI is more friendly than the command line, and in most cases, you don't need any programming or sysadmin knowledge to use it.

But, you should be careful before performing a task from the GUI, because by using the wrong button, you could generate a big issue like deleting a table; and for this reason, do be careful when using this kind of tool.

Top GUI Tools for PostgreSQL

Now, let's see some of the most commons GUI tools for PostgreSQL.

Note that, for the installation examples, we'll test it on Ubuntu 18.04 Bionic.

pgAdmin

pgAdmin is one of the most popular Open Source administration and development platforms for PostgreSQL.

It's designed to meet the needs of both novice and experienced PostgreSQL users alike, providing a powerful graphical interface that simplifies the creation, maintenance and use of database objects.

It's supported on Linux, Mac OS X, and Windows. It supports all PostgreSQL features, from writing simple SQL queries to developing complex databases. It's designed to query an active database, allowing you to stay current with modifications and implementations. pgAdmin 4, the current version, can manage PostgreSQL 9.2 and above.

Features

  • Graphical query plan display
  • Grant wizard for rapid updates to ACLs
  • Procedural language debugger
  • Auto-vacuum management
  • Monitoring dashboard
  • Backup, restore, vacuum and analyze on demand
  • SQL/shell/batch job scheduling agent
  • Auto-detection and support for objects discovered at run-time
  • A live SQL query tool with direct data editing
  • Support for administrative queries
  • A syntax-highlighting SQL editor
  • Redesigned graphical interfaces
  • Powerful management dialogs and tools for common tasks
  • Responsive, context-sensitive behavior
  • Supportive error messages
  • Helpful hints
  • Online help and information about using pgAdmin dialogs and tools

Installation

First, we need to import the repository key.

$ sudo apt-get install curl ca-certificates
$ curl https://www.postgresql.org/media/keys/ACCC4CF8.asc | sudo apt-key add -

And create the /etc/apt/sources.list.d/pgdg.list file. The distributions are called codename-pgdg. In our example should be bionic-pgdg.

$ deb http://apt.postgresql.org/pub/repos/apt/ bionic-pgdg main

To determine the codename of your distribution you can run the lsb_release -c command.

After this, you need to update the package lists, and install the pgadmin package:

$ sudo apt-get update
$ sudo apt-get install pgadmin4

Then, you only need to run the pgadmin4 command:

$ pgadmin4

Configuration

The installation creates a pgAdmin server listening in a specific port. This port changes every time you run the pgadmin4 command. After the program is running, you can manage your database from a web interface accessing by the pgAdmin icon on the taskbar.

To connect to your database, you need to choose the Add New Server option and complete the connection information.

Then, you can manage your database using pgAdmin 4.

The design looks good and it's an intuitive interface. The charts in the main screen could help to detect some issue on your system.

The installation requires adding a repository, so it could require some additional skills.

Adminer

Adminer is a full-featured database management tool written in PHP.

It consists of a single file ready to deploy to the target server.

Adminer is available for MySQL, MariaDB, PostgreSQL, SQLite, MS SQL, Oracle, Firebird, SimpleDB, Elasticsearch, and MongoDB. The current version is 4.7 and it was released in November.

Features

  • Connect to a database server with username and password
  • Select an existing database or create a new one
  • List fields, indexes, foreign keys and triggers of a table
  • Change name, engine, collation, auto_increment, and comment of table
  • Alter name, type, collation, comment and default values of columns
  • Add and drop tables and columns
  • Create, alter, drop and search by indexes including full-text
  • Create, alter, drop and link lists by foreign keys
  • Create, alter, drop and select from views
  • Create, alter, drop and call stored procedures and functions
  • Create, alter and drop triggers
  • List data in tables with search, aggregate, sort and limit results
  • Insert new records, update and delete the existing ones
  • Supports all data types, blobs through file transfer
  • Execute any SQL command from a text field or a file
  • Export table structure, data, views, routines, databases to SQL or CSV
  • Print database schema connected by foreign keys
  • Show processes and kill them
  • Display users and rights and change them
  • Display variables with links to documentation
  • Manage events and table partitions
  • PostgreSQL
    • Schemas, sequences, user types
  • Extensive customization options

Installation

It runs in a web server, so first, you need to install Apache2, php, php-pdo and php-pgsql packages.

$ sudo apt install apache2 php php-pdo php-pgsql

We need to download the PHP file from the Adminer web page:

$ wget https://github.com/vrana/adminer/releases/download/v4.7.1/adminer-4.7.1.php

And we need to move the PHP file to our apache document root:

$ sudo mv adminer-4.7.1.php /var/www/html/adminer.php

Then, if you're installing it on your local machine, you need to open the URL http://localhost/adminer.php in your web browser.

Configuration

To start using the tool, you need to login into your database.

After login, you can see the following web page.

The installation is really easy because you only need to put the PHP file in the document root of your web server, but the interface looks a bit old-fashioned.

It's a web application, so you can access it from everywhere only by using a web browser.

SQL Workbench/J

SQL Workbench/J is a free, DBMS-independent, cross-platform SQL query tool.

It is written in Java and should run on any operating system that provides a Java Runtime Environment.

Its main focus is on running SQL scripts and export/import features. Graphical query building or more advanced DBA tasks are not the focus and are not planned.

Features

  • Edit, insert and delete data directly in the query result
  • Powerful export command to write text files, XML, HTML or SQL.
  • All user tables can be exported into a directory with a single command. Export files can be compressed "on-the-fly".
  • Powerful text, XML and spreadsheet import. A set of files can be imported from a directory with a single command. Foreign key constraints are detected to insert the data in the correct order
  • Compare two database schemas for differences. The XML output can be transformed into the appropriate SQL ALTER statements using XSLT
  • Compare the data of two databases and generate the necessary SQL statements to migrate one to the other.
  • Supports running SQL scripts in batch mode
  • Supports running in console mode
  • Search text in procedure, view and other sources using a SQL command or a GUI
  • Search for data across all columns in all tables using a SQL command or a GUI
  • Reformatting of SQL Statements
  • Select rows from related tables according to their foreign key definitions
  • Tooltips for INSERT statements to show the corresponding value or column
  • Copy data directly between to database servers using a SQL command or a GUI
  • Macros for frequently used SQL statements
  • Variable substitution in SQL statements including smart prompting for values
  • Auto completion for tables and columns in SQL statements
  • Display database objects and their definitions
  • Display table source
  • Display view, procedure, and trigger source code
  • Display foreign key constraints between tables
  • Full support for BLOB data in query results, SQL statements, export, and import.

Installation

It's written on Java, so you need this software to run it.

First, you must check if you have Java installed on your system:

$ java --version

Then, you need to download the SQL Workbench package:

$ wget https://www.sql-workbench.eu/Workbench-Build124.zip
$ unzip -d sqlworkbench Workbench-Build124.zip

To run it, you must execute the jar file named sqlworkbench.jar using the java command with the jar flag:

$ java -jar sqlworkbench/sqlworkbench.jar

Configuration

To connect to your PostgreSQL database, you need to download the JDBC Driver:

$ wget https://jdbc.postgresql.org/download/postgresql-42.2.5.jar
$ mv postgresql-42.2.5.jar sqlworkbench/

And configure the driver in your SQL Workbench. For this, go to File -> Manage drivers -> Select PostgreSQL and select the driver.

Then, go to File -> Connect window, and complete the Connection Profile information.

After the connection is finished, you can manage your database using it.

The installation is easy but you need to download the driver and configure it manually. Also, the interface is not too friendly.

DBeaver

DBeaver is free and open source universal database tool for developers and database administrators.

Supports all popular databases: MySQL, PostgreSQL, MariaDB, SQLite, Oracle, DB2, SQL Server, Sybase, MS Access, Teradata, Firebird, Derby, etc.

Usability is the main goal of this project, program UI is carefully designed and implemented. It is based on an opensource framework and allows writing of various extensions (plugins). It supports any database having a JDBC driver. There are two versions: Community Edition and Enterprise Edition.

Features

  • Connection manager
  • Metadata browser
  • SQL Editor
  • Data viewer/editor
  • Data/metadata search
  • Database structure compare
  • Data transfer (export/import)
  • ER Diagrams
  • Query Manager
  • Projects
  • Extra views
  • Driver manager
  • Supported relational databases
  • Supported NoSQL databases
  • Supported OSes
  • PostgreSQL
    • Execution plan explain
    • Stored procedures source
    • Views DDL
    • Sequences

Installation

First, you must download the package and install it:

$ wget https://dbeaver.io/files/dbeaver-ce_latest_amd64.deb
$ dpkg -i dbeaver-ce_latest_amd64.deb

And then, just run the following command to open the application:

$ dbeaver

Configuration

When you run the application for the first time, you need to configure your database connection.

So, you need to select PostgreSQL and complete the information.

Then, by selecting Test Connection, you must download the driver files. You should receive the following message after the testing.

When you finish the configuration, you can manage your database by using the DBeaver application.

The installation is, basically, a piece of cake, and the interface looks friendly and intuitive.

Navicat

Navicat for PostgreSQL is an easy-to-use graphical tool for PostgreSQL database development.

This tool will fit all, from beginners to seniors, and fit all tasks from simple queries to development. Connect to local/remote PostgreSQL servers and compatible with cloud databases like Amazon Redshift, Amazon Aurora, Amazon RDS, Google Cloud, Microsoft Azure, Alibaba Cloud, Tencent Cloud and Huawei Cloud, and all PostgreSQL database objects. It's a paid application but you can use the trial version to test it.

Features

  • Supports PostgreSQL 7.3 or later and Cloud services like AWS, Google Cloud or Microsoft Azure among others.
  • Secure connection: SSH/HTTP/SSL
  • Navicat Cloud
  • Data Viewer and Editor
  • SQL Processing
  • Data Modeling
  • Import/Export
  • Data Manipulation
  • Backup/Restore
  • Automation
  • Manage user
  • Server Monitor

Installation

First, we must download the Navicat package and uncompress it.

$ wget http://download3.navicat.com/download/navicat121_pgsql_en_x64.tar.gz
$ tar zxvf navicat121_pgsql_en_x64.tar.gz

Then, we need to run the start_navicat script to start it.

$ cd navicat121_pgsql_en_x64
$ ./start_navicat

This will use Wine to run the Navicat application and it could ask you to install some required dependency during the initialization.

Configuration

When you access the application, you need to create a new connection.

Go to Connection -> PostgreSQL and complete the information.

After this, you can start to use the application to manage your database.

The software runs over Wine on Linux and the trial is for 14 days. The interface looks pretty and friendly.

ClusterControl

ClusterControl supports deployment, management, monitoring and scaling for PostgreSQL.

Each deployed PostgreSQL instance is automatically configured using ClusterControl’s easy to use point-and-click interface.

You can manage backups, run queries, and perform advanced monitoring of all the master and slaves; all with automated failover if something goes wrong.

The automation features inside ClusterControl let you easily setup a PostgreSQL replication environment, where you can add new replication slaves from scratch or use ones that are already configured.

It also allows you to promote masters and rebuild slaves.

There are two versions: Community Edition or Enterprise Edition.

Features

  • Backup Management
  • Monitoring and Alerting
  • Deployment and Scaling
  • Upgrades and Patching
  • Security and Compliance
  • Operational Reporting
  • Configuration Management
  • Automatic Recovery and Repair
  • Performance Management
  • Automated Performance Advisors

Installation

For the installation, you can use the automatic, manual or offline installation.

In this example, we'll use the automatic installation.

You need to download the following script and run it with root privileges on the ClusterControl server:

$ wget http://www.severalnines.com/downloads/cmon/install-cc
$ chmod +x install-cc
$ sudo ./install-cc

Then, you must complete the information like passwords or configuration and it's done.

Configuration

After the installation is finished, you should be able to open the ClusterControl UI on the web browser by using the hostname or IP address of your server, for example: http://192.168.100.191/clustercontrol/

Here you can perform several tasks like deploy, import, monitoring, and even more.

After you have your PostgreSQL cluster imported or deployed by ClusterControl, you can manage it from a complete, friendly web interface.

It runs on a server, so you can use it from everywhere. All the software is installed by ClusterControl, so you don't need to do any installation manually.

Conclusion

In this blog, we reviewed some of the most commons GUI tools for PostgreSQL.

Regardless of the fact that using a GUI tool is not mandatory, it can help you ease some of the daily DBA tasks by providing you with a more friendly way of managing things.

These tools aren't a replacement for the command line (as a DBA you need to master it), but they are extremely helpful and you will really benefit from them.


PostgreSQL High Availability with Master-Slave & Master-Master Architectures

$
0
0

Below is an excerpt from our whitepaper “PostgreSQL Management and Automation with ClusterControl” which can be downloaded for free.


Database servers can work together to allow a second server to take over quickly if the primary server fails (high availability), or to allow several computers to serve the same data (load balancing).

For HA configuration we can have several architectures, but the basic ones would be master-slave and master-master architectures.

PostgreSQL Master-Slave Architectures

These architectures enable us to maintain an master database with one or more standby servers ready to take over operations if the primary server fails. These standby databases will remain synchronized (or almost synchronized) with the master.

The replication between the master and the slaves can be made via SQL statements (logical standbys) or via the internal data structure modifications (physical standbys). PostgreSQL uses a stream of write-ahead log (WAL) records to keep the standby databases synchronized. If the main server fails, the standby contains almost all of the data of the main server, and can be quickly made the new master database server. This can be synchronous or asynchronous and can only be done for the entire database Server.

Setting up streaming replication is a task that requires some steps to be followed thoroughly. For those steps and some more background on this subject, please see: Become a PostgreSQL DBA - How to Setup Streaming Replication for High Availability.

From version 10, PostgreSQL includes the option to setup logical replication.

Logical replication allows a database server to send a stream of data modifications to another server. PostgreSQL logical replication constructs a stream of logical data modifications from the WAL. Logical replication allows the data changes from individual tables to be replicated. It doesn’t require a particular server to be designated as a master or a replica but allows data to flow in multiple directions.

You can find more information regarding logical replication: Blog: An Overview of Logical Replication in PostgreSQL.

To effectively ensure high availability, it is not enough to have a master-slave architecture. We also need to enable some automatic form of failover, so if something fails we can have the smallest possible delay in resuming normal functionality. PostgreSQL does not include an automatic failover mechanism to identify failures on the master database and notify the salve to take ownership, so that will require a little bit of work on the DBA’s side. You should work on a script that includes the pg_ctl promote command, that will promote the slave as a new master. There are also some third party tools for this automation. Many such tools exist and are well integrated with the operating system facilities required for successful failover, such as IP address Migration.

After a failover happens, you need to modify your application accordingly to work with the new master. You will also have only one server working, so re-creation of the master-slave architecture needs to be done, so we get back to the same normal situation that we had before the issue.

Download the Whitepaper Today
 
PostgreSQL Management & Automation with ClusterControl
Learn about what you need to know to deploy, monitor, manage and scale PostgreSQL

PostgreSQL Master-Master Architectures

This architecture provides a way of minimizing the impact of an error in one of the nodes, as the other node can take care of all the traffic, maybe slightly affecting the performance, but never losing functionality. It is also used to accomplish (and maybe this is even a more interesting point) horizontal scalability (scale-out), opposite to the concept of vertical scalability where we add more resources to a server (scale-up).

For implementing this architecture, you will need to use external tools, as this feature is not (yet) natively supported by PostgreSQL.

You must be very careful when choosing a solution for implementing master-master, as there are many different products. A lot of them are still “green” , with few serious users or success cases. Some other projects have, on the other hand, been abandoned, as there are no active maintainers.

For more information on the available tools please refer to: Blog: Top PG Clustering HA Solutions for PostgreSQL.

Load Balancing and Connection Pooling

There are several load balancer tools that can be used to manage the traffic from your application to get the most of your database architecture. In the same way, there are some others that can help you manage the way the application connects to the database, by pooling these connections and reusing them between different requests.

There are some products that are used for both purposes, like the well known pgpool, and some others that will focus in only one of these features, like pgbouncer (connection pooling) and HAProxy (used for load balancing).

Operational Factors to Consider During MongoDB Data Modeling

$
0
0

In my previous blog, How to use MongoDB Data Modelling to Improve Throughput Operations, we discussed the 2 major data modelling relationship approaches that is, embedding and referencing. The scalability of MongoDB is quite dependent on its architecture and to be specific, data modelling. When designing a NoSQL DBM, the main point of consideration is to ensure schema-less documents besides a small number of collections for the purpose of easy maintenance. Good data integrity, adopting data validation through some defined rules before storage is encouraged. A database architecture and design should be normalized and decomposed into multiple small collections as a way of shunning data repetition, improve data integrity and make it easy with retrieval patterns. With this in place, you are able to improve data consistency, atomicity, durability and integrity of your database.

Data modelling is not an afterthought undertaking in an application development phase but an initial consideration since many application facets are actually realised during the data modelling stage. In this article we are going to discuss which factors need to be considered during data modelling and see how they affect performance of a database in general.

Many times you will need to deploy a cluster of your database as one way of increasing data availability. With a well designed data model you can distribute activities to a sharded cluster more effectively hence reduce the throughput operations aimed at a single mongod instance. The major factors to consider in data modelling include:

  1. Scalability
  2. Atomicity
  3. Performance and Data usage
  4. Sharding
  5. Indexing
  6. Storage optimization
  7. Document structure and growth
  8. Data Lifecycle

1. Scalability

This is an increase in the workload of an application driven by increased traffic. Many applications always have an expectation in the increase in number of its users. When there are so many users being served by a single database instance, the performance does not always meet the expectations. As a database manager, you thus have a mandate to design this DBM such that collections and data entities are modelled based on the present and future demands of the application. The database structure should generally be presentable to enhance easy the process of replication and sharding. When you have more shards, the write operations are distributed among this shards such that for any data update, it is done within the shard containing that data rather than looking up in a single large set of data to make an update.

2. Atomicity

This refers to the succeeding  or failure of an operation as a single unit. For example you might have a read operation that involves a sort operation after fetching the result. If the sort operation is not handled properly, the whole operation will therefore not proceed to the next stage.

Atomic transactions are series of operations that are neither divisible nor reducible hence occur as single entities or fail as a single operations. MongoDB versions before 4.0 support write operations as atomic processes on a single document level. With the version 4.0, one can now implement multi-document transactions. A data model that enhances atomic operations tends to have a great performance in terms of latency. Latency is simply the duration within which an operation request is sent and when a response is returned from the database. To be seccant, it is easy to update data which is embedded in a single document rather than one which is referenced.

Let’s for example consider the data set below

{
    childId : "535523",
    studentName : "James Karanja",
    parentPhone : 704251068,
    age : 12,
    settings : {
        location : "Embassy",
        address : "420 01",
        bus : "KAZ 450G",
        distance : "4"
      }
}

If we want to update the age by increasing it by 1 and change the location to London we could do:

db.getCollection(‘students’).update({childId: 535523},{$set:{'settings.location':'London'}, $inc:{age:1}}).

If for example the $set operation fails, then automatically the $inc operation will not be implemented and in general the whole operation fails.

On the other hand, let’s consider referenced data suche that there are 2 collections one for student and the other for settings.

Student collection

{
    childId : "535523",
    studentName : "James Karanja",
    parentPhone : 704251068,
    age : 12
}

Settings collection

{
  childId : "535523",  
  location : "Embassy",
  address : "420 01",
  bus : "KAZ 450G",
  distance : "4"
}

In this case you can update the age and location values with separate write operations .i.e

db.getCollection(‘students’).update({childId: 535523},{$inc:{age:1}})
db.getCollection('settings’).update({childId: 535523 } , {$set: { 'settings.location':'London'}})

If one of the operations fails, it does not necessarily affect the other since they are carried out as different entities.

Transactions for Multiple Documents

With MongoDB version 4.0, you can now carry out multiple document transactions for replica sets. This improves the performance since the operations are issued to a number of collections, databases and documents for fast processing. When a transaction has been committed the data is saved whereas if something goes wrong and a transaction fails, the changes that had been made are discarded and the transaction will be generally aborted. There will be no update to the replica sets during the transaction since the operation is only visible outside when the transaction is fully committed.

As much as you can update multiple documents in multiple transactions, it comes with a setback of reduced performance as compared to single document writes. Besides, this approach is only supported for the WiredTiger storage engine hence being a disadvantage for the In-Memory and MMAPv1 storage engines.

3. Performance and Data Usage

Applications are designed differently to meet different purposes. There are some which serve for the current data only like weather news applications. Depending on the structure of an application, one should be able to design a correspondent optimal database to server the required use case. For example, if one develops an application which fetches the most recent data from the database, using a capped collection will be the best option. A capped collection enhances high throughput operation just like a buffer such that when the allocated space is exploited, the oldest documents are overwritten and the documents can be fetched in the order they were inserted. Considering the inserting order retrieval, there will be no need to use indexing and absence of an index overhead will equally improve the write throughput. With a capped collection, the data associated is quite small in that it can be maintained within the RAM for some time. Temporal data in this case is stored in the cache which is quite read than being written into hence making read operation quite fast. However, the capped collection comes with some disadvantages such as, you cannot delete a document unless drop the whole collection, any change to the size of a document will fail the operation and lastly it is not possible to shard a capped collection.

Different facets are integrated in the data modelling of a database depending on the usage needs. As seen report applications will tend to be more read intensive hence the design should be in a way to improve the read throughput.

4. Sharding

Performance through horizontal scaling can be improved by sharding since the read and write workloads are distributed among the cluster members. Deploying a cluster of shards tends to partition the database into multiple small collections with distributed documents depending on some shard key. You should select an appropriate shard key which can prevent query isolation besides increasing the write capacity. A better selection generally involves a field which is present in all the documents within the targeted collection. With sharding, there is increased storage since as the data grows, more shards are established to hold a subset of this cluster.

5. Indexing

Indexing is one of the best approaches for improving the write workload especially where the fields are occuring in all the documents. When doing indexing, one should consider that each index will require 8KB of data space. Further, when the index is active it will consume some disk space and memory hence should be tracked for capacity planning.

Severalnines
 
Become a MongoDB DBA - Bringing MongoDB to Production
Learn about what you need to know to deploy, monitor, manage and scale MongoDB

6. Storage Optimization

Many small documents within a collection will tend to take more space than when you have a few documents with sub-embedded documents. When modelling , one should therefore group the related data before storage. With a few documents, a database operation can be performed with few queries hence reduced random disk access and there will be fewer associated key entries in the corresponding index. Considerations in this case therefore will be: use embedding to have fewer documents which in turn reduce the per document overhead. Use shorter field names if fewer fields are involved in a collection so as not to make document overhead significant. Shorter field names reduce expressiveness .i.e.

{ Lname : "Briston", score : 5.9 }

will save 9 bytes per document rather than using

{ last_name : "Briston", high_score: 5.9 }

Use the _id field explicitly. By default, MongoDB clients add an _id field to each document by assigning a unique 12-byte ObjectId for this field. Besides, the _id field will be indexed. If the documents are pretty small, this scenario will account for a significant amount of space in overall document number. For storage optimization, you are allowed to specify the value for the _id field explicitly when inserting documents into a collection. However, ensure the value is uniquely identified because it serves as a primary key for documents in the collection.

7. Document Structure and Growth

This happens as a result of the push operation where subdocuments are pushed into an array field or when new fields are added to an existing document. Document growth has some setbacks i.e. for a capped collection, if the size is altered then the operation will automatically fail. For a MMAPv1 storage engine, versions before 3.0 will relocate the document on disk if the document size is exceeded. However, later versions as from 3.0, there is a concept of Power of 2 Sized Allocations which reduces the chances of such re-allocations and allow the effective reuse of the freed record space. If you expect your data to be growing, you may want to refactor your data model to use references between data in distinct documents rather than using a denormalized data model.To avoid document growth, you can also consider using a pre-allocation strategy.

8. Data Lifecycle

For an application that uses the recently inserted documents only, consider using a capped collection whose features have been discussed above.

You may also set the Time to Live feature for your collection. This is quite applicable for access tokens in password reset feature for an applications.

Time To Live (TTL)

This is a collection setting that makes it possible for mongod to automatically remove data after a specified duration. By default, this concept is applied for machine generated event data, logs and session information which need to persist for a limited period of time.

Example:

db.log_events.createIndex( { "createdAt": 1 }, { expireAfterSeconds: 3600 } )

We have created an index createdAt and specified some expireAfterSeconds value of 3600 which is 1 hour after time of creation. Now if we insert a document like:

db.log_events.insert( {
   "createdAt": new Date(),
   "logEvent": 2,
   "logMessage": "This message was recorded."
} )

This document will be deleted after 1 hour from the time of insertion.

You can also set a clock specific time when you want the document to be deleted. To do so, first create an index i.e:

db.log_events.createIndex( { "expireAt": 1 }, { expireAfterSeconds: 0 } )

Now we can insert a document and specify the time when it should be deleted.

db.log_events.insert( {
   "expireAt": new Date(December 12, 2018 18:00:00'),
   "logEvent": 2,
   "logMessage": "Success!"
} )

This document will be deleted automatically when expireAt value is older than the number of seconds specified in the expireAfterSeconds, i.e 0 in this case.

Conclusion

Data modelling is a spacious undertaking for any application design in order to improve its database performance. Before inserting data to your db, consider the application needs and which are the best data model patterns you should implement. Besides, important facets of applications cannot be realised until the implementation of a proper data model.

MySQL Performance Benchmarking: MySQL 5.7 vs MySQL 8.0

$
0
0

MySQL 8.0 brought enormous changes and modifications that were pushed by the Oracle MySQL Team. Physical files have been changed. For instance, *.frm, *.TRG, *.TRN, and *.par no longer exist. Tons of new features have been added such as CTE (Common Table Expressions), Window Functions, Invisible Indexes, regexp (or Regular Expression)--the latter has been changed and now provides full Unicode support and is multibyte safe. Data dictionary has also changed. It’s now incorporated with a transactional data dictionary that stores information about database objects. Unlike previous versions, dictionary data was stored in metadata files and non-transactional tables. Security has been improved with the new addition of caching_sha2_password which is now the default authentication replacing mysql_native_password and offers more flexibility but tightened security which must use either a secure connection or an unencrypted connection that supports password exchange using an RSA key pair.

With all of these cool features, enhancements, improvements that MySQL 8.0 offers, our team was interested to determine how well the current version MySQL 8.0 performs especially given that our support for MySQL 8.0.x versions in ClusterControl is on its way (so stay tuned on this). This blog post won’t be discussing the features of MySQL 8.0, but intends to benchmark its performance against MySQL 5.7 and see how it has improved then.

Server Setup and Environment

For this benchmark, I intend to use a minimal setup for production using the following AWS EC2 environment:

Instance-type: t2.xlarge instance
Storage: gp2 (SSD storage with minimum of 100 and maximum of 16000 IOPS)
vCPUS: 4
Memory: 16GiB
MySQL 5.7 version: MySQL Community Server (GPL) 5.7.24
MySQL 8.0 version: MySQL Community Server - GPL 8.0.14

There are few notable variables that I have set for this benchmark as well, which are:

  • innodb_max_dirty_pages_pct = 90 ## This is the default value in MySQL 8.0. See here for details.
  • innodb_max_dirty_pages_pct_lwm=10 ## This is the default value in MySQL 8.0
  • innodb_flush_neighbors=0
  • innodb_buffer_pool_instances=8
  • innodb_buffer_pool_size=8GiB

The rest of the variables being set here for both versions (MySQL 5.7 and MySQL 8.0) are tuned up already by ClusterControl for its my.cnf template.

Also, the user I used here does not conform to the new authentication of MySQL 8.0 which uses caching_sha2_password. Instead, both server versions uses mysql_native_password plus innodb_dedicated_server variable is OFF (default), which is a new feature of MySQL 8.0.

To make life easier, I setup MySQL 5.7 Community version node with ClusterControl from a separate host then removed the node in a cluster and shutdown the ClusterControl host to make MySQL 5.7 node dormant (no monitoring traffic). Technically, both nodes MySQL 5.7 and MySQL 8.0 are dormant and no active connections are going through the nodes, so it’s essentially a pure benchmarking test.

Commands and Scripts Used

For this task, sysbench is used for testing and load simulation for the two environments. Here are the following commands or script being used on this test:

sb-prepare.sh

#!/bin/bash

host=$1
#host192.168.10.110
port=3306
user='sysbench'
password='MysqP@55w0rd'
table_size=500000
rate=20
ps_mode='disable'
sysbench /usr/share/sysbench/oltp_read_write.lua --db-driver=mysql --threads=1 --max-requests=0 --time=3600 --mysql-host=$host --mysql-user=$user --mysql-password=$password --mysql-port=$port --tables=10 --report-interval=1 --skip-trx=on --table-size=$table_size --rate=$rate --db-ps-mode=$ps_mode prepare

sb-run.sh

#!/usr/bin/env bash

host=$1
port=3306
user="sysbench"
password="MysqP@55w0rd"
table_size=100000
tables=10
rate=20
ps_mode='disable'
threads=1
events=0
time=5
trx=100
path=$PWD

counter=1

echo "thread,cpu"> ${host}-cpu.csv

for i in 16 32 64 128 256 512 1024 2048; 
do 

    threads=$i

    mysql -h $host -e "SHOW GLOBAL STATUS">> $host-global-status.log
    tmpfile=$path/${host}-tmp${threads}
    touch $tmpfile
    /bin/bash cpu-checker.sh $tmpfile $host $threads &

    /usr/share/sysbench/oltp_read_write.lua --db-driver=mysql --events=$events --threads=$threads --time=$time --mysql-host=$host --mysql-user=$user --mysql-password=$password --mysql-port=$port --report-interval=1 --skip-trx=on --tables=$tables --table-size=$table_size --rate=$rate --delete_inserts=$trx --order_ranges=$trx --range_selects=on --range-size=$trx --simple_ranges=$trx --db-ps-mode=$ps_mode --mysql-ignore-errors=all run | tee -a $host-sysbench.log

    echo "${i},"`cat ${tmpfile} | sort -nr | head -1` >> ${host}-cpu.csv
    unlink ${tmpfile}

    mysql -h $host -e "SHOW GLOBAL STATUS">> $host-global-status.log
done

python $path/innodb-ops-parser.py $host

mysql -h $host -e "SHOW GLOBAL VARIABLES">> $host-global-vars.log

So the script simply prepares the sbtest schema and populates tables and records. Then it performs read/write load tests using /usr/share/sysbench/oltp_read_write.lua script. The script dumps global status and MySQL variables, collects CPU utilization, and parses InnoDB row operations handled by script innodb-ops-parser.py. The scripts then generates *.csv files based on the dumped logs that were collected during the benchmark, then I used an Excel spreadsheet here to generate the graph from *.csv files. Please check the code here in this github repository.

Now, let’s proceed with the graph results!

InnoDB Row Operations

Basically here, I only extracted the InnoDB row operations which does the selects (reads), deletes, inserts, and updates. When number of threads goes up, MySQL 8.0 significantly outperforms MySQL 5.7! Both versions do not have any specific config changes, but only the notable variables I have set. So both versions are pretty much using default values.

Interestingly, with regards to the claims of the MySQL Server Team about the performance of reads and writes in the new version, the graphs point to a significant performance improvement, especially in a high-load server. Imagine the difference between MySQL 5.7 versus MySQL 8.0 for all its InnoDB row operations, there’s a high difference especially when number of threads goes up. MySQL 8.0 reveals that it can perform efficiently regardless of its workload.

Transactions Processed

As shown in the graph above, MySQL 8.0 performance shows again a huge difference in the time it takes to process transactions. The lower, the better it performs which means it’s faster to process transactions. The transactions processed (the second graph) also reveals that both numbers of transactions do not differ from each other. Meaning, both versions executes almost the same number of transactions but differ in how fast it can finish. Although I could say, MySQL 5.7 still can handle a lot at lower load, but the realistic load especially in production could be expected to be higher - especially the busiest period.

The graph above still shows the transactions it was able to process but separates the read from writes. However, there’s actually outliers in the graphs which I didn’t include as they’re tiny tidbits of the result which would skew the graph.

MySQL 8.0 reveals a great improvements especially for doing reads. It displays its efficiency in writes especially for servers with a high workload. Some great added support that impacts MySQL performance for reads in version 8.0 is the ability to create an index in descending order (or forward index scans). Previous versions had only ascending or backward index scan, and MySQL had to do filesort if it needed a descending order (if filesort is needed, you might consider checking the value of max_length_for_sort_data). Descending indexes also make it possible for the optimizer to use multiple-column indexes when the most efficient scan order mixes ascending order for some columns and descending order for others. See here for more details.

ClusterControl
Single Console for Your Entire Database Infrastructure
Find out what else is new in ClusterControl

CPU Resources

During this benchmarking, I decided to take some hardware resources, most notably, the CPU utilization.

Let me explain first how I take the CPU resource here during benchmarking. sysbench does not include collective statistics for hardware resources utilized or used during the process when you are benchmarking a database. Because of that, what I did is to create a flag by creating a file, connect to the target host through SSH, and then harvest data from Linux command “top” and parse it while sleeping for a second before collecting again. After that, take the most outstanding increase of CPU usage for the mysqld process and then remove the flag file. You can review the code there I have in github.

So let’s discuss again about the graph result, it seems to reveal that MySQL 8.0 consumes a lot of CPU. More than MySQL 5.7. However, it might have to deal with new variables added in MySQL 8.0. For example, these variables might impact your MySQL 8.0 server:

The variables with its values are left by its default values for this benchmark. The first three variables handles CPU for redo logging, which in MySQL 8.0 has been an improvement due to re-designing how InnoDB writes to the REDO log. The variable innodb_log_spin_cpu_pct_hwm has CPU affinity, which means it would ignore other CPU cores if mysqld is pinned only to 4 cores, for instance. For parallel read threads, in MySQL 8.0, it adds a new variable for which you can tune how many threads to used.

However, I did not dig further into the subject. There can be ways that performance can be improved by taking advantage of the features that MySQL 8.0 has to offer.

Conclusion

There are tons of improvements that are present in MySQL 8.0. The benchmark results reveals that there has been an impressive improvement, not only on managing read workloads, but also on a high read/write workload comparing to MySQL 5.7.

Going over to the new features that MySQL 8.0, it looks to be that it has taken advantage of the most up-to-date technologies not only on software (like great improvement for Memcached, Remote Management for better DevOps work, etc.) but also in hardware. Taken for example, the replacement of latin1 with UTF8MB4 as the default character encoding. This would mean that it would require more disk space since UTF8 needs 2-bytes on the non-US-ASCII characters. Although this benchmark did not take advantage of using the new authentication method with caching_sha2_password, it won’t affect performance whether it uses encryption. Once it’s authenticated, it is stored in cache which means authentication is only done once. So if you are using one user for your client, it won’t be a problem and is more secure than the previous versions.

Since MySQL leverages the most up-to-date hardware and software, it changes its default variables. You can read here for more details.

Overall, MySQL 8.0 has dominated MySQL 5.7 efficiently.

How Roles Have Changed in MySQL 8.0 and How to Use Them

$
0
0

Database Security is important to any MySQL setup. Users are the foundation of any system. In terms of database systems, I generally think of them in two distinct groups:

  1. Application, service, or program users - basically customers or clients using a service.
  2. Database developers, administrators, analyst, etc… - Those maintaining, working with or monitoring the database infrastructure.

While each user does need to access the database at some level, those permissions are not all created equal.

For instance, clients and customers need access to their 'related user account' data, but even that should be monitored with some level of control. However, some tables and data should be strictly off-limits (E.g., system tables).

Nevertheless:

  • Analyst need 'read access', to garner information and insight via querying tables…
  • Developers require a slew of permissions and privileges to carry out their work…
  • DBA's need 'root' or similar type privileges to run the show…
  • Buyers of a service need to see their order and payment history…

You can imagine (I know I do) just how difficult a task managing multiple users or groups of users within a database ecosystem is.

In older versions of MySQL, a multiple-user environment is established in a somewhat monotonous and repetitive manner.

Yet, version 8 implements an exceptional, and powerful, SQL standard feature - Roles - which alleviates one of the more redundant areas of the entire process: assigning privileges to a user.

So, what is a role in MySQL?

You can surely visit, MySQL in 2018: What’s in 8.0 and Other Observations, I wrote for the Severalnines blog here where I mention roles for a high-level overview. However, where I only summarized them there, this current post looks to go deeper and focus solely on roles.

Here is how the online MySQL documentation defines a role: "A MySQL role is a named collection of privileges".

Doesn't that definition alone seem helpful?

But how?

We will see in the examples that follow.

To Make Note of the Examples Provided

The examples included in this post are in a personal 'single-user' development and learning workstation/environment so be sure and implement those best practices that benefit you for your particular needs or requirements. The user names and passwords demonstrated are purely arbitrary and weak.

Users and Privileges in Previous Versions

In MySQL 5.7, roles do not exist. Assigning privileges to users is done individually. To better understand what roles do provide, let's not use them. That doesn't make any sense at all, I know. But, as we progress through the post, it will.

Below we create some users:

CREATE USER 'reader_1'@'localhost' IDENTIFIED BY 'some_password'; 
CREATE USER 'reader_writer'@'localhost' IDENTIFIED BY 'another_password'; 
CREATE USER 'changer_1'@'localhost' IDENTIFIED BY 'a_password';

Then those users are granted some privileges:

GRANT SELECT ON some_db.specific_table TO 'reader_1'@'localhost';
GRANT SELECT, INSERT ON some_db.specific_table TO 'reader_writer'@'localhost';
GRANT UPDATE, DELETE ON some_db.specific_table TO 'changer_1'@'localhost';

Whew, glad that is over. Now back to…

And just like that, you have a request to implement two more 'read-only' users…

Back to the drawing board:

CREATE USER 'reader_2'@'localhost' IDENTIFIED BY 'password_2'; 
CREATE USER 'reader_3'@'localhost' IDENTIFIED BY 'password_3';

Assigning them privileges as well:

GRANT SELECT ON some_db.specific_table TO 'reader_2'@'localhost';
GRANT ALL ON some_db.specific_table TO 'reader_3'@'localhost';

Can you see how this is less-than-productive, full of repetition, and error-prone? But, more importantly, did you catch the mistake?

Good for you!

While granting privileges for these two additional users, I accidentally granted ALL privileges to new user reader_3.

Oops.

A mistake that anyone could make.

Enter MySQL Roles

With roles, much of the above systematic privilege assignment and delegation can be somewhat streamlined.

User creation basically remains the same, but it's assigning privileges through roles that differs:

mysql> CREATE USER 'reader_1'@'localhost' IDENTIFIED BY 'some_password';
Query OK, 0 rows affected (0.19 sec)
mysql> CREATE USER 'reader_writer'@'localhost' IDENTIFIED BY 'another_password';
Query OK, 0 rows affected (0.22 sec)
mysql> CREATE USER 'changer_1'@'localhost' IDENTIFIED BY 'a_password';
Query OK, 0 rows affected (0.08 sec)
mysql> CREATE USER 'reader_2'@'localhost' IDENTIFIED BY 'password_2';
Query OK, 0 rows affected (0.28 sec)
mysql> CREATE USER 'reader_3'@'localhost' IDENTIFIED BY 'password_3';
Query OK, 0 rows affected (0.12 sec)

Querying the mysql.user system table, you can see those newly created users exist:

(Note: I have several user accounts in this learning/development environment and have suppressed much of the output for better on-screen clarity.)

mysql> SELECT User FROM mysql.user;
+------------------+
| User             |
+------------------+
| changer_1        |
| mysql.infoschema |
| mysql.session    |
| mysql.sys        |
| reader_1         |
| reader_2         |
| reader_3         |
| reader_writer    |
| root             |
|                  | --multiple rows remaining here...
+------------------+
23 rows in set (0.00 sec)

I have this arbitrary table and sample data:

mysql> SELECT * FROM name;
+--------+------------+
| f_name | l_name     |
+--------+------------+
| Jim    | Dandy      |
| Johhny | Applesauce |
| Ashley | Zerro      |
| Ashton | Zerra      |
| Ashmon | Zerro      |
+--------+------------+
5 rows in set (0.00 sec)

Let's now use roles to establish and assign, privileges for the new users to use the name table.

First, create the roles:

mysql> CREATE ROLE main_read_only;
Query OK, 0 rows affected (0.11 sec)
mysql> CREATE ROLE main_read_write;
Query OK, 0 rows affected (0.11 sec)
mysql> CREATE ROLE main_changer;
Query OK, 0 rows affected (0.14 sec)

Notice the mysql.user table again:

mysql> SELECT User FROM mysql.user;
+------------------+
| User             |
+------------------+
| main_changer     |
| main_read_only   |
| main_read_write  |
| changer_1        |
| mysql.infoschema |
| mysql.session    |
| mysql.sys        |
| reader_1         |
| reader_2         |
| reader_3         |
| reader_writer    |
| root             |
|                  |
+------------------+
26 rows in set (0.00 sec)

Based on this output, we can surmise; that in all essence, roles are in fact, users themselves.

Next, privilege assignment:

mysql> GRANT SELECT ON practice.name TO 'main_read_only';
Query OK, 0 rows affected (0.14 sec)
mysql> GRANT SELECT, INSERT ON practice.name TO 'main_read_write';
Query OK, 0 rows affected (0.07 sec)
mysql> GRANT UPDATE, DELETE ON practice.name TO 'main_changer';
Query OK, 0 rows affected (0.16 sec)

A Brief Interlude

Wait a minute. Can I just log in and carry out any tasks with the role accounts themselves? After all, they are users and they have the required privileges.

Let's attempt to log in to the practice database with role main_changer:

:~$ mysql -u main_changer -p practice
Enter password: 
ERROR 1045 (28000): Access denied for user 'main_changer'@'localhost' (using password: YES

The simple fact that we are presented with a password prompt is a good indication that we cannot (at this time at least). As you recall, I did not set a password for any of the roles during their creation.

What does the mysql.user system tables'authentication_string column have to say?

mysql> SELECT User, authentication_string, password_expired
    -> FROM mysql.user
    -> WHERE User IN ('main_read_only', 'root', 'main_read_write', 'main_changer')\G
*************************** 1. row ***************************
                 User: main_changer
authentication_string: 
     password_expired: Y
*************************** 2. row ***************************
                 User: main_read_only
authentication_string: 
     password_expired: Y
*************************** 3. row ***************************
                 User: main_read_write
authentication_string: 
     password_expired: Y
*************************** 4. row ***************************
                 User: root
authentication_string: ***various_jumbled_mess_here*&&*&*&*##
     password_expired: N
4 rows in set (0.00 sec)

I included the root user among the role names for the IN() predicate check to simply demonstrate it has an authentication_string, where the roles do not.

This passage in the CREATE ROLE documentation clarifies it nicely: "A role when created is locked, has no password, and is assigned the default authentication plugin. (These role attributes can be changed later with the ALTER USER statement, by users who have the global CREATE USER privilege.)"

Back to the task at hand, we can now assign the roles to users based on their needed level of privileges.

Notice no ON clause is present in the command:

mysql> GRANT 'main_read_only' TO 'reader_1'@'localhost', 'reader_2'@'localhost', 'reader_3'@'localhost';
Query OK, 0 rows affected (0.13 sec)
mysql> GRANT 'main_read_write' TO 'reader_writer'@'localhost';
Query OK, 0 rows affected (0.16 sec)
mysql> GRANT 'main_changer', 'main_read_only' TO 'changer_1'@'localhost';
Query OK, 0 rows affected (0.13 sec)

It may be less confusing if you use some sort of 'naming convention' when establishing role names, (I am unaware if MySQL provides one at this time… Community?) if for no other reason than to differentiate between them and regular 'non-role' users visually.

ClusterControl
Single Console for Your Entire Database Infrastructure
Find out what else is new in ClusterControl

There is Still Some Work Left To Do

That was super-easy wasn't it?

Less redundant than the old way of privilege assignment.

Let's put those users to work now.

We can see the granted privileges for a user with SHOW GRANTS syntax. Here is what is currently assigned to the reader_1 user account:

mysql> SHOW GRANTS FOR 'reader_1'@'localhost';
+------------------------------------------------------+
| Grants for reader_1@localhost                        |
+------------------------------------------------------+
| GRANT USAGE ON *.* TO `reader_1`@`localhost`         |
| GRANT `main_read_only`@`%` TO `reader_1`@`localhost` |
+------------------------------------------------------+
2 rows in set (0.02 sec)

Although that does provide an informative output, you can 'tune' the statement for even more granular information on any exact privileges an assigned role provides by including a USING clause in the SHOW GRANTS statement and naming the assigned roles name:

mysql> SHOW GRANTS FOR 'reader_1'@'localhost' USING 'main_read_only';
+-------------------------------------------------------------+
| Grants for reader_1@localhost                               |
+-------------------------------------------------------------+
| GRANT USAGE ON *.* TO `reader_1`@`localhost`                |
| GRANT SELECT ON `practice`.`name` TO `reader_1`@`localhost` |
| GRANT `main_read_only`@`%` TO `reader_1`@`localhost`        |
+-------------------------------------------------------------+
3 rows in set (0.00 sec)

After logging in with reader_1:

mysql> SELECT * FROM practice.name;
ERROR 1142 (42000): SELECT command denied to user 'reader_1'@'localhost' for table 'name'

What on earth? That user was granted SELECT privileges through role main_read_only.

To investigate, let's visit 2 new tables in version 8, specifically for roles.

The mysql.role_edges table shows what roles have been granted to any users:

mysql> SELECT * FROM mysql.role_edges;
+-----------+-----------------+-----------+---------------+-------------------+
| FROM_HOST | FROM_USER       | TO_HOST   | TO_USER       | WITH_ADMIN_OPTION |
+-----------+-----------------+-----------+---------------+-------------------+
| %         | main_changer    | localhost | changer_1     | N                 |
| %         | main_read_only  | localhost | changer_1     | N                 |
| %         | main_read_only  | localhost | reader_1      | N                 |
| %         | main_read_only  | localhost | reader_2      | N                 |
| %         | main_read_only  | localhost | reader_3      | N                 |
| %         | main_read_write | localhost | reader_writer | N                 |
+-----------+-----------------+-----------+---------------+-------------------+
6 rows in set (0.00 sec)

But, I feel the other additional table, mysql.default_roles, will better help us solve the SELECT problems for user reader_1:

mysql> DESC mysql.default_roles;
+-------------------+----------+------+-----+---------+-------+
| Field             | Type     | Null | Key | Default | Extra |
+-------------------+----------+------+-----+---------+-------+
| HOST              | char(60) | NO   | PRI |         |       |
| USER              | char(32) | NO   | PRI |         |       |
| DEFAULT_ROLE_HOST | char(60) | NO   | PRI | %       |       |
| DEFAULT_ROLE_USER | char(32) | NO   | PRI |         |       |
+-------------------+----------+------+-----+---------+-------+
4 rows in set (0.00 sec)
mysql> SELECT * FROM mysql.default_roles;
Empty set (0.00 sec)

Empty results set.

Turns out, in order for a user to be able to use a role - and ultimately the privileges - the user must be assigned a default role.

mysql> SET DEFAULT ROLE main_read_only TO 'reader_1'@'localhost', 'reader_2'@'localhost', 'reader_3'@'localhost';
Query OK, 0 rows affected (0.11 sec)

(A default role can be assigned to multiple users in one command as above…)

mysql> SET DEFAULT ROLE main_read_only, main_changer TO 'changer_1'@'localhost';
Query OK, 0 rows affected (0.10 sec)

(A user can have multiple default roles specified as in the case for user changer_1…)

User reader_1 is now logged in...

mysql> SELECT CURRENT_USER();
+--------------------+
| CURRENT_USER()     |
+--------------------+
| reader_1@localhost |
+--------------------+
1 row in set (0.00 sec)
mysql> SELECT CURRENT_ROLE();
+----------------------+
| CURRENT_ROLE()       |
+----------------------+
| `main_read_only`@`%` |
+----------------------+
1 row in set (0.03 sec)

We can see the currently active role and also, that reader_1 can issue SELECT commands now:

mysql> SELECT * FROM practice.name;
+--------+------------+
| f_name | l_name     |
+--------+------------+
| Jim    | Dandy      |
| Johhny | Applesauce |
| Ashley | Zerro      |
| Ashton | Zerra      |
| Ashmon | Zerro      |
+--------+------------+
5 rows in set (0.00 sec)

Other Hidden Nuances

There is another important part of the puzzle we need to understand.

There are potentially 3 different 'levels' or 'variants' of role assignment:

SET ROLE …;
SET DEFAULT ROLE …;
SET ROLE DEFAULT …;

I'll GRANT an additional role to user reader_1 and then login with that user (not shown):

mysql> GRANT 'main_read_write' TO 'reader_1'@'localhost';
Query OK, 0 rows affected (0.17 sec)

Since role main_read_write does have the INSERT privilege, user reader_1 can now run that command right?

mysql> INSERT INTO name(f_name, l_name)
    -> VALUES('Josh', 'Otwell');
ERROR 1142 (42000): INSERT command denied to user 'reader_1'@'localhost' for table 'name'

What is going on here?

This may help...

mysql> SELECT CURRENT_ROLE();
+----------------------+
| CURRENT_ROLE()       |
+----------------------+
| `main_read_only`@`%` |
+----------------------+
1 row in set (0.00 sec)

Recall, we initially set user reader_1 a default role of main_read_only. This is where we need to use one of those distinct 'levels' of what I loosely term'role setting':

mysql> SET ROLE main_read_write;
Query OK, 0 rows affected (0.00 sec)
mysql> SELECT CURRENT_ROLE();
+-----------------------+
| CURRENT_ROLE()        |
+-----------------------+
| `main_read_write`@`%` |
+-----------------------+
1 row in set (0.00 sec)

Now attempt that INSERT again:

mysql> INSERT INTO name(f_name, l_name)
    -> VALUES('Josh', 'Otwell');
Query OK, 1 row affected (0.12 sec)

However, once user reader_1 logs back out, role main_read_write will no longer be active when reader_1 logs back in. Although user reader_1 does have the main_read_write role granted to it, it is not the default.

Let’s now come to know the 3rd 'level' of 'role setting', SET ROLE DEFAULT.

Suppose user reader_1 has no roles assigned yet:

mysql> SHOW GRANTS FOR 'reader_1'@'localhost';
+----------------------------------------------+
| Grants for reader_1@localhost                |
+----------------------------------------------+
| GRANT USAGE ON *.* TO `reader_1`@`localhost` |
+----------------------------------------------+
1 row in set (0.00 sec)

Let’s GRANT this user 2 roles:

mysql> GRANT 'main_changer', 'main_read_write' TO 'reader_1'@'localhost';
Query OK, 0 rows affected (0.07 sec)

Assign a default role:

mysql> SET DEFAULT ROLE ‘main_changer’ TO 'reader_1'@'localhost';
Query OK, 0 rows affected (0.17 sec)

Then with user reader_1 logged in, that default role is active:

mysql> SELECT CURRENT_ROLE();
+--------------------+
| CURRENT_ROLE()     |
+--------------------+
| `main_changer`@`%` |
+--------------------+
1 row in set (0.00 sec)

Now switch to role main_read_write:

mysql> SET ROLE 'main_read_write';
Query OK, 0 rows affected (0.01 sec)
mysql> SELECT CURRENT_ROLE();
+-----------------------+
| CURRENT_ROLE()        |
+-----------------------+
| `main_read_write`@`%` |
+-----------------------+
1 row in set (0.00 sec)

But, to return back to the assigned default role, use SET ROLE DEFAULT as shown below:

mysql> SET ROLE DEFAULT;
Query OK, 0 rows affected (0.00 sec)
mysql> SELECT CURRENT_ROLE();
+--------------------+
| CURRENT_ROLE()     |
+--------------------+
| `main_changer`@`%` |
+--------------------+
1 row in set (0.00 sec)

Roles Not Granted

Even though user changer_1 has 2 roles available during a session:

mysql> SELECT CURRENT_ROLE();
+-----------------------------------------+
| CURRENT_ROLE()                          |
+-----------------------------------------+
| `main_changer`@`%`,`main_read_only`@`%` |
+-----------------------------------------+
1 row in set (0.00 sec)

What happens if you attempt and set a user to a role they have not been granted?

mysql> SET ROLE main_read_write;
ERROR 3530 (HY000): `main_read_write`@`%` is not granted to `changer_1`@`localhost`

Denied.

Taketh Away

No user management system would be complete without the ability to constrain or even remove access to certain operations should the need arise.

We have the SQL REVOKE command at our disposal to remove privileges from users and roles.

Recall that role main_changer has this set of privileges, essentially, all of those users granted this role do as well:

mysql> SHOW GRANTS FOR main_changer;
+-----------------------------------------------------------------+
| Grants for main_changer@%                                       |
+-----------------------------------------------------------------+
| GRANT USAGE ON *.* TO `main_changer`@`%`                        |
| GRANT UPDATE, DELETE ON `practice`.`name` TO `main_changer`@`%` |
+-----------------------------------------------------------------+
2 rows in set (0.00 sec)
mysql> REVOKE DELETE ON practice.name FROM 'main_changer';
Query OK, 0 rows affected (0.11 sec)
mysql> SHOW GRANTS FOR main_changer;
+---------------------------------------------------------+
| Grants for main_changer@%                               |
+---------------------------------------------------------+
| GRANT USAGE ON *.* TO `main_changer`@`%`                |
| GRANT UPDATE ON `practice`.`name` TO `main_changer`@`%` |
+---------------------------------------------------------+
2 rows in set (0.00 sec)

To know what users this change affected, we can visit the mysql.role_edges table again:

mysql> SELECT * FROM mysql.role_edges WHERE FROM_USER = 'main_changer';
+-----------+--------------+-----------+-----------+-------------------+
| FROM_HOST | FROM_USER    | TO_HOST   | TO_USER   | WITH_ADMIN_OPTION |
+-----------+--------------+-----------+-----------+-------------------+
| %         | main_changer | localhost | changer_1 | N                 |
+-----------+--------------+-----------+-----------+-------------------+
1 row in set (0.00 sec)

And we can see that user changer_1 no longer has the DELETE privilege:

mysql> SHOW GRANTS FOR 'changer_1'@'localhost' USING 'main_changer';
+--------------------------------------------------------------------------+
| Grants for changer_1@localhost                                           |
+--------------------------------------------------------------------------+
| GRANT USAGE ON *.* TO `changer_1`@`localhost`                            |
| GRANT UPDATE ON `practice`.`name` TO `changer_1`@`localhost`             |
| GRANT `main_changer`@`%`,`main_read_only`@`%` TO `changer_1`@`localhost` |
+--------------------------------------------------------------------------+
3 rows in set (0.00 sec)

Finally, if we need to get rid of a role completely, we have the DROP ROLE command for that:

mysql> DROP ROLE main_read_only;
Query OK, 0 rows affected (0.17 sec)

And querying the mysql.role_edges table, role main_read_only has been removed:

mysql> SELECT * FROM mysql.role_edges;
+-----------+-----------------+-----------+---------------+-------------------+
| FROM_HOST | FROM_USER       | TO_HOST   | TO_USER       | WITH_ADMIN_OPTION |
+-----------+-----------------+-----------+---------------+-------------------+
| %         | main_changer    | localhost | changer_1     | N                 |
| %         | main_read_write | localhost | reader_1      | N                 |
| %         | main_read_write | localhost | reader_writer | N                 |
+-----------+-----------------+-----------+---------------+-------------------+
3 rows in set (0.00 sec)

(Bonus: This fantastic YouTube video was a great learning resource for me on Roles.)

This example of user creation, role assignment, and setup is rudimentary at best. Yet, roles have their own set of rules that make them far from trivial. My hope is that through this blog post, I have shed light on those areas that are less intuitive than others, enabling readers to better understand potential role uses within their systems.

Thank you for reading.
Automate Deployment of your MySQL or Postgres Cluster from Backup

$
0
0

ClusterControl 1.7.1 introduces a new feature called Create Cluster from Backup, which allows you to deploy a new MySQL or Postgres-based cluster and restore data on it from a backup. This blog post shows how this new feature works, and how this type of automation can deliver improvements to your infrastructure operations.

Introducing: Create Cluster from Backup

Backup management is the most loved feature by our users, and we just lifted it to the next level. This new functionality sounds simple - ClusterControl 1.7.1 is able to deploy a new cluster from an existing backup. However, there are multiple procedures and checks involved in order to deploy a production-grade cluster directly from a backup. Restoration itself comes with its own challenges, such as:

  • Full or partial restore consequences
  • Base backup and its incremental backups ordering (for incremental backup)
  • Backup decryption (if encrypted)
  • Restoration tool options
  • Decompression (if compressed)
  • Backup streaming from the source to the destination server
  • Disk space utilization during and after the restoration
  • Restoration progress reporting

Combine the above with the complexity and repetitiveness of database cluster deployment tasks, you can save time and reduce risk in running error-prone procedures. The hardest part from the user's perspective is to pick which backup to restore from. ClusterControl will handle all the heavy lifting behind the scene, and report the end result once finishes.

The steps are basically simple:

  1. Setup passwordless SSH from the ClusterControl node to the new servers.
  2. Pick one logical backup from the backup list, or create one under Backups -> Create Backup.
  3. Click Restore -> Create Cluster from Backup and follow the deployment wizard.

This feature is specifically built for MySQL Galera Cluster and PostgreSQL at the time being. Here is what you would see in the UI after clicking "Restore" on an existing backup:
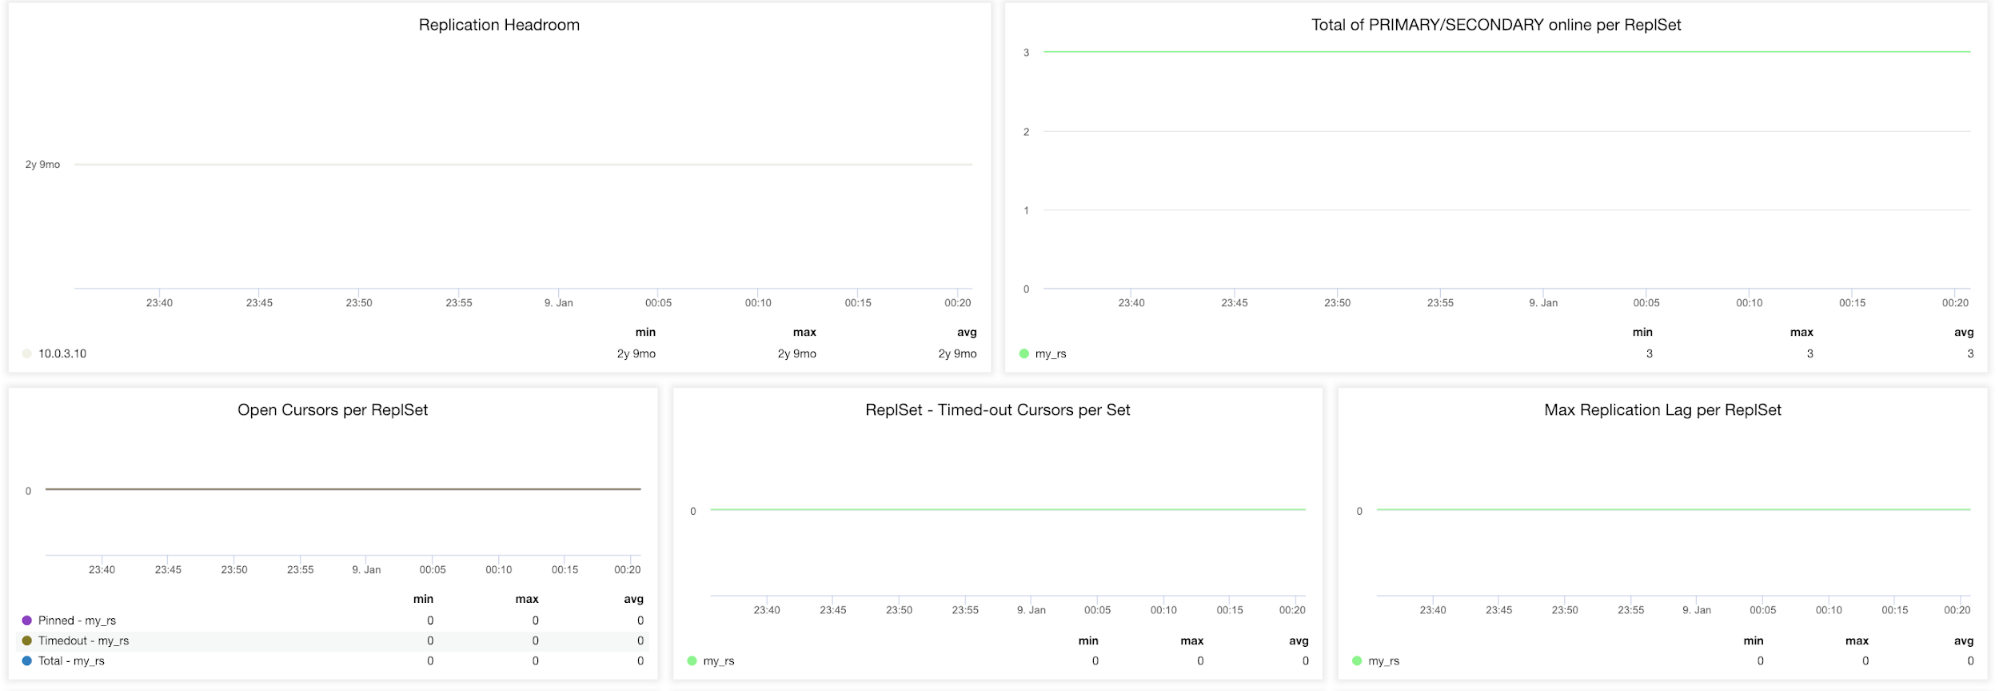
The bottom option is what we are looking for. Next, is the summary dialog on the chosen backup before the deployment configuration:

Next, the same database cluster deployment wizard for the respective cluster (MySQL Galera Cluster or PostgreSQL) will be shown to configure a new cluster:

Note that you must specify the same database root/admin username and password as the one that you have in the backup. Otherwise, the deployment would fail half-way when starting up the first node. In general, restoration and deployment procedures will happen in the following order:

  1. Install necessary softwares and dependencies on all database nodes.
  2. Start the first node.
  3. Stream and restore backup on the first node (with auto-restart flag).
  4. Configure and add the rest of the nodes.

A new database cluster will be listed under ClusterControl cluster dashboard once the job completes.

What can you gain from it?

There are a number of things you could benefit from this feature, as explained in the following sections.

Test your dataset in various conditions

Sometimes, you might be wondering a the new database version would work or perform for your database workload and testing it out is the only way to know. This is where this feature comes in handy. It allows you to perform tests and benchmark on many variables involved that would affect the database stability or performance, for instance, the underlying hardware, software version, vendor and database or application workloads.

For a simple example, there is a big improvement on the DDL execution between MySQL 5.6 and MySQL 5.7. The following DROP operation on a 10 million rows table proves it all:

mysql-5.7> ALTER TABLE sbtest1 DROP COLUMN xx;
Query OK, 0 rows affected (1 min 58.12 sec)
mysql-5.6> ALTER TABLE sbtest1 DROP COLUMN xx;
Query OK, 0 rows affected (2 min 23.74 sec)

Having another cluster to compare with actually allows us to measure the improvement and justify a migration.

Database migration with logical backup

Logical backup like mysqldump and pg_dumpall is the safest way to upgrade, downgrade or migrate your data from one version or vendor to another. All logical backups can be used to perform database migration. The database upgrade steps are basically simple:

  1. Create (or schedule) a logical backup - mysqldump for MySQL or pg_dumpall for PostgreSQL
  2. Setup passwordless SSH from ClusterControl node to the new servers.
  3. Pick one created logical backup from the backup list.
  4. Click Restore -> Create Cluster from Backup and follow the deployment wizard.
  5. Verify the data restoration on the new cluster.
  6. Point your application to the new cluster.

Faster total cluster recovery time

Imagine a catastrophic failure which prevents your cluster to run, like for example a centralized storage failure which affected all the virtual machines that connected to it, you could get a replacement cluster almost immediately (provided the backup files are stored outside of the failed database nodes, stating the obvious). This feature can be automated via s9s client, where you can trigger a job via the command line interface, for example:

$ s9s cluster \
--create \
--cluster-type=postgresql \
--nodes="192.168.0.101?master;192.168.0.102?slave;192.168.0.103?slave" \
--provider-version=11 \
--db-admin=postgres \
--db-admin-passwd='s3cr3tP455' \
--os-user=root \
--os-key-file=/root/.ssh/id_rsa \
--cluster-name="PostgreSQL 9.6 - Test"
--backup-id=214 \
--log

One thing to note when using this feature is to use the same admin username and password as what's stored in the backup. Also, the passwordless SSH to all database nodes must be configured beforehand. Otherwise, if you prefer to configure it interactively, just use the web UI interface.

Scale Out via Asynchronous Replication

For MySQL Galera Cluster, the newly created cluster has the possibility to be scaled out via MySQL asynchronous replication. Let's say we already restored a new cluster in the office based on the latest backup from the production cluster in the data center, and we would like the office cluster to continue replicating from the production cluster, as illustrated in the following diagram:

You may then set up the asynchronous replication link by using the following way:

  1. Pick one node in the production and enable binary logging (if disabled). Go to Nodes -> pick a node -> Node Actions -> Enable Binary Logging.

  2. Enable binary logging on all nodes for office cluster. This action requires a rolling restart which will be performed automatically if you choose "Yes" under "Auto-restart node" dropdown:

    Otherwise, you can perform this operation without downtime by using Manage -> Upgrade -> Rolling Restart (or manually restart one node at a time).

  3. Create a replication user on the production cluster by using Manage -> Schemas and Users -> Users -> Create New User:

  4. Then, pick one node to replicate to the master node in production cluster and setup the replication link:

    mysql> CHANGE MASTER master_host = 'prod-mysql1', master_user = 'slave', master_password = 'slavepassw0rd', master_auto_position = 1;
    mysql> START SLAVE;
  5. Verify if the replication is running:

    mysql> SHOW SLAVE STATUS\G
    Make sure Slave_IO_Thread and Slave_SQL_thread are reporting 'Yes'. The office's cluster should start to catch up with the master node if it's lagging behind.

That’s it for now folks!

Viewing all 1476 articles
Browse latest View live