Quantcast
Channel: Severalnines
Viewing all 1475 articles
Browse latest View live

Running a Data Warehouse on PostgreSQL

$
0
0

When you need to implement an analytics system for a company there is often the question of where the data should be stored. There is not always a perfect option for all the requirements and it depends on the budget, the amount of data, and the needs of the company.

PostgreSQL, as the most advanced open source database, is so flexible that can serve as a simple relational database, a time-series data database, and even as an efficient, low-cost, data warehousing solution. You can also integrate it with several analytics tools.

If you’re looking for a widely compatible, low cost, and performant data warehouse, the best database option could be PostgreSQL, but why? In this blog, we’ll see what a data warehouse is, why is it needed, and why PostgreSQL could be the best option here.

What is a Data Warehouse

A Data Warehouse is a system of standardized, consistent, and integrated which contains current or historical data from one or more sources that is used for reporting and data analysis. It’s considered a core component of business intelligence, which is the strategy and technology used by a company for a better understanding of its commercial context.

The first question you may ask is why do I need a data warehouse?

  • Integration: Integrate/centralize data from multiple systems/databases
  • Standardize: Standardize all the data in the same format
  • Analytics: Analyze data in a historical context

Some of the benefits of a data warehouse can be...

  • Integrate data from multiple sources into a single database
  • Avoid production locking or load due to long-running queries
  • Store Historical Information
  • Restructure the data to fit the analytics requirements

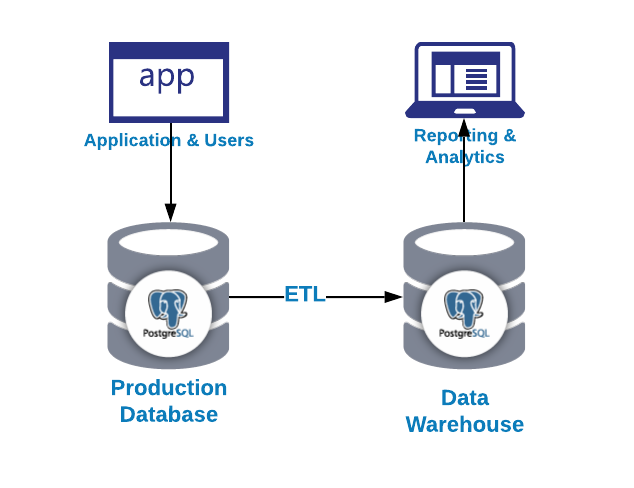
As we could see in the previous image, we can use PostgreSQL for both OLAP and OLTP proposes. Let’s see the difference.

  • OLTP: Online transaction processing. In general, it has a large number of short on-line transactions (INSERT, UPDATE, DELETE) generated by user activity. These systems emphasize very fast query processing and maintaining data integrity in multi-access environments. Here, effectiveness is measured by the number of transactions per second. OLTP databases contain detailed and current data. 
  • OLAP: Online analytical processing. In general, it has a low volume of complex transactions generated by large reports. The response time is an effectiveness measure. These databases store aggregated, historical data in multi-dimensional schemas. OLAP databases are used to analyze multidimensional data from multiple sources and perspectives.

We have two ways to load data into our analytics database:

  • ETL: Extract, transform and load. This is the way to generate our data warehouse. First, extract the data from the production database, transform the data according to our requirement, and then, load the data into our data warehouse.
  • ELT: Extract, load and transform. First, extract the data from the production database, load it into the database and then transform the data. This way is called Data Lake and it’s a new concept to manage our big data.

And now, the second question i, why should I use PostgreSQL for my data warehouse?

Benefits of PostgreSQL as a Data Warehouse

Let’s look at some of the benefits of using PostgreSQL as a data warehouse...

  • Cost: If you’re using an on-prem environment, the cost for the product itself will be $0, even if you’re using some product in the cloud, probably the cost of a PostgreSQL based product will be less than the rest of the products.
  • Scale: You can scale reads it in a simple way by adding as many replica nodes as you want.
  • Performance: With a correct configuration, PostgreSQL has a really good performance on different escenarios.
  • Compatibility: You can integrate PostgreSQL with external tools or applications for data mining, OLAP and reporting.
  • Extensibility: PostgreSQL has user-defined data types and functions.

There are also some PostgreSQL features that can help us to manage our data warehouse information...

  • Temporary tables: It’s a short-lived table that exists for the duration of a database session. PostgreSQL automatically drops the temporary tables at the end of a session or a transaction.
  • Stored procedures: You can use it to create procedures or function on multiple languages (PL/pgSQL, PL/Perl, PL/Python, etc).
  • Partitioning: This is really useful for database maintenance, queries using partition key and INSERT performance.
  • Materialized view: The query results are shown as a table.
  • Tablespaces: You can change the data location to a different disk. In this way, you’ll have parallelized disk access.
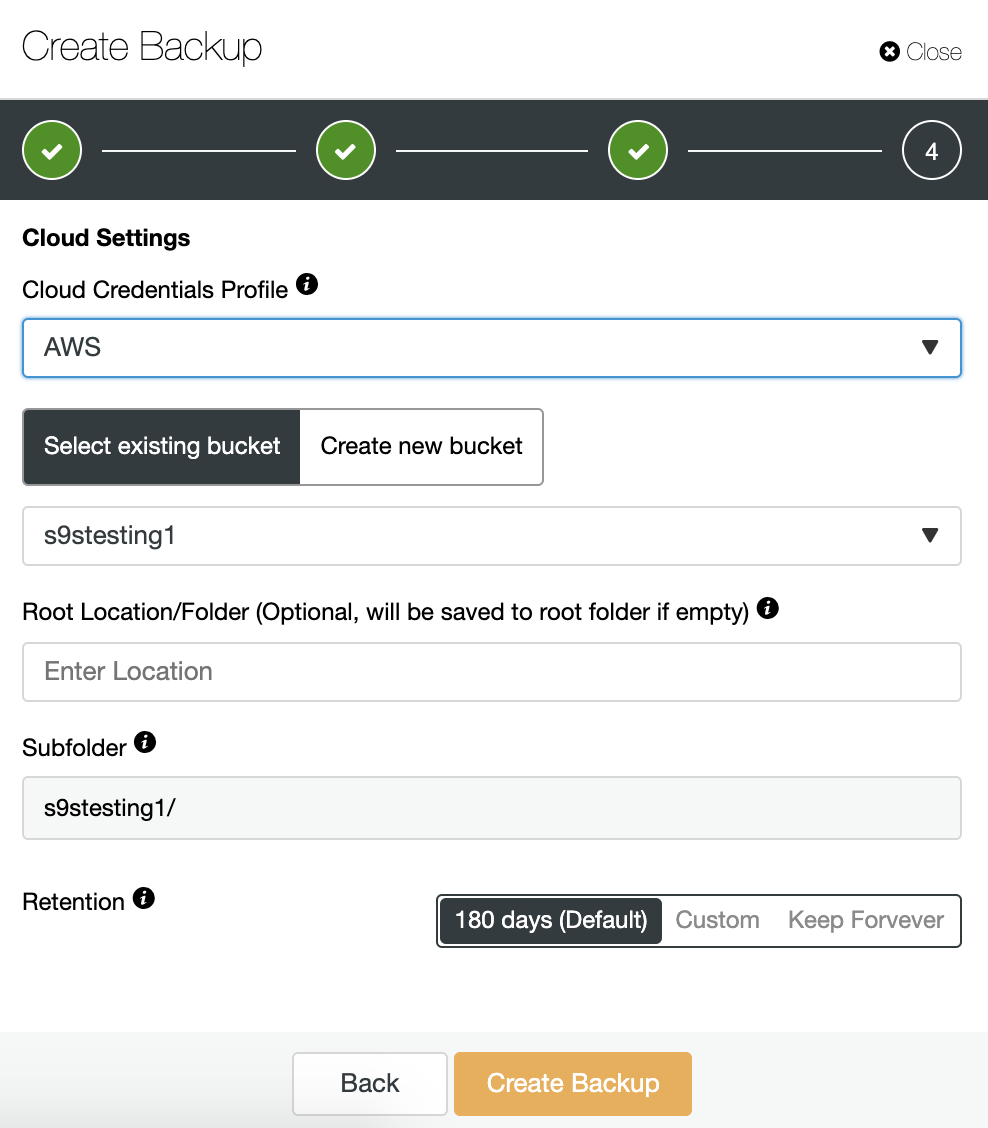
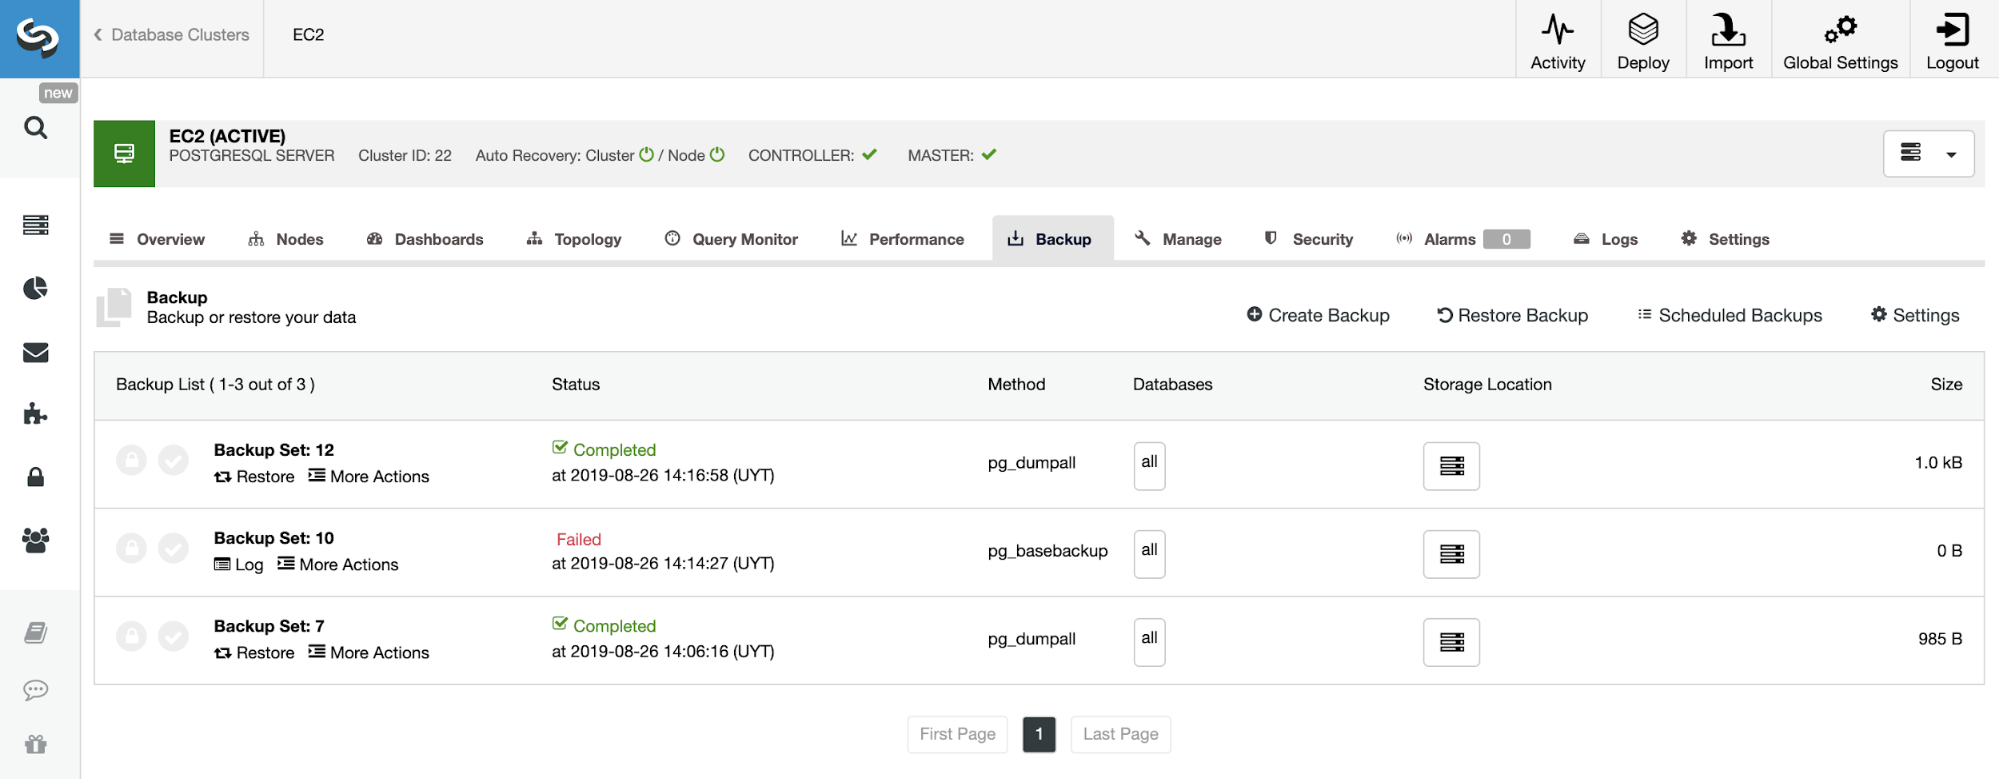
  • PITR compatible: You can create backups Point-in-time-recovery compatible, so in case of failure, you can restore the database state on a specific period of time.
  • Huge community: And last but not least, PostgreSQL has a huge community where you can find support on many different issues.

Configuring PostgreSQL for Data Warehouse Usage

There is no best configuration to use in all cases and in all database technologies. It depends on many factors such as hardware, usage, and system requirements. Below are some tips to configure your PostgreSQL database to work as a data warehouse in the correct way.

Memory Based

  • max_connections: As a data warehouse database, you don’t need a high amount of connections because this will be used for reporting and analytics work, so you can limit the max connections numbers using this parameter.
  • shared_buffers: Sets the amount of memory that the database server uses for shared memory buffers. A reasonable value can be from 15% to 25% of the RAM memory.
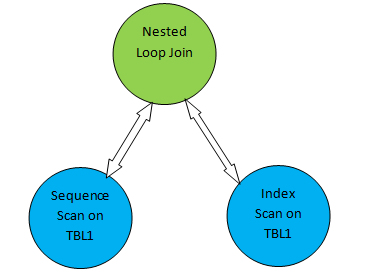
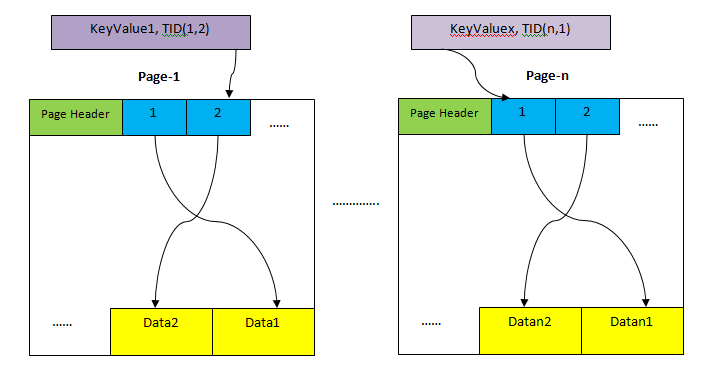
  • effective_cache_size: This value is used by the query planner to take into account plans that may or may not fit in memory. This is taken into account in the cost estimates of using an index; a high value makes it more likely that index scans are used and a low value makes it more likely that sequential scans will be used. A reasonable value would be around 75% of the RAM memory.
  • work mem: Specifies the amount of memory that will be used by the internal operations of ORDER BY, DISTINCT, JOIN, and hash tables before writing to the temporary files on disk. When configuring this value we must take into account that several sessions are executing these operations at the same time and each operation will be allowed to use as much memory as specified by this value before it starts to write data in temporary files. A reasonable value can be around 2% of the RAM Memory.
  • maintenance_work_mem: Specifies the maximum amount of memory that maintenance operations will use, such as VACUUM, CREATE INDEX, and ALTER TABLE ADD FOREIGN KEY. A reasonable value can be around 15% of the RAM Memory.

CPU Based

  • Max_worker_processes: Sets the maximum number of background processes that the system can support. A reasonable value can be the number of CPUs.
  • Max_parallel_workers_per_gather: Sets the maximum number of workers that can be started by a single Gather or Gather Merge node. A reasonable value can be 50% of the number of CPU.
  • Max_parallel_workers: Sets the maximum number of workers that the system can support for parallel queries. A reasonable value can be the number of CPUs.

As the data loaded into our data warehouse shouldn’t change, we can also set the Autovacuum in off to avoid an extra load on your PostgreSQL database. The Vacuum and Analyze processes can be part of the batch load process.

Conclusion

If you’re looking for widely compatible, low cost, and high-performance data warehouse you should definitely consider PostgreSQL as an option for your data warehouse database. PostgreSQL has many benefits and features useful to manage our data warehouse like partitioning, or stored procedures, and even more.


MySQL on Docker: ProxySQL Native Clustering with Kubernetes

$
0
0

ProxySQL has supported native clustering since v1.4.2. This means multiple ProxySQL instances are cluster-aware; they are aware of each others' state and able to handle the configuration changes automatically by syncing up to the most up-to-date configuration based on configuration version, timestamp and checksum value. Check out this blog post which demonstrates how to configure clustering support for ProxySQL and how you could expect it to behave.

ProxySQL is a decentralized proxy, recommended to be deployed closer to the application. This approach scales pretty well even up to hundreds of nodes, as it was designed to be easily reconfigurable at runtime. To efficiently manage multiple ProxySQL nodes, one has to make sure whatever changes performed on one of the nodes should be applied across all nodes in the farm. Without native clustering, one has to manually export the configurations and import them to the other nodes (albeit, you could automate this by yourself).

In the previous blog post, we have covered ProxySQL clustering via Kubernetes ConfigMap. This approach is more or less pretty efficient with the centralized configuration approach in ConfigMap. Whatever loaded into ConfigMap will be mounted into pods. Updating the configuration can be done via versioning (modify the proxysql.cnf content and load it into ConfigMap with another name) and then push to the pods depending on the Deployment method scheduling and update strategy.

However, in a rapidly changing environment, this ConfigMap approach is probably not the best method because in order to load the new configuration, pod rescheduling is required to remount the ConfigMap volume and this might jeopardize the ProxySQL service as a whole. For example, let's say in our environment, our strict password policy requires to force MySQL user password expiration for every 7 days, which we would have to keep updating the ProxySQL ConfigMap for the new password on a weekly basis. As a side note, MySQL user inside ProxySQL requires user and password to match the one on the backend MySQL servers. That's where we should start making use of ProxySQL native clustering support in Kubernetes, to automatically apply the configuration changes without the hassle of ConfigMap versioning and pod rescheduling.

In this blog post, we’ll show you how to run ProxySQL native clustering with headless service on Kubernetes. Our high-level architecture can be illustrated as below:

We have 3 Galera nodes running on bare-metal infrastructure deployed and managed by ClusterControl:

  • 192.168.0.21
  • 192.168.0.22
  • 192.168.0.23

Our applications are all running as pods within Kubernetes. The idea is to introduce two ProxySQL instances in between the application and our database cluster to serve as a reverse proxy. Applications will then connect to ProxySQL pods via Kubernetes service which will be load balanced and failover across a number of ProxySQL replicas.

The following is a summary of our Kubernetes setup:

root@kube1:~# kubectl get nodes -o wide
NAME    STATUS   ROLES    AGE     VERSION   INTERNAL-IP       EXTERNAL-IP   OS-IMAGE             KERNEL-VERSION      CONTAINER-RUNTIME
kube1   Ready    master   5m      v1.15.1   192.168.100.201   <none>        Ubuntu 18.04.1 LTS   4.15.0-39-generic   docker://18.9.7
kube2   Ready    <none>   4m1s    v1.15.1   192.168.100.202   <none>        Ubuntu 18.04.1 LTS   4.15.0-39-generic   docker://18.9.7
kube3   Ready    <none>   3m42s   v1.15.1   192.168.100.203   <none>        Ubuntu 18.04.1 LTS   4.15.0-39-generic   docker://18.9.7

ProxySQL Configuration via ConfigMap

Let's first prepare our base configuration which will be loaded into ConfigMap. Create a file called proxysql.cnf and add the following lines:

datadir="/var/lib/proxysql"

admin_variables=
{
    admin_credentials="proxysql-admin:adminpassw0rd;cluster1:secret1pass"
    mysql_ifaces="0.0.0.0:6032"
    refresh_interval=2000
    cluster_username="cluster1"
    cluster_password="secret1pass"
    cluster_check_interval_ms=200
    cluster_check_status_frequency=100
    cluster_mysql_query_rules_save_to_disk=true
    cluster_mysql_servers_save_to_disk=true
    cluster_mysql_users_save_to_disk=true
    cluster_proxysql_servers_save_to_disk=true
    cluster_mysql_query_rules_diffs_before_sync=3
    cluster_mysql_servers_diffs_before_sync=3
    cluster_mysql_users_diffs_before_sync=3
    cluster_proxysql_servers_diffs_before_sync=3
}

mysql_variables=
{
    threads=4
    max_connections=2048
    default_query_delay=0
    default_query_timeout=36000000
    have_compress=true
    poll_timeout=2000
    interfaces="0.0.0.0:6033;/tmp/proxysql.sock"
    default_schema="information_schema"
    stacksize=1048576
    server_version="5.1.30"
    connect_timeout_server=10000
    monitor_history=60000
    monitor_connect_interval=200000
    monitor_ping_interval=200000
    ping_interval_server_msec=10000
    ping_timeout_server=200
    commands_stats=true
    sessions_sort=true
    monitor_username="proxysql"
    monitor_password="proxysqlpassw0rd"
    monitor_galera_healthcheck_interval=2000
    monitor_galera_healthcheck_timeout=800
}

mysql_galera_hostgroups =
(
    {
        writer_hostgroup=10
        backup_writer_hostgroup=20
        reader_hostgroup=30
        offline_hostgroup=9999
        max_writers=1
        writer_is_also_reader=1
        max_transactions_behind=30
        active=1
    }
)

mysql_servers =
(
    { address="192.168.0.21" , port=3306 , hostgroup=10, max_connections=100 },
    { address="192.168.0.22" , port=3306 , hostgroup=10, max_connections=100 },
    { address="192.168.0.23" , port=3306 , hostgroup=10, max_connections=100 }
)

mysql_query_rules =
(
    {
        rule_id=100
        active=1
        match_pattern="^SELECT .* FOR UPDATE"
        destination_hostgroup=10
        apply=1
    },
    {
        rule_id=200
        active=1
        match_pattern="^SELECT .*"
        destination_hostgroup=20
        apply=1
    },
    {
        rule_id=300
        active=1
        match_pattern=".*"
        destination_hostgroup=10
        apply=1
    }
)

mysql_users =
(
    { username = "wordpress", password = "passw0rd", default_hostgroup = 10, transaction_persistent = 0, active = 1 },
    { username = "sbtest", password = "passw0rd", default_hostgroup = 10, transaction_persistent = 0, active = 1 }
)

proxysql_servers =
(
    { hostname = "proxysql-0.proxysqlcluster", port = 6032, weight = 1 },
    { hostname = "proxysql-1.proxysqlcluster", port = 6032, weight = 1 }
)

Some of the above configuration lines are explained per section below:

admin_variables

Pay attention on the admin_credentials variable where we used non-default user which is "proxysql-admin". ProxySQL reserves the default "admin" user for local connection via localhost only. Therefore, we have to use other users to access the ProxySQL instance remotely. Otherwise, you would get the following error:

ERROR 1040 (42000): User 'admin' can only connect locally

We also appended the cluster_username and cluster_password value in the admin_credentials line, separated by semicolon to allow automatic syncing to happen. All variables prefixed with cluster_* are related to ProxySQL native clustering and are self-explanatory.

mysql_galera_hostgroups

This is a new directive introduced for ProxySQL 2.x (our ProxySQL image is running on 2.0.5). If you would like to run on ProxySQL 1.x, do remove this part and use scheduler table instead. We already explained the configuration details in this blog post, How to Run and Configure ProxySQL 2.0 for MySQL Galera Cluster on Docker under "ProxySQL 2.x Support for Galera Cluster".

mysql_servers

All lines are self-explanatory, which is based on three database servers running in MySQL Galera Cluster as summarized in the following Topology screenshot taken from ClusterControl:

proxysql_servers

Here we define a list of ProxySQL peers:

  • hostname - Peer's hostname/IP address
  • port - Peer's admin port
  • weight - Currently unused, but in the roadmap for future enhancements
  • comment - Free form comment field

In Docker/Kubernetes environment, there are multiple ways to discover and link up container hostnames or IP addresses and insert them into this table, either by using ConfigMap, manual insert, via entrypoint.sh scripting, environment variables or some other means. In Kubernetes, depending on the ReplicationController or Deployment method used, guessing the pod's resolvable hostname in advanced is somewhat tricky unless if you are running on StatefulSet.

Check out this tutorial on StatefulState pod ordinal index which provides a stable resolvable hostname for the created pods. Combine this with headless service (explained further down), the resolvable hostname format would be:

{app_name}-{index_number}.{service}

Where {service} is a headless service, which explains where "proxysql-0.proxysqlcluster" and "proxysql-1.proxysqlcluster" come from. If you want to have more than 2 replicas, add more entries accordingly by appending an ascending index number relative to the StatefulSet application name.

Now we are ready to push the configuration file into ConfigMap, which will be mounted into every ProxySQL pod during deployment:

$ kubectl create configmap proxysql-configmap --from-file=proxysql.cnf

Verify if our ConfigMap is loaded correctly:

$ kubectl get configmap
NAME                 DATA   AGE
proxysql-configmap   1      7h57m

Creating ProxySQL Monitoring User

The next step before we start the deployment is to create ProxySQL monitoring user in our database cluster. Since we are running on Galera cluster, run the following statements on one of the Galera nodes:

mysql> CREATE USER 'proxysql'@'%' IDENTIFIED BY 'proxysqlpassw0rd';
mysql> GRANT USAGE ON *.* TO 'proxysql'@'%';

If you haven't created the MySQL users (as specified under mysql_users section above), we have to create them as well:

mysql> CREATE USER 'wordpress'@'%' IDENTIFIED BY 'passw0rd';
mysql> GRANT ALL PRIVILEGES ON wordpress.* TO 'wordpress'@'%';
mysql> CREATE USER 'sbtest'@'%' IDENTIFIED BY 'passw0rd';
mysql> GRANT ALL PRIVILEGES ON sbtest.* TO 'proxysql'@'%';

That's it. We are now ready to start the deployment.

Deploying a StatefulSet

We will start by creating two ProxySQL instances, or replicas for redundancy purposes using StatefulSet.

Let's start by creating a text file called proxysql-ss-svc.yml and add the following lines:

apiVersion: apps/v1
kind: StatefulSet
metadata:
  name: proxysql
  labels:
    app: proxysql
spec:
  replicas: 2
  serviceName: proxysqlcluster
  selector:
    matchLabels:
      app: proxysql
      tier: frontend
  updateStrategy:
    type: RollingUpdate
  template:
    metadata:
      labels:
        app: proxysql
        tier: frontend
    spec:
      restartPolicy: Always
      containers:
      - image: severalnines/proxysql:2.0.4
        name: proxysql
        volumeMounts:
        - name: proxysql-config
          mountPath: /etc/proxysql.cnf
          subPath: proxysql.cnf
        ports:
        - containerPort: 6033
          name: proxysql-mysql
        - containerPort: 6032
          name: proxysql-admin
      volumes:
      - name: proxysql-config
        configMap:
          name: proxysql-configmap
---
apiVersion: v1
kind: Service
metadata:
  annotations:
  labels:
    app: proxysql
    tier: frontend
  name: proxysql
spec:
  ports:
  - name: proxysql-mysql
    port: 6033
    protocol: TCP
    targetPort: 6033
  - name: proxysql-admin
    nodePort: 30032
    port: 6032
    protocol: TCP
    targetPort: 6032
  selector:
    app: proxysql
    tier: frontend
  type: NodePort

There are two sections of the above definition - StatefulSet and Service. The StatefulSet is the definition of our pods, or replicas and the mount point for our ConfigMap volume, loaded from proxysql-configmap. The next section is the service definition, where we define how the pods should be exposed and routed for internal or external network.

Verify the pod and service states:

$ kubectl get pods,svc
NAME             READY   STATUS    RESTARTS   AGE
pod/proxysql-0   1/1     Running   0          4m46s
pod/proxysql-1   1/1     Running   0          2m59s

NAME                      TYPE        CLUSTER-IP       EXTERNAL-IP   PORT(S)                         AGE
service/kubernetes        ClusterIP   10.96.0.1        <none>        443/TCP                         10h
service/proxysql          NodePort    10.111.240.193   <none>        6033:30314/TCP,6032:30032/TCP   5m28s

If you look at the pod's log, you would notice we got flooded with this warning:

$ kubectl logs -f proxysql-0
...
2019-08-01 19:06:18 ProxySQL_Cluster.cpp:215:ProxySQL_Cluster_Monitor_thread(): [WARNING] Cluster: unable to connect to peer proxysql-1.proxysqlcluster:6032 . Error: Unknown MySQL server host 'proxysql-1.proxysqlcluster' (0)

The above simply means proxysql-0 was unable to resolve "proxysql-1.proxysqlcluster" and connect to it, which is expected since we haven't created our headless service for DNS records that is going to be needed for inter-ProxySQL communication.

Kubernetes Headless Service

In order for ProxySQL pods to be able to resolve the anticipated FQDN and connect to it directly, the resolving process must be able to lookup the assigned target pod IP address and not the virtual IP address. This is where headless service comes into the picture. When creating a headless service by setting "clusterIP=None", no load-balancing is configured and no cluster IP (virtual IP) is allocated for this service. Only DNS is automatically configured. When you run a DNS query for headless service, you will get the list of the pods IP addresses.

Here is what it looks like if we look up the headless service DNS records for "proxysqlcluster" (in this example we had 3 ProxySQL instances):

$ host proxysqlcluster
proxysqlcluster.default.svc.cluster.local has address 10.40.0.2
proxysqlcluster.default.svc.cluster.local has address 10.40.0.3
proxysqlcluster.default.svc.cluster.local has address 10.32.0.2

While, the following output shows the DNS record for the standard service called "proxysql" which resolves to the clusterIP:

$ host proxysql
proxysql.default.svc.cluster.local has address 10.110.38.154

To create a headless service and attach it to the pods, one has to define the ServiceName inside the StatefulSet declaration, and the Service definition must have "clusterIP=None" as shown below. Create a text file called proxysql-headless-svc.yml and add the following lines:

apiVersion: v1
kind: Service
metadata:
  name: proxysqlcluster
  labels:
    app: proxysql
spec:
  clusterIP: None
  ports:
  - port: 6032
    name: proxysql-admin
  selector:
    app: proxysql

Create the headless service:

$ kubectl create -f proxysql-headless-svc.yml

Just for verification, at this point, we have the following services running:

$ kubectl get svc
NAME              TYPE        CLUSTER-IP      EXTERNAL-IP   PORT(S)                         AGE
kubernetes        ClusterIP   10.96.0.1       <none>        443/TCP                         8h
proxysql          NodePort    10.110.38.154   <none>        6033:30200/TCP,6032:30032/TCP   23m
proxysqlcluster   ClusterIP   None            <none>        6032/TCP                        4s

Now, check out one of our pod's log:

$ kubectl logs -f proxysql-0
...
2019-08-01 19:06:19 ProxySQL_Cluster.cpp:215:ProxySQL_Cluster_Monitor_thread(): [WARNING] Cluster: unable to connect to peer proxysql-1.proxysqlcluster:6032 . Error: Unknown MySQL server host 'proxysql-1.proxysqlcluster' (0)
2019-08-01 19:06:19 [INFO] Cluster: detected a new checksum for mysql_query_rules from peer proxysql-1.proxysqlcluster:6032, version 1, epoch 1564686376, checksum 0x3FEC69A5C9D96848 . Not syncing yet ...
2019-08-01 19:06:19 [INFO] Cluster: checksum for mysql_query_rules from peer proxysql-1.proxysqlcluster:6032 matches with local checksum 0x3FEC69A5C9D96848 , we won't sync.

You would notice the Cluster component is able to resolve, connect and detect a new checksum from the other peer, proxysql-1.proxysqlcluster on port 6032 via the headless service called "proxysqlcluster". Note that this service exposes port 6032 within Kubernetes network only, hence it is unreachable externally.

At this point, our deployment is now complete.

Connecting to ProxySQL

There are several ways to connect to ProxySQL services. The load-balanced MySQL connections should be sent to port 6033 from within Kubernetes network and use port 30033 if the client is connecting from an external network.

To connect to the ProxySQL admin interface from external network, we can connect to the port defined under NodePort section, 30032 (192.168.100.203 is the primary IP address of host kube3.local):

$ mysql -uproxysql-admin -padminpassw0rd -h192.168.100.203 -P30032

Use the clusterIP 10.110.38.154 (defined under "proxysql" service) on port 6032 if you want to access it from other pods in Kubernetes network.

Then perform the ProxySQL configuration changes as you wish and load them to runtime:

mysql> INSERT INTO mysql_users (username,password,default_hostgroup) VALUES ('newuser','passw0rd',10);
mysql> LOAD MYSQL USERS TO RUNTIME;

You will notice the following lines in one of the pods indicating the configuration syncing completes:

$ kubectl logs -f proxysql-0
...
2019-08-02 03:53:48 [INFO] Cluster: detected a peer proxysql-1.proxysqlcluster:6032 with mysql_users version 2, epoch 1564718027, diff_check 4. Own version: 1, epoch: 1564714803. Proceeding with remote sync
2019-08-02 03:53:48 [INFO] Cluster: detected peer proxysql-1.proxysqlcluster:6032 with mysql_users version 2, epoch 1564718027
2019-08-02 03:53:48 [INFO] Cluster: Fetching MySQL Users from peer proxysql-1.proxysqlcluster:6032 started
2019-08-02 03:53:48 [INFO] Cluster: Fetching MySQL Users from peer proxysql-1.proxysqlcluster:6032 completed

Keep in mind that the automatic syncing only happens if there is a configuration change in ProxySQL runtime. Therefore, it's vital to run "LOAD ... TO RUNTIME" statement before you can see the action. Don't forget to save the ProxySQL changes into the disk for persistency:

mysql> SAVE MYSQL USERS TO DISK;

Limitation

Note that there is a limitation to this setup due to ProxySQL does not support saving/exporting the active configuration into a text configuration file that we could use later on to load into ConfigMap for persistency. There is a feature request for this. Meanwhile, you could push the modifications to ConfigMap manually. Otherwise, if the pods were accidentally deleted, you would lose your current configuration because the new pods would be bootstrapped by whatever defined in the ConfigMap.

Special thanks to Sampath Kamineni, who sparked the idea of this blog post and provide insights about the use cases and implementation.

Comparing Temporary Tables for PostgreSQL & Oracle GTT

$
0
0

The temporary tables are a useful concept present in most SGBDs, even though they often work differently.

This blog describes the technical features for this kind of tables either in PostgreSQL (version 11) or Oracle (version 12c) databases with some specific examples. Although the purpose of these tables could be the same for all SGBD’s, their specifics, or the way of implementation and manipulation, are completely different.

This feature could be used both by developers or database administrators to store intermediate results that will be needed for further processing in order to provide good performance metrics.

Temporary Tables in PostgreSQL

In PostgreSQL these objects are valid only for the current session: they are created, used and dropped along the same session: the structure of the table and managed data only are visible for the current session, thus the other sessions don’t have access to the temporary tables created on the other sessions.

Below it’s showed a simple example to create a temporary table:

CREATE TEMPORARY TABLE tt_customer
(
     customer_id INTEGER
)
ON COMMIT DELETE ROWS;

The temporary tables are created in a temporary schema: pg_temp_nn and it’s possible to create indexes on these tables:

creation index  tt_cusomer_idx_1 on tt_customer(customer_id)

As the data rows on these tables could be also deleted, it’s possible to release the occupied storage through the execution of vaccum command:

VACUUM VERBOSE tt_customer

The analyze command can be executed as well on the temporary tables in order to collect the statistics:

ANALYZE VERBOSE tt_customer;

Both commands can be executed for this kind of table as SQL command, however, the autovaccum daemon that execute them does not act on the temporary tables.

Another important point to consider it’s related to the permanent and temporary tables with the same name: once it happens the permanent table only is taken into account when called with its schema as a prefix.

web_db=# BEGIN TRANSACTION;
BEGIN
web_db=# SELECT COUNT(*) FROM customers;
  count  
---------
 1030056
(1 row)

web_db=# CREATE TEMPORARY TABLE customers(
web_db(#   id INTEGER
web_db(# )
web_db-# ON COMMIT PRESERVE ROWS;
CREATE TABLE
web_db=# INSERT INTO customers(id) VALUES(1023);
INSERT 0 1
web_db=# SELECT COUNT(*) FROM customers;
 count 
-------
     1
(1 row)
web_db=# \dt *customers*
                  List of relations
  Schema   |         Name         | Type  |  Owner   
-----------+----------------------+-------+----------
 pg_temp_5 | customers            | table | postgres
 web_app   | customers            | table | postgres
 web_app   | customers_historical | table | postgres
(3 rows)
web_db=# DROP TABLE customers;
DROP TABLE
web_db=# \dt *customers*
                 List of relations
 Schema  |         Name         | Type  |  Owner   
---------+----------------------+-------+----------
 web_app | customers            | table | postgres
 web_app | customers_historical | table | postgres
(2 rows)
web_db=# SELECT COUNT(*) FROM web_app.customers; 
  count  
---------
 1030056
(1 row)
web_db=# SELECT COUNT(*) FROM customers; 
  count  
---------
 1030056
(1 row)

From the previous example while the temporary table exists all reference to the customers refers to this table instead to the permanent one.

Developer Tips for Temporary Tables

The purpose of this example is to assign a bonus for the customers who have not made purchases or login for more than a year, so the script of the developer instead to use sub-queries in queries as a possible solution (or the using of CTEs statement) can use temporary tables (that usually it’s faster than using sub-queries):

web_db=# BEGIN TRANSACTION;
BEGIN
web_db=# CREATE TEMPORARY TABLE tt_customers(
web_db(#   id INTEGER
web_db(# )
web_db-# ON COMMIT DELETE ROWS;
CREATE TABLE
web_db=# SELECT COUNT(*) FROM tt_customers;
 count 
-------
     0
(1 row)
web_db=# INSERT INTO tt_customers(id)
web_db-# SELECT customer_id
web_db-#   FROM web_app.orders
web_db-# WHERE order_dt <= NOW()-INTERVAL '6 MONTH';
INSERT 0 1030056
web_db=# SELECT COUNT(*) FROM tt_customers;
  count  
---------
 1030056
(1 row)
web_db=# DELETE FROM tt_customers c
web_db-# WHERE EXISTS(SELECT 1 
web_db(#                FROM web_app.users u JOIN web_app.login l 
web_db(#                       ON (l.user_id=u.user_id) 
web_db(#               WHERE u.customer_id=c.id 
web_db(#                 AND l.login_dt > NOW()-INTERVAL '6 MONTH'
web_db(#                 );
DELETE 194637
web_db=# SELECT COUNT(*) FROM tt_customers;
 count  
--------
 835419
(1 row)
web_db=# UPDATE web_app.customers as c SET BONUS=5
web_db-# FROM tt_customers t
web_db-# WHERE t.id = c.id;
UPDATE 835419
web_db=# SELECT COUNT(*) FROM tt_customers;
 count  
--------
 835419
(1 row)
web_db=# COMMIT TRANSACTION;
COMMIT
web_db=# SELECT COUNT(*) FROM tt_customers;
 count 
-------
     0
(1 row)

DBA Tips for Temporary Tables

A typical task for database administrators is to purge any huge tables that contain data that is no longer needed. This needs to be completed very quickly and it happens often. The standard approach is to move this data to a historical table in another schema or to a database that is accessed less often.

So, in order to perform this moving, due to performance issues the best solution could be using temporary tables:

CREATE TEMPORARY TABLE tt_customer
(
     customer_id INTEGER
)
ON COMMIT DROP;

In this example, the temporary table was created with the DROP option, so it means that will be dropped at the end of the current transaction block.

Here is some other important info on PostgreSQL temporary tables:

  • Temporary tables are automatically dropped at the end of a session or, as presented in the previous example, at the end of the current transaction
  • Permanent tables with the same name are not visible to the current session while the temporary table exists, unless they are referenced with schema-qualified names
  • Any indexes created on a temporary table are automatically temporary as well
  • ON COMMIT preserve rows it's the default behavior
  • Optionally, GLOBAL or LOCAL can be written before TEMPORARY or TEMP. This presently makes no difference in PostgreSQL and it’s deprecated
  • The autovacuum daemon cannot access to these tables and therefore cannot vacuum or analyze temporary tables, however, as shown previously the autovacuum and analyze commands can be used as SQL commands.

Global Temporary Tables (GTT) in Oracle

This kind of tables is known in the Oracle world as a Global Temporary Table (or GTT). These objects are persistent in the database and can be summarized by the following characteristics:

  • The structure is static and visible for all users, however, its content is only visible for the current session
  • It can be created in a specific schema (by default will be owned by the user that issuing the command) and they are built in the TEMP tablespace
  • Once created in the database it cannot be created again in each session, however, the data managed by a session are not visible for the others sessions
  • It’s possible the creation of indexes and generation of statistics
  • As the structure of these tables is also defined in the database isn’t possible to assign its name to a permanent table (in Oracle two objects cannot have the same name even from different types)
  • Do not generate too many redo logs and the undo overhead it's also less comparing with a permanent table (only for these reasons the using of GTT it’s faster) for any versions prior to 12c. From 12c version there is a concept of temporary undo, allowing the undo for a GTT to be written to the temporary tablespace, thus it’s reducing undo and redo.

Following the same example presented in PostgreSQL, the creation of a GTT is quite similar:

CREATE GLOBAL TEMPORARY TABLE tt_customer
(
     customer_id NUMBER
)
ON COMMIT DELETE ROWS;

It’s possible also the creation of indexes.

creation index  tt_cusomer_idx_1 on tt_customer(customer_id)

Prior Oracle 12c the generation of statistics for a global temporary tables had a behavior in a global way: the statistics generated in a specific session for a specific GTT were visible and used for the others sessions (only statistics not the data!), however, from version 12c it’s possible for each session to generate its own statistics.

First of all it’s necessary to set the preference global_temp_table_stats to session:

exec dbms_stats.set_table_prefs(USER,’TT_CUSTOMER’,’GLOBAL_TEMP_TABLE_STATS’,’SESSION’);

and then the generation of statistics:

exec dbms_stats.gather_table_stats(USER,’TT_CUSTOMER’);

The existing global temporary table could be checked by the execution of the following query:

select table_name from all_tables where temporary = 'Y';

Developer Tips for Global Temporary Tables (GTT)

Following the example on PostgreSQL section: to assign a bonus for the customers who have not made purchases or login for more than a year, the use of global temporary tables in Oracle has the same goal that in PostgreSQL: to achieve better performance either in the usage of resource or in execution speed.

SQL> SELECT COUNT(*) FROM tt_customers;
  COUNT(*)
----------
         0
SQL>
SQL> INSERT INTO tt_customers(id)
  2  SELECT customer_id
  3    FROM orders
  4  WHERE order_dt <= ADD_MONTHS(SYSDATE,-6);
1030056 rows created.
SQL>
SQL> SELECT COUNT(*) FROM tt_customers;
  COUNT(*)
----------
   1030056
SQL>
SQL> DELETE FROM tt_customers c
  2  WHERE EXISTS(SELECT 1
  3                 FROM users u JOIN login l
  4                        ON (l.user_id=u.user_id)
  5                WHERE u.customer_id=c.id
  6                  AND l.login_dt > ADD_MONTHS(SYSDATE,-6)
  7                  );
194637 rows deleted.
SQL>
SQL> SELECT COUNT(*) FROM tt_customers;
  COUNT(*)
----------
    835419
SQL>
SQL> UPDATE CUSTOMERS c SET BONUS=5
  2  WHERE EXISTS(SELECT 1 FROM tt_customers tc WHERE tc.id=c.id);
835419 rows updated.
SQL>
SQL> SELECT COUNT(*) FROM tt_customers;
  COUNT(*)
----------
    835419
SQL>
SQL> COMMIT;
Commit complete.
SQL>
SQL> SELECT COUNT(*) FROM tt_customers;
  COUNT(*)
----------
         0

SQL>

By default in Oracle a SQL/PLSQL block/statement starts implicitly a transaction.

DBA Tips for Global Temporary Tables (GTT)

As the statement drop doesn’t exist for global temporary tables the command to create the table it’s the same as the previous one:

CREATE GLOBAL TEMPORARY TABLE tt_customer
(
     customer_id NUMBER
)
ON COMMIT DELETE ROWS;

The equivalent snippet of code in Oracle to purge the customer table it’s the following:

SQL> INSERT INTO tt_customers(id)
  2  SELECT l.user_id
  3    FROM users u JOIN login l
  4           ON (l.user_id=u.user_id)
  5   WHERE l.login_dt < ADD_MONTHS(SYSDATE,-12);
194637 rows created.
SQL>
SQL> INSERT INTO tt_customers(id)
  2  SELECT user_id
  3    FROM web_deactive;
2143 rows created.
SQL>
SQL> INSERT INTO tt_customers(id)
  2  SELECT user_id
  3    FROM web_black_list;
4234 rows created.
SQL>
SQL> INSERT INTO customers_historical(id,name)
  2  SELECT c.id,c.name
  3  FROM customers c,
  4  tt_customers tc
  5  WHERE tc.id = c.id;
201014 rows created.
SQL>
SQL> DELETE FROM customers c
  2  WHERE EXISTS (SELECT 1 FROM  tt_customers tc WHERE tc.id = c.id );
201014 rows deleted.

The pg_global_temp_tables Library

As mentioned above, the temporary tables in PostgreSQL can not be invoked using the notation schema.table, so the pg_global_temp_tables library (there are some similar libraries available on github) it’s a workaround very useful to be used in database migrations from Oracle to PostgreSQL.

In order to keep the Oracle notation schema.temporary_table in queries or stored procedures:

SELECT c.id,c.nam
    FROM web_app.tt_customers tc,
                 Web_app.customers c
    WHERE c.id = tc.id

It allows to remain the temporary tables over the code with the schema notation.

Basically, it consists in a view: web_app.tt_customers created under the schema on which it’s supposed to have the temporary table and this view will query the temporary table tt_customers through a function called web_app.select_tt_customers:

CREATE OR REPLACE VIEW WEB_APP.TT_CUSTOMERS AS 
  SELECT * FROM WEB_APP.SELECT_TT_CUSTOMERS();

This function returns the contents of temporary table:

CREATE OR REPLACE FUNCTION WEB_APP.SELECT_TT_CUSTOMERS() RETURNS TABLE(ID INR, NAME VARCHAR) AS $$
BEGIN
    CREATE TEMPORARY TABLE IF NOT EXISTS TT_CUSTOMERS(ID INT, NAME) ON COMMIT DROP;
    RETURN QUERY SELECT * FROM TT_CUSTOMERS;
END;
$$ LANGUAGE PLPGSQL;  

Summary

The temporary tables are used essentially to store intermediate results and thus avoid complex and heavy computing,

Thereafter it’s listed some characteristics of temporary tables either in PostgreSQL or Oracle:

  • It can be used on view
  • It can use the TRUNCATE command
  • It can not be partitioned
  • The Foreign key constraint on temporary tables are not allowed
  • This kind of tables are an alternative for CTEs (Common Table Expressions) also known for the Oracle professionals as WITH clause
  • In terms of security and privacy, these tables are a valuable asset because the data is only visible for a current session
  • The temporary tables are automatically dropped (in PostgreSQL) or deleted(in Oracle) once the session/transaction ends.

For the temporary tables in PostgreSQL it’s advisable do not use the same name of a permanent table in a temporary table. On the Oracle side it’s a good practice the generation of statistics for the sessions that include considerable volume of data in GTT in order to force the Cost-Based Optimizer (CBO) to choose the best plan for the queries that are using these kind of tables.

Autonomous by Oracle: The Database That’s Cheaper Than Free

$
0
0

It is a known fact that over 80% of businesses fail within their first five years. Studies have shown that the number one reason for this failure is poor cash flow management. New business owners don’t understand the importance of cutting costs, proper invoicing, leasing instead of buying, and further means of appropriate financial management. Only after the business starts to have financial problems, then and only then, do cutting costs and increasing cash flow become a top priority. You can easily conclude that if businesses find ways to reduce cost from the very beginning, they have a better chance of surviving a financial storm.

One area that businesses can drastically cut costs is by reducing database expenditures. Some of the best databases out there are free and open source systems, such as the popular PostgreSQL. However, utilizing cloud services to execute failover, backups, disaster recovery, and additional redundancy protection can be very expensive.

Luckily, Oracle has developed the world’s first Autonomous Database, which guarantees to cut your cloud services bill by more than half. In fact, it’s the cheapest database on the market today.

Data administrators (DBA) will no longer be completing routine daily tasks to keep the system functioning correctly. The expense associated with planned and unplanned downtime is virtually eliminated. Oracle can contractually guarantee 99.995% availability. That is about two minutes of downtime each month, totaling less than 30 minutes a year. All of this is an enormous cost-savings for any business, and yet, not a lot of people are talking about it. That’s where we come in.

Save With Self-Driving Optimization

When a database is set up for the first time, DBAs are meticulous on how they tune it for optimal performance. A detailed review of the configuration very important. Reports containing information of the read and write workloads are also carefully examined. Once a certain threshold is reached with the system workload, the DBA moves forward with administering other essential tasks. However, months will go by, and the same configuration and tuning are not adjusted to meet the ever-changing schema of the system. This is certainly a problem.

Every database is continually changing in size and workload volume based on a wide variety of metrics. It’s straightforward. As a business grows, the number of transactions increase, and the need for more storage and compute capacity is imminent. Therefore, tuning should be performed regularly. However, it is difficult to do that when a DBA has downtime restrictions and other time-sensitive responsibilities that must be completed.

The Autonomous Database is designed to resolve this business need efficiently. It continuously optimizes minute by minute, to maintain maximum performance with minimal cost. Based on your organization, it automatically provisions itself by allocating storage, compute capacity, and network capacity.

If there are no transactions taking place at any point throughout the day, the system will remain idle, utilizing no servers at all to save on cost. The ability to stay idle, also referred to as a serverless system, is not a feature that all databases have. When the workload increases, the system will automatically begin to allocate additional servers to meet the demand. By operating on accelerator hardware, it allows businesses to pay only for what they need, and not what they have initially allocated. This all takes place with zero downtime.

Amazon’s Relational Database Service (RDS) can manage PostgreSQL, AWS Aurora, AWS Redshift,MySQL, and other relational databases on the cloud. If any adjustments are needed, such as adding more storage or completing security patches, it requires a significant amount of downtime. Every minute that a system is down, it costs business money and resources that could be distributed elsewhere. Also, Amazon RDS does not optimize on its own, but remains fixed, based on pre-allocated storage options. Therefore, even if the database is free, the system’s performance alone could be costing your business thousands of dollars every single year.

Side-by-side, the price for Oracle’s database and Amazon RDS are practically identical. Nevertheless, advanced machine learning algorithms give Oracle’s database the competitive edge. This means that if Oracle can complete a task in 5 minutes, and it takes RDS 25 minutes for the same job, it can be determined that Oracle’s database is the cheaper product due to its performance, and additional cost savings techniques.

Reduced Labor Costs

Since the Autonomous Database requires less maintenance, the role of the typical DBA will change. Machine learning drives this database to perform the generic tasks that were once the DBA’s job. Query tuning, storage management, and the like, are now automatically completed. Engineered systems provide users with pre-optimized, pre-configured, and pre-tested database, which allows for provisioning to take place much faster.

The present DBA role is moving towards being a data professional, rather than an administrator. Studying statistics that are retrieved from the database, and leveraging it to make business decisions will now be the primary focus. The job outlook for this position will not weaken because of this self-driven database. In fact, the opposite will occur. Businesses are going to desperately need more data professionals to gain a competitive edge within their respective industries.

The image below shows a comparison of the present DBA role, and the new role DBAs will be moving to with the Autonomous Database.

A comparison of the present DBA role, and the new role DBAs will be moving to with the Autonomous Database.

With the use of artificial intelligence, the Autonomous Database created itself with the aid of machine learning. With this knowledge, you may be prompted to ask, will a DBA ever lose control over this self-driving database? The answer is no. Believe it or not, you will have more control than ever before. Internal and external malicious attacks will be detected much sooner. Provisioning can be completed at a faster rate, storage capacity can be changed with the click of a button, and you will also see an improvement with end-to-end service levels.

No Training Costs

What do you have to learn to execute this database? Nothing. It’s completely automated.

It will not be necessary to train your employees on how to use this system properly. They can move forward with their daily tasks because there is nothing to learn. There are built-in documents that can quickly be referred to if a question should arise. The Autonomous Database can be compared to a self-driving car. With a self-driving vehicle, you simply plug in the address, and the car automatically performs the procedures necessary to make it the destination safely. The Autonomous Database performs in the same fashion. All you have to do is request specific information, and it will be provided in full detail.

With this database, there is also a reduced risk of human error. As long as the DBA accurately enters user information and job title, an assessment of privileges takes place, and user access will be granted based on predetermined information.

Supplementary Database Features

Reducing cost with this database is just the tip of the iceberg. There are key features that are included with the service that you cannot overlook. Not only is it cheaper, but you will also be getting more out of your system. Data scientists can use metrics retrieved with the help of machine learning, to increase sales and production. Migration tools make the transfer of data seamless.

Here are a few more features that genuinely showcase the uniqueness of this service.

Maximum Security

All data in that’s transit and at rest are encrypted by default. Fraudulent activity is flagged and deterred.

High-Performance Workloads

Preconfigured resource intelligence provides users with optimized query performance that cannot be matched.

Database Migration Tool

Migration tools with cloud-ready capability allow for a seamless transition from a third-party database to take place.

Elasticity

Able to scale storage capacity without human intervention. There is never a need to pay for fixed blocks of storage.

Incorporated SQL Tool

Apache Zeppelin is a web-based notebook that gives you the ability to create data-driven documents with language back-ends. This includes Shell, Markdown, Python, Hive, Angular, and SparkSQL.

Fully Automated Database

The database will tune, patch, and upgrade itself with zero downtime or human intervention. There is no need for planned downtime to complete these operations.

Data Warehouse Cloud

This product manages analytic workloads for data warehousing, data mart, machine learning, and data lake.

Autonomous Transaction Processing

This product manages mixed workloads for application development, batch, transactions, reporting, IoT, and machine learning.

Oracle Data-Loading

Oracle’s cloud-based data-loading is scalable and fast, transporting data from AWS S3, Oracle Object Store, of on-premise data.

It is safe to say that any business that transitions to the Autonomous Database is going to benefit from the change. It’s really a no brainer. Again, your cloud services bill will decrease tremendously. The transition to this database will be easy since you do not have to execute a training program for your employees. You also will see a decrease in administration costs since the database it automated. And lastly, your DBAs will have the time and resources to study data to lead the growth of your business. There isn’t a database anywhere else that is able to provide all of these features at a lower cost. It is wise to consider a database that will reduce cloud service expenditure and the labor associated with administration tasks.

I choose Autonomous. Will you?

MySQL Load Balancing: Migrating ProxySQL from On-Prem to AWS EC2

$
0
0

Migrations between different environments are uncommon in database world. Migrations from one provider to another one. Moving from one datacenter to another. All of this happens on a regular basis. Organisations search for expense reduction, better flexibility and velocity. Those who owned their datacenter look forward to switch to one of the cloud providers where they can benefit from better scalability and handling capacity changes. Migrations touch all elements of the database environment - databases themselves but also the proxy and caching layer. Moving databases around is tricky but it is also hard to manage multiple proxy instances, ensuring that the configuration is in sync across all of them.

In this blog post we will take a look at challenges related to one particular piece of migration - migrating ProxySQL proxy layer from on-prem environment to EC2. Please keep in mind this is just an example, the truth is, the majority of the migration scenarios will look pretty much similar so the suggestions we are going to give in this blog post should apply to the majority of the cases. Let’s take a look at the initial setup.

Initial On-Prem Environment

The initial, on-prem setup is fairly simple - we have a three node Galera Cluster, two ProxySQL instances which are configured to route the traffic to backend databases. Each ProxySQL instance has a Keepalived colocated. Keepalived manages Virtual IP and assigns it to one of the available ProxySQL instances. Should that instance fails, VIP will be moved to the other ProxySQL, which will commence serving the traffic. Application servers use VIP to connect to and they are not aware of the setup of the proxy and database tiers.

Migrating to an AWS EC2 Environment.

There are a couple of prerequisites that are required before we can plan a migration. Migrating the proxy layer is no different in this regard. First of all, we have to have a network access between existing, on-prem environment and EC2. We will not be going into details here as there are numerous options to accomplish that. AWS provides services like AWS Direct Connect or hybrid cloud integration in Amazon Virtual Private Cloud. You can use solutions like setting up OpenVPN server or even use SSH tunneling to do the trick. All depends on the available hardware and software options at your disposal and how flexible you want the solution to be. Once the connectivity is there, let’s stop a bit and think how the setup should look like.

From the ProxySQL standpoint, there is one main concern - how to ensure that the configuration of the ProxySQL instances in the EC2 will be in sync with the configuration of ProxySQL instances on-prem? This may not be a big deal if your configuration is pretty much stable - you are not adding query rules, you are not tweaking the configuration. In that case it will be enough just to apply the existing configuration to newly created ProxySQL instances in EC2. There are a couple of ways to do that. First of all, if you are ClusterControl user, the simplest way will be to use “Synchronize Instances” job which is designed to do exactly this.

Another option could be to use dump command from SQLite: http://www.sqlitetutorial.net/sqlite-dump/

If you store your configuration as a part of some sort of infrastructure orchestration tool (Ansible, Chef, Puppet), you can easily reuse those scripts to provision new ProxySQL instances with proper configuration.

What if the configuration changes quite often? Well, there are additional options to consider. First of all, most likely all the solutions above would work too, as long as the ProxySQL configuration is not changing every couple of minutes (which is highly unlikely) - you can always sync the configuration straight before you do the switchover.

For the cases where configuration changes quite often you can consider setting up a ProxySQL cluster. The setup has been explained in detail in our blog post: https://severalnines.com/blog/how-cluster-your-proxysql-load-balancers. If you would like to use this solution in a hybrid setup, over WAN connection, you may want to increase cluster_check_interval_ms a bit from default 1 second to a higher value (5 - 10 seconds). ProxySQL cluster will ensure that all the configuration changes made in on-prem setup will be replicated by ProxySQL instances in EC2.

Final thing to consider - how to switch to correct servers in ProxySQL? The gist is - ProxySQL stores list of backend MySQL servers to connect to. It tracks their health and monitors latency. In the setup we discuss our on-prem ProxySQL servers hold list of backend servers which are also located on-prem. This is the configuration we will sync to the EC2 ProxySQL servers. This is not a hard problem to tackle and there are a couple of ways to work around it.

For example, you can add servers in OFFLINE_HARD mode in a separate hostgroup - this will imply that the nodes are not available and using a new hostgroup for them will ensure that ProxySQL will not check their state like it does for Galera nodes configured in hostgroups used for read/write splitting.

Alternatively you can simply skip those nodes for now and, while doing the switchover, remove existing servers and then run couple INSERT commands to add backend nodes from EC2.

Conclusion

As you can see, the process of migrating ProxySQL from on-prem setups to cloud is quite easy to accomplish - as long as you have network connectivity, remaining steps are far from complex. We hope this short blog post helped you to understand what’s required in this process and how to plan it.

PostgreSQL Replication Setup & Maintenance Using Ansible

$
0
0

Replication is a key feature for most setups and it is supported by most database technologies on the market. The PostgreSQL community introduced replication in version 9.0 (called Streaming Replication or SR), since then the replication in PostgreSQL has evolved with additional features like Cascading Replication, Logical Decoding, and several more optimizations.

In this blog, we will look at using the Ansible role postgresql as developed by “Demonware” (a fork of the role “ANXS/postgresql”). I had already talked about using the “ANXS/postgresql” role in my previous blog but I did not discuss the replication feature. The Ansible role “postgresql” adds the ability to set up PostgreSQL replication using repmgr.

About Repmgr

Repmgr is an open-source command line tool developed and maintained by 2ndQuadrant. The tool automates most of the tasks related to managing the PostgreSQL replication cluster. Below is the list of tasks which can be performed smoothly using repmgr command and repmgrd daemon.

  • Bootstrapping the PostgreSQL replication cluster.
  • Doing auto-failover and manual switch-over of the primary instance.
  • Adding and removing the standby (read-replica) instances.

Preparing the Controller Node

Prepare the controller node with the Ansible PostgreSQL role, playbooks, inventories and custom PostgreSQL replication.

$ mkdir demo
$ pushd demo
$ mkdir roles
$ git clone https://github.com/Demonware/postgresql roles/postgresql
$ pushd roles/postgresql
$ git checkout add-repmgr-extension

In the downloaded role, there are two defaults variable files main.yml and repmgr.yml file. However, Ansible will consider only the main.yml file. To make the Ansible also use the repmgr.yml file we are moving both files under the directory defaults/main.

$ mkdir defaults/main
$ mv defaults/main.yml defaults/repmgr.yml defaults/main
$ popd

Ansible Inventory File

For the demo, we will setup the PostgreSQL replication cluster on three nodes. I created three CentOS VMs vm-01, vm-02 and vm-03, all of them are listed under the group postgres_cluster in the development.yaml file.

$ cat development.yaml
all:
  children:
    postgres_cluster:
      hosts:
        vm-01:
        vm-02:
        vm-03:
      vars:
        ansible_user: "vagrant"

Do Ansible ping and make sure we are able to reach all the hosts under the group postgres_cluster.

$ ansible -i development.yaml -m ping  postgres_cluster
vm-01 | SUCCESS => {
    "changed": false,
    "ping": "pong"
}
vm-03 | SUCCESS => {
    "changed": false,
    "ping": "pong"
}
vm-02 | SUCCESS => {
    "changed": false,
    "ping": "pong"
}

Custom Variable File

In the custom variable file custom-vars.yaml, we will define the following things:

  • PostgreSQL version to install and encoding to use
  • Modifying the PostgreSQL configuration to enable replication, we will modify the parameters like wal_level, max_wal_senders, max_replication_slots, hot_standby, archive_mode, archive_command
  • Creating the necessary users and database
  • Modifying pg_hba.conf file to allow the necessary connection from the application and the repmgr replication
  • Some repmgr related variables
$ cat custom-vars.yaml 
# Basic settings
postgresql_version: 11
postgresql_encoding: "UTF-8"
postgresql_locale: "en_US.UTF-8"
postgresql_ctype: "en_US.UTF-8"
postgresql_admin_user: "postgres"
postgresql_default_auth_method: "peer"
postgresql_listen_addresses: "*"
postgresql_wal_level: "replica"
postgresql_max_wal_senders: 10
postgresql_max_replication_slots: 10
postgresql_wal_keep_segments: 100
postgresql_hot_standby: on
postgresql_archive_mode: on
postgresql_archive_command: "/bin/true"
postgresql_shared_preload_libraries:
  - repmgr

postgresql_users:
  - name: "{{repmgr_user}}"
    pass: "password"
postgresql_databases:
  - name: "{{repmgr_database}}"
    owner: "{{repmgr_user}}"
    encoding: "UTF-8"
postgresql_user_privileges:
  - name: "{{repmgr_user}}"
    db: "{{repmgr_database}}"
    priv: "ALL"
    role_attr_flags: "SUPERUSER,REPLICATION"
postgresql_pg_hba_custom:
  - { type: "host", database: "all", user: "all", address: "192.168.0.0/24", method: "md5" }
  - { type: "host", database: "replication", user: "repmgr", address: "192.168.0.0/24", method: "md5" }  
  - { type: "host", database: "replication", user: "repmgr", address: "127.0.0.1/32", method: "md5" }  

# repmgr related variables
postgresql_ext_install_repmgr: yes
repmgr_target_group: "postgres_cluster"
repmgr_target_group_hosts: "{{ groups[repmgr_target_group] }}"
repmgr_master: "vm-03"

Following are some of the notable variables defined in custom-vars.yaml:

  • postgresql_version: 11 - Installs PostgreSQL version 11
  • postgresql_ext_install_repmgr: yes - Installs repmgr extension on the PostgreSQL cluster
  • repmgr_target_group: "postgres_cluster" - Repmgr works on the hosts defined under the group "postgres_cluster" defined in the inventory file
  • repmgr_master: "vm-03" - Host vm-03 will be the PostgreSQL primary instance, vm-01 and vm--02 will replicate from vm-03

Ansible Playbook

In the below postgres-play.yaml playbook, I have assigned the role postgresql against the host group postgres_cluster. I have also included custom variable file custom-vars.yaml which has the configuration for PostgreSQL and repmgr.

$ cat postgres-play.yaml 
- hosts: postgres_cluster
  become: yes
  vars_files:
    - ./custom-vars.yaml
  roles:
    - postgresql

Running Ansible Playbook

We have now created the following Ansible artifacts and we are ready to run the Ansible playbook.

  • roles/postgresql, Ansible role directory.
  • custom-vars.yaml, Ansible variable file.
  • development.yaml, Ansible inventory file.
  • postgres-play.yam, Ansible playbook file.

Run the below ansible-playbook command from the controller node. Since the postgresql role expects the sudo access of the controller, we are specifying -K option in the command, which in-turn ask us to enter the SUDO password of the controller node.

$ ansible-playbook -Ki development.yaml postgres-play.yaml 
SUDO password: 

PLAY [postgres_cluster] ********************************************************************************************************************************************************************************************************************************************************

TASK [Gathering Facts] *********************************************************************************************************************************************************************************************************************************************************
ok: [vm-01]
ok: [vm-02]
ok: [vm-03]
...
...
PLAY RECAP *********************************************************************************************************************************************************************************************************************************************************************
vm-01                      : ok=41   changed=4    unreachable=0    failed=0
vm-02                      : ok=41   changed=5    unreachable=0    failed=0
vm-03                      : ok=43   changed=5    unreachable=0    failed=0

Check the PLAY RECAP in the command output and make sure the failed count is 0.

Check PostgreSQL Replication

With the below repmgr cluster show command we can check the status of the PostgreSQL replication cluster. It shows the role, status, timeline of all the PostgreSQL instance in the replication cluster.

$ sudo -u postgres /usr/pgsql-11/bin/repmgr -f /etc/postgresql/11/data/repmgr.conf cluster show
 ID | Name  | Role    | Status    | Upstream | Location | Priority | Timeline | Connection string                                     
----+-------+---------+-----------+----------+----------+----------+----------+--------------------------------------------------------
 1  | vm-01 | standby |   running | vm-03    | default  | 100      | 1        | host=vm-01 user=repmgr dbname=repmgr connect_timeout=2
 2  | vm-02 | standby |   running | vm-03    | default  | 100      | 1        | host=vm-02 user=repmgr dbname=repmgr connect_timeout=2
 3  | vm-03 | primary | * running |          | default  | 100      | 1        | host=vm-03 user=repmgr dbname=repmgr connect_timeout=2

From the output of the above command, vm-03 is the primary and vm-01,vm02 are the standby instance replicating from the upstream node vm-03. All the PostgreSQL instances are in the running state.

Checking pg_stat_replication view on primary vm-03 to confirm the both vm-01 and vm-02 are replicating fine.

$ sudo -iu postgres /usr/pgsql-11/bin/psql -h vm-03 -c 'select * from pg_stat_replication'
Password for user postgres: 
 pid  | usesysid | usename | application_name |  client_addr  | client_hostname | client_port |         backend_start         | backend_xmin |   state   | sent_lsn  | write_lsn | flush_lsn | replay_lsn | write_lag | flush_lag | replay_lag | sync_priority | sync_state 
------+----------+---------+------------------+---------------+-----------------+-------------+-------------------------------+--------------+-----------+-----------+-----------+-----------+------------+-----------+-----------+------------+---------------+------------
 8480 |    16384 | repmgr  | vm-02            | 192.168.0.122 |                 |       59972 | 2019-07-18 09:04:44.315859+00 |              | streaming | 0/A000870 | 0/A000870 | 0/A000870 | 0/A000870  |           |           |            |             0 | async
 8481 |    16384 | repmgr  | vm-01            | 192.168.0.121 |                 |       35598 | 2019-07-18 09:04:44.336693+00 |              | streaming | 0/A000870 | 0/A000870 | 0/A000870 | 0/A000870  |           |           |            |             0 | async
(2 rows)

Adding Another Standby Node to the Cluster

For adding another PostgreSQL node to the cluster, we have to just re-run the Ansible playbook after adding the particular host in the inventory. In the steps below, I am adding vm-04 to my existing Repmgr Postgresql replication cluster.

  1. Adding vm-04 to the Ansible inventory file developmeb
    $ cat development.yaml
    all:
      children:
        postgres_cluster:
          hosts:
            vm-01:
            vm-02:
            vm-03:
            vm-04:
          vars:
            ansible_user: "vagrant"
  2. Run Ansible playbook
    $ ansible-playbook -Ki development.yaml postgres-play.yaml
    SUDO password:
    
    PLAY [postgres_cluster] ********************************************************************************************************************************************************************************************************************************************************
    
    TASK [Gathering Facts] *********************************************************************************************************************************************************************************************************************************************************
    ok: [vm-01]
    ok: [vm-04]
    ok: [vm-03]
    ok: [vm-02]
    ...
    ...
    RUNNING HANDLER [postgresql : restart postgresql] ******************************************************************************************************************************************************************************************************************************
    changed: [vm-04]
    changed: [vm-02]
    changed: [vm-01]
    changed: [vm-03]
    
    PLAY RECAP *********************************************************************************************************************************************************************************************************************************************************************
    vm-01                      : ok=41   changed=4    unreachable=0    failed=0
    vm-02                      : ok=41   changed=5    unreachable=0    failed=0
    vm-03                      : ok=43   changed=5    unreachable=0    failed=0
    vm-04                      : ok=46   changed=32   unreachable=0    failed=0
  3. Check replication cluster
    $ sudo -u postgres /usr/pgsql-11/bin/repmgr -f /etc/postgresql/11/data/repmgr.conf cluster show
     ID | Name  | Role    | Status    | Upstream | Location | Priority | Timeline | Connection string                                     
    ----+-------+---------+-----------+----------+----------+----------+----------+--------------------------------------------------------
     1  | vm-01 | standby |   running | vm-03    | default  | 100      | 1        | host=vm-01 user=repmgr dbname=repmgr connect_timeout=2
     2  | vm-02 | standby |   running | vm-03    | default  | 100      | 1        | host=vm-02 user=repmgr dbname=repmgr connect_timeout=2
     3  | vm-03 | primary | * running |          | default  | 100      | 1        | host=vm-03 user=repmgr dbname=repmgr connect_timeout=2
     4  | vm-04 | standby |   running | vm-03    | default  | 100      | 1        | host=vm-04 user=repmgr dbname=repmgr connect_timeout=2

Conclusion

So far we have seen on setting up the Repmgr PostgreSQL replication cluster using Ansible. Once the repmgr cluster has been setup we can use repmgr command to do other maintenance on the replication cluster like doing failover and switch-over of the primary node and setting up cascade replication. Please check the repmgr documentation for more details.

A Guide to MongoDB Deployment & Maintenance Using Puppet: Part 1

$
0
0

Database clustering often involves configuring and maintaining a number of servers and instances, all with a collective purpose. By this we mean you can have different database servers at different hosts which are serving the same data.

For example, let’s say you have servers A, B, C, and D, you decide to install MongoDB on each but then later realize there is a new version you should have used. When you have a large number of servers and you need to update the MongoDB version, configuring them manually (one-by-one) has a lot of setbacks. These setbacks can include; taking too long to reconfigure (hence your site will have a long downtime) or making your DB prone to some configuration errors.

Besides, there are always repetitive tasks you would like to be executed automatically, instead of undergoing the same steps over-and-over, every time you want to do similar changes. At some point we also need to learn new modules as far as technology advancement is concerned that can help us boost the cluster performance

In simple terms, we need an automation systems which can easen all the mentioned undertakings. Puppet is one of the most preferred software systems for achieving this since:

  • It is easy and faster to configure and deploy MongoDB cluster.
  • Repetitive tasks can be easily automated such that they are executed automatically later.
  • The whole cluster infrastructure can be collectively managed from a single platform.
  • Easy provisioning for new nodes in cloud, hybrid or physical environment.
  • Orchestrate changes and events across a cluster of nodes.
  • Discover resources within minutes that can help you perform different tasks easily.
  • Scales well from 1 to 200k nodes.
  • Supported by a number of platforms

What is Puppet?

Puppet is a language that is used to get a machine to a desired state or rather is an engine that is used to interpret and apply some defined instructions to a serving system. Like Ansible, Puppet is also a configuration management tool used to automate and execute database cluster tasks. However, it is more advanced and well established considering that it is the oldest hence plenty of newly integrated features that would make it more sophisticated than the others. One of the major reasons I prefer Puppet personally is the capability it gives me to configure a large number of nodes connected together with load balancers, network devices or firewalls. Puppet is often used in large enterprises with complex environments.

How Puppet Works

Puppet uses the idempotency technique that helps it manage a certain machine from the time of creation and throughout its lifecycle even with configuration changes. The core advantage with this is, the machine is updated over a number of years rather than being built multiple times from scratch. In case of an update, Puppet checks the current target machine status and changes will be applied only when there is a specific change in the configuration.

Idempotency

The idempotency workflow is shown below:

The Puppet master collects details regarding the current state of the target machine and compares it to the machine level configuration details and then returns the details which are sent to the conversion layer.

The conversion layer compares the retrieved configuration with the newly defined configuration details and then creates a catalog which is sent to the target Puppet agents, in this case, the target nodes for which the changes are to be applied.

The configuration changes are then applied to the system to transform it to a desired state. After the changes have been implemented, the Puppet agent sends a report back to the Puppet master which is documented to define the new state of the system as the supplied catalog.

Puppet Basic Components

  1. Puppet Resources

    These are the key modelling components of a particular machine whose descriptions will get the machine to a desired state.

  2. Providers

    Providers are particular resources used to add packages to the system e.g. yum and apt-get. There are default providers but one can add more when in need of some packages.

  3. Manifest

    This is a collection of resources that are defined either in a function or a class coupled together to configure a target system.

    The structure should be

    resource:{‘module’:
    	attribute => value
    }

    For example installing mongodb we can have a manifest file called Mongodb.pp with the following contents:

    package {‘mongodb’:
    		ensure => installed
         }
  4. Modules

    This is the key building block of Puppet which is basically a collection of resources, templates and files. They can be distributed in any operating system hence can be used multiple times with the same configuration.

  5. Templates

    Templates are used to define customized content and variable input. They use the Ruby syntax, i.e. if you want to define a port to listen to:

    Listen <% =@Port_number %>

    Port_number variable in this case is defined in the manifest that references this template.

  6. Static Files

    These are general files that may be required to perform specific tasks. They are located in the files directory of any module.

Puppet Installation

For the purpose of learning, we are going to install and configure puppet in a virtual machine which we will create in our local machine. First of all you will need to install virtualbox and vagrant. After installing, open a new terminal and create a Puppet directory probably on your desktop and run the command $ vagrant init. This will create a virtual machine and label it vagrant. Then we can log into this machine with the command $ vagrant ssh.

If you get a screen like the one below then your machine is up and running.

Otherwise if you are on a server machine you can ignore this step and proceed from adding the puppet package like below.

Add the puppet package with the command

$ wget https://apt.puppetlabs.com/puppet5-release-xenial.deb

And then unpack the package and install with

$ sudo dpkg -i puppet5-release-xenial.deb

We need to update our repositories so we run

$ sudo apt-get update

Install the puppet-agent by running

$ sudo apt-get install puppet-agent

After the installation is complete we can confirm by checking the version. You might need to log out of your virtual machine in order for Puppet path to be added to the environment then run $ puppet --version or if you have not logged out run $ /opt/puppetlabs/bin/puppet --version. If you get a version number like 5.5.14 then the installation was successful.

After installing MongoDB using the Mongodb.pp we created above, we can simply write some task to setup a database products and also add a user to this db.

‘Mongodb_database’ is used to create and manage databases within MongoDB

mongodb_database{‘products’:
	ensure => present,
            tries => 10
}

‘Mongodb_user can be used to create and manage users within a MongoDB database.’

To add a user to the ‘products’ database

mongodb_user {userprod:
  username => ‘prodUser’,
  ensure => present,
  password_hash => mongodb_password(‘prodUser’, ‘passProdser’),
  database => prodUser,
  roles => [‘readWrite’, ‘dbAdmin’],
  tries  => 10
}

Conclusion

In this blog we have learned what Puppet is, the merits associated with it, and its working architecture. Puppet is a bit more complex from the other management tools (such as Chef and Ansible) but it has a lot of modules that can be used to resolve issues around database management. In the next part, we are going to discuss how to connect remote machines so that they can be reconfigured using the defined manifest files.

A Guide to MongoDB Deployment & Maintenance Using Puppet: Part 2

$
0
0

In the previous blog, we showed you how to set up our machine with the Puppet and then install and configure MongoDB. Since we are going to configure a number of nodes or rather machines we need a puppet master. In our case though, we will create a  git repository where we will push our manifests and apply them to our machines.

To create a local git repository first select the path you want to use i.e./opt/. Then create git repository by running  $sudo mkdir repository. Get root user permission to change the contents of this directory by issuing the command  $sudo chown vagrant:vagrant repository. To initialize this directory as a git repository after issuing the command $ cd repository, run $ git init --bare --shared if you navigate to this directory you should now see something like

vagrant@puppet:/vagrant/repository$ ls -l

total 12

-rw-rw-r-- 1 vagrant vagrant  23 Jul 15 07:46 HEAD

drwxr-xr-x 1 vagrant vagrant  64 Jul 15 07:46 branches

-rw-rw-r-- 1 vagrant vagrant 145 Jul 15 07:46 config

-rw-rw-r-- 1 vagrant vagrant  73 Jul 15 07:46 description

drwxr-xr-x 1 vagrant vagrant 352 Jul 15 07:46 hooks

drwxr-xr-x 1 vagrant vagrant  96 Jul 15 07:46 info

drwxr-xr-x 1 vagrant vagrant 128 Jul 15 07:46 objects

drwxr-xr-x 1 vagrant vagrant 128 Jul 15 07:46 refs

-rw-r--r-- 1 vagrant vagrant   0 Jul 1 15:58 test.pp

This is the basic structure of a git repository and the options --bare and --share will enable us to push and pull files from the directory. 

We need to set up a system that will enable communication between the involved machines and this remote master server. The system in this case will be referred to as a daemon. The daemon will be accepting requests from remote hosts to either pull or push files to this repository. To do so, issue the command $git daemon --reuseaddr --base-path=/opt/ --export-all --enable=receive-pack

However the good practice will be to create a file from which we can run this in the background.We therefore need to  set the service by issuing the command sudo vim /etc/systemd/system/gitd.service. In the new file populate it with these contents

[Unit]

Description=Git Repo Server Daemon

[Service]

ExecStart=/usr/bin/git daemon --reuseaddr --base-path=/opt/ --export-all --enable=receive-pack

[Install]

WantedBy=getty.target

DefaultInstance=ttyl

Save the file and exit by pressing <Esc> then type :x and the press <Enter>. To start the server run the command $ systemctl start gitd. For the authentication use the password we set in this case vagrant. You should be presented with something like this 

vagrant@puppet:/opt/repository$ systemctl start gitd

==== AUTHENTICATING FOR org.freedesktop.systemd1.manage-units ===

Authentication is required to start 'gitd.service'.

Authenticating as: vagrant,,, (vagrant)

Password: 

==== AUTHENTICATION COMPLETE ===

To check if the service is running $ ps -ef | grep git and you will get: 

vagrant@puppet:/opt/repository$ ps -ef | grep git

root      1726 1  0 07:48 ?     00:00:00 /usr/bin/git daemon --reuseaddr --base-path=/opt/ --export-all --enable=receive-pack

root      1728 1726  0 07:48 ?     00:00:00 git-daemon --reuseaddr --base-path=/opt/ --export-all --enable=receive-pack

vagrant   1731 1700  0 07:48 pts/0    00:00:00 grep --color=auto git

Now if we run $ git clone git://198.168.1.100/repository (remember to change the IP address with your machine’s network IP) in the root directory, you will get a newly created repository folder. Remember to configure your credentials by uncommenting the email and password in the config file. Run $ git config --global --edit to access this file.

This repository will act as our central server for all the manifests and variables.

Setting Up the Environment

We now need to set up the environment from which we will configure the nodes. First, switch to the vagrant directory and clone the repository we just created with the same command as above.

 Remove the manifest directory in the vagrant folder by running $rm -r manifest/

Make a new production folder with $ mkdir production and clone the same repository we created above with $ git clone git://198.168.1.100/repository . (don’t forget the dot at the end)

 Copy and paste the contents of puppetlabs production environment into this production folder by issuingcp -pr /etc/puppetlabs/code/environments/production/* . Your production directory should now look like this

vagrant@puppet:/vagrant/production$ ls -l

total 8

drwxr-xr-x 1 vagrant vagrant  64 Apr 26 18:50 data

-rw-r--r-- 1 vagrant vagrant 865 Apr 26 18:50 environment.conf

-rw-r--r-- 1 vagrant vagrant 518 Apr 26 18:50 hiera.yaml

drwxr-xr-x 1 vagrant vagrant  96 Jul 2 10:45 manifests

drwxr-xr-x 1 vagrant vagrant  64 Apr 26 18:50 modules

-rw-r--r-- 1 vagrant vagrant   0 Jul 1 16:13 test.pp

We need to push these changes to the root repository so we run 

$ git add * && git commit -m "adding production default files"&& git push

To test if the git configuration is working, we can delete the contents in the directory /etc/puppetlabs/code/environments/production/ by running $ sudo rm -r * in this directory and then pull the files from the master repository as root user i.e. $ git clone git://198.168.1.100/repository . (don’t forget the dot at the end). Only directories with contents are pulled in this case so you might miss the manifests and modules folders. These operations can be carried out  in all machines involved either master puppet or client machine. So our tasks will be pulling the changes from the main server and applying the changes using the manifests.

Execution Manifest

This is the script we are going to write for helping us pull changes and apply them automatically to our other nodes. Not only do you have to use the production environment,  you can add as many environments as possible then dictate puppet from which one to search. In the root  production/manifests directory we will create the execution manifest as puppet_exec.pp and populate it with the following contents

 file { "This script will be pulling and applying the puppet manifests":

path => '/usr/local/bin/exec-puppet',

content => 'cd /etc/puppetlabs/code/environments/production/ && git pull; /opt/puppetlabs/bin/puppet apply manifests/'

mode => "0755"

}

cron {'exec-puppet':

command => '/usr/local/bin/exec-puppet',

hour => '*',

minute => '*/15'

}

File is a resource which has been described to execute the puppet manifests. Add an appropriate path for the file we are creating and populate it with the commands that are  to be issued when it will be executed. 

The commands are executed systematically that is, we first navigate to the production environment, pull the repository changes and then apply them to the machine. 

We supply the manifests directory to each node from which it can select the manifest directed to it for application. 

A duration over which the execution file is to be run is also set. In this case for every hour, execute the file 4 times.

To apply this to our current machine, $ cd /vagrant/production. Add everything to git by running $ git add * then $ git commit -m “add the cron configurations” and lastly $ git push. Now navigate to $ cd /etc/puppetlabs/code/environments/production/ and $ sudo git pull

Now if we check the manifests folder in this directory, you should see the puppet_exec.pp created as we had just defined. 

Now if we run$ sudo puppet apply manifests/ and check if the files exec-puppet has been created $ cat /usr/local/bin/exec-puppet

The contents of this file should be 

cd /etc/puppetlabs/code/environments/production/ && git pull; /opt/puppetlabs/bin/puppet apply manifests/

At this point we have seen how we can pull and push changes to our master machine which should be applied to all the other nodes. If we run $ sudo crontab -l, some important warnings are highlighted on the exec-puppet file created.

# HEADER: This file was autogenerated at 2019-07-02 11:50:56 +0000 by puppet.

# HEADER: While it can still be managed manually, it is definitely not recommended.

# HEADER: Note particularly that the comments starting with 'Puppet Name' should

# HEADER: not be deleted, as doing so could cause duplicate cron jobs.

# Puppet Name: exec-puppet

*/15 * * * * /usr/local/bin/exec-puppet

Configuring the Machines

Let’s say our vagrant file looks like

Vagrant.configure("2") do |config|

  config.vm.define "puppet" do |puppet|

   puppet.vm.box = "bento/ubuntu-16.04"

   #puppet.vm.hostname = "puppet"

   #puppet.vm.network "private_network", ip: "192.168.1.10"

  end

  config.vm.define "db" do |db|

    db.vm.box = "bento/ubuntu-16.04"

  end

end

In this case we have the puppet machine where we have been doing our configurations and then the db machine. Now we to automate the machine such that whenever the db machine is started, it has puppet already installed and the cron file already available to pull the manifests and apply them accordingly. You will need to restructure the contents of the db machine to be as follows

config.vm.define "db" do |db|

    db.vm.box = "bento/ubuntu-16.04"

    vm.provision "shell", inline: <<-SHELL

      cd /temp

      wget  https://apt.puppetlabs.com/puppet5-release-xenial.deb

      dpkg -i puppet5-release-xenial.deb

      apt-get update

      apt-get install -y puppet-agent

      apt-get install -y git

      rm -rf /etc/puppetlabs/code/environments/production/*

      cd /etc/puppetlabs/code/environments/production/

      git clone git://198.168.1.100/repository .

      /opt/puppetlabs/bin/puppet apply /etc/puppetlabs/code/environments/production/manifests/puppet_exec.pp

    SHELL

  End

Up to this stage, the structure of your puppet directory should be something like this

If now you run the db machine with command $ vagrant up db, some of the resources will be installed and the script we just defined can be found in the production/manifests directory. However, it is advisable to use the puppet master which is constrained to only 10 nodes for the free version otherwise you will need to subscribe to a plan. Puppet master offers more features and distributing manifests to multiple nodes, reporting logs and more control on the nodes.

Mongodb Puppet Module

This module is used in the installation of MongoDB, managing mongod server installation, configuration of the mongod daemon and management of Ops Manager setup besides the MongoDB-mms daemon.

Conclusion

In the next blog we will show you how to deploy a MongoDB Replica Set and Shards using Puppet.


Database Load Balancing with ProxySQL & AWS Aurora

$
0
0

ProxySQL is a proven solution that helps database administrators dealing with the requirements for high availability of their databases. Because it is SQL-aware, it can also be used for shaping the traffic heading towards databases - you can route queries to the particular nodes, you can rewrite queries should that be needed, you can also throttle the traffic, implement SQL firewall, create a mirror of your traffic and send it to a separate hostgroup. 

ProxySQL 2.0.5 natively supports Galera Cluster, MySQL Replication and MySQL Group Replication. Unfortunately it does not, by default, support AWS Aurora; but there is still a workaround you can use.

You may be asking yourself, why should I bother with ProxySQL when AWS provides me with an endpoint which will do the read-write split for me? That’s indeed the case but it is just the r/w split. ProxySQL, on the other hand, gives you an opportunity for not only separating reads from writes but also to take control of your database traffic. ProxySQL often can save your databases from being overloaded by just rewriting a single query.

ProxySQL 2.0.5 and AWS Aurora

Should you decide to give ProxySQL a try, there are a couple of steps you have to take. First, you will need an EC2 instance to install the ProxySQL on. Once you have the instance up and running, you can install the latest ProxySQL. We would recommend to use repository for that. You can set it up by following the steps in the documentation page: https://github.com/sysown/proxysql/wiki. For Ubuntu 16.04 LTS, which we used, you have to run:

apt-get install -y lsb-release

wget -O - 'https://repo.proxysql.com/ProxySQL/repo_pub_key' | apt-key add -

echo deb https://repo.proxysql.com/ProxySQL/proxysql-2.0.x/$(lsb_release -sc)/ ./ \

| tee /etc/apt/sources.list.d/proxysql.list

Then it’s time to install ProxySQL:

apt-get update

apt-get install proxysql

Then we have to verify that we do have the connectivity from our ProxySQL instance to AWS Aurora nodes. We will use direct endpoints for the connectivity.

We can easily test the connectivity using telnet to the correct endpoint on port 3306:

root@ip-10-0-0-191:~# telnet dbtest-instance-1.cqb1vho43rod.eu-central-1.rds.amazonaws.com 3306

Trying 10.0.0.53...

Connected to dbtest-instance-1.cqb1vho43rod.eu-central-1.rds.amazonaws.com.

Escape character is '^]'.

J

5.7.12_2>ZWP-&[Ov8NzJ:H#Mmysql_native_password^CConnection closed by foreign host.

First one looks good. We’ll proceed with the second Aurora node:

root@ip-10-0-0-191:~# telnet dbtest-instance-1-eu-central-1a.cqb1vho43rod.eu-central-1.rds.amazonaws.com 3306

Trying 10.0.1.90...

Connected to dbtest-instance-1-eu-central-1a.cqb1vho43rod.eu-central-1.rds.amazonaws.com.

Escape character is '^]'.

J

tr3'3rynMmysql_native_password^CConnection closed by foreign host.

Works great too. If you cannot connect to Aurora nodes you need to ensure that all the security bits are aligned properly: check the VPC configuration, see if ProxySQL node can access VPC of Aurora, check if security groups allow the traffic to pass through. AWS network security layer can be tricky to configure if you don’t have the experience but finally you should be able to make it work.

Having the connectivity sorted out we will need to create a user on Aurora. We will use that user for monitoring Aurora nodes in ProxySQL. First, we may have to install MySQL client on ProxySQL node:

root@ip-10-0-0-191:~# apt install mysql-client-core-5.7

Then we will use the endpoint of the cluster to connect to the writer and create user on it:

root@ip-10-0-0-191:~# mysql -h dbtest.cluster-cqb1vho43rod.eu-central-1.rds.amazonaws.com -u root -ppassword

mysql> CREATE USER 'monuser'@'10.0.0.191' IDENTIFIED BY 'mon1t0r';

Query OK, 0 rows affected (0.02 sec)

mysql> GRANT REPLICATION CLIENT ON *.* TO 'monuser'@'10.0.0.191';

Query OK, 0 rows affected (0.00 sec)

Having this done we can log into ProxySQL admin interface (by default on port 6032) to define the monitor user and its password.

root@ip-10-0-0-191:~# mysql -P6032 -u admin -padmin -h127.0.0.1

mysql> SET mysql-monitor_username='monuser';

Query OK, 1 row affected (0.00 sec)


mysql> SET mysql-monitor_password='mon1t0r';

Query OK, 1 row affected (0.00 sec)

mysql> LOAD MYSQL VARIABLES TO RUNTIME;

Query OK, 0 rows affected (0.00 sec)

mysql> SAVE MYSQL VARIABLES TO DISK;

Query OK, 116 rows affected (0.00 sec)

Now it’s time to define Aurora nodes in ProxySQL:

mysql> INSERT INTO mysql_servers (hostgroup_id, hostname) VALUES (10, 'dbtest-instance-1.cqb1vho43rod.eu-central-1.rds.amazonaws.com'), (20, 'dbtest-instance-1-eu-central-1a.cqb1vho43rod.eu-central-1.rds.amazonaws.com');

Query OK, 2 rows affected (0.01 sec)

As you can see, we use their direct endpoints as the hostname. Once this is done, we will use mysql_replication_hostgroup table to define reader and writer hostgroups. We will also have to pass the correct check type - by default ProxySQL looks for ‘read_only’ variable while Aurora uses ‘innodb_read_only’ to differentiate between the writer and readers.

mysql> SHOW CREATE TABLE mysql_replication_hostgroups\G

*************************** 1. row ***************************

       table: mysql_replication_hostgroups

Create Table: CREATE TABLE mysql_replication_hostgroups (

    writer_hostgroup INT CHECK (writer_hostgroup>=0) NOT NULL PRIMARY KEY,

    reader_hostgroup INT NOT NULL CHECK (reader_hostgroup<>writer_hostgroup AND reader_hostgroup>=0),

    check_type VARCHAR CHECK (LOWER(check_type) IN ('read_only','innodb_read_only','super_read_only')) NOT NULL DEFAULT 'read_only',

    comment VARCHAR NOT NULL DEFAULT '', UNIQUE (reader_hostgroup))

1 row in set (0.00 sec)


mysql> INSERT INTO mysql_replication_hostgroups VALUES (10, 20, 'innodb_read_only', 'Aurora');

Query OK, 1 row affected (0.00 sec)

mysql> LOAD MYSQL SERVERS TO RUNTIME;

Query OK, 0 rows affected (0.00 sec)

This is it, we can now see how ProxySQL configured the nodes in runtime configuration:

mysql> SELECT hostgroup_id, hostname, port  FROM runtime_mysql_servers;

+--------------+-----------------------------------------------------------------------------+------+

| hostgroup_id | hostname                                                                    | port |

+--------------+-----------------------------------------------------------------------------+------+

| 10           | | 3306 |

| 20           | dbtest-instance-1-eu-central-1a.cqb1vho43rod.eu-central-1.rds.amazonaws.com | 3306 |

| 20           | dbtest-instance-1.cqb1vho43rod.eu-central-1.rds.amazonaws.com               | 3306 |

+--------------+-----------------------------------------------------------------------------+------+

3 rows in set (0.00 sec)

As you can see, dbtest-instance-1.cqb1vho43rod.eu-central-1.rds.amazonaws.com is the writer. Let’s try the failover now:

mysql> SELECT hostgroup_id, hostname, port  FROM runtime_mysql_servers;

+--------------+-----------------------------------------------------------------------------+------+

| hostgroup_id | hostname                                                                    | port |

+--------------+-----------------------------------------------------------------------------+------+

| 10           | dbtest-instance-1-eu-central-1a.cqb1vho43rod.eu-central-1.rds.amazonaws.com | 3306 |

| 20           | dbtest-instance-1-eu-central-1a.cqb1vho43rod.eu-central-1.rds.amazonaws.com | 3306 |

| 20           | dbtest-instance-1.cqb1vho43rod.eu-central-1.rds.amazonaws.com               | 3306 |

+--------------+-----------------------------------------------------------------------------+------+

3 rows in set (0.00 sec)

As you can see, writer (hostgroup 10) has changed to the second node.

Conclusion

This is basically it - as you can see setting up AWS Aurora nodes in ProxySQL is pretty much simple process.

A Guide to Automated Cloud Database Deployments

$
0
0

Complex, inflexible architectures, redundancy and out-of-date technology, are common problems for companies facing data to cloud migration. 

We look to the“clouds,” hoping that we will find there a magic solution to improve operational speed and performance, better workload and scalability, less prone and less complicated architectures. We hope to make our database administrator's life more comfortable. But is it really always a case? 

As more enterprises are moving to the cloud, the hybrid model is actually becoming more popular. The hybrid model is seen as a safe model for many businesses. 

In fact, it's challenging to do a heart transplant and port everything over immediately. Many companies are doing a slow migration that usually takes a year or even maybe forever until everything is migrated. The move should be made in an acceptable peace.

Unfortunately, hybrid means another puzzle piece that not necessary to reduce complexity. Perhaps as many others walking this road before you, you will find out that some of the applications will actually not move. 

Or you will find out that the other project team just decided to use yet another cloud provider. 

For instance, it is free, and relatively easy, to move any amount of data into an AWS EC2 instance, but you'll have to pay to transfer data out of AWS. The database services on Amazon are only available on Amazon. Vendor lock-in is there and should not be ignored.

Along the same lines, ClusterControl offers a suite of database automation and management functions to give you full control of your database infrastructure. On-prem, in the cloud and multiple vendors, support.

With ClusterControl, you can monitor, deploy, manage,  and scale your databases, securely and with ease through our point-and-click interface.

Utilizing the cloud enables your company and applications to profit from the cost-savings and versatility that originate with cloud computing.

Supported Cloud Platforms

ClusterControl allows you to run multiple databases on the top of the most popular cloud providers without being locked-in to any vendor. It has offered the ability to deploy databases (and backup databases) in the cloud since ClusterControl 1.6. 

The supported cloud platforms are Amazon AWS, Microsoft Azure and Google Cloud. It is possible to launch new instances and deploy MySQL, MariaDB, MongoDB, and PostgreSQL directly from the ClusterControl user interface. 

The recent ClusterControl version (1.7.4) added support for the MySQL Replication 8.0, PostgreSQL and TimescaleDB from Amazon AWS, Google Cloud Platform, and Microsoft Azure.

ClusterControl: Supported Platforms


Cloud Providers Configuration

Before we jump into our first deployment we need to connect ClusterControl with our cloud provider.
It’s done in the Integrations panel. 

ClusterControl- Cloud Credential Management

The tool will walk you through the Cloud integration with the straightforward wizard. As we can see in the below screenshot first, we start with one of the three big players Amazon Web Services (AWS), Google Cloud and Microsoft Azure.

ClusterControl -Supported Cloud Platforms

In the next section, we need to provide the necessary credentials.

ClusterControl - Set Credentials

When all is set and ClusterControl can talk with your cloud provider we can go to the deployment section.

ClusterControl: Deployment Options

Cloud Deployment Process

In this part, you want to select the supported cluster type, MySQL Galera Cluster, MongoDB Replica Set, or PostgreSQL Streaming Replication, TimescaleDB, MySQL Replication. 

The next move is to pick the supported vendor for the selected cluster type. At the moment, the following vendors and versions are:

  • MySQL Galera Cluster - Percona XtraDB Cluster 5.7, MariaDB 10.2, MariaDB 10.3

  • MySQL Replication Cluster - Percona Server 8.0, MariaDB Server 10.3, Oracle MySQL Server 8.0

  • MongoDB Replica Set - Percona Server for MongoDB 3.6, MongoDB 3.6, MongoDB 4.0

  • PostgreSQL Cluster - PostgreSQL 11.0

  • TimescaleDB 11.0

The deployment procedure is aware of the functionality and flexibility of the cloud environments, like the type of VM's dynamic IP and hostname allocation, NAT-ed public IP address, virtual private cloud network or storage.

In the following dialog:

ClusterControl - Deploy MySQL Replication Cluster
ClusterControl - Select Credential

Most of the settings in this step are dynamically populated from the cloud provider by the chosen credentials. You can configure the operating system, instance size, VPC setting, storage type, and size and also specify the SSH key location on the ClusterControl host. You can also let ClusterControl generate a new key specifically for these instances.

ClusterControl - Cloud Deployment, Select Virutal Machine

When all is set you will see your configuration. At this stage, you can also pick up additional subnet.

ClusterControl - Cloud Deployment Summary

 Verify if everything is correct and hit the "Deploy Cluster" button to start the deployment.

You can then monitor the progress by clicking on the Activity -> Jobs -> Create Cluster -> Full Job Details:

ClusterControl - Full Job Details

Depending on the cluster size, it could take 10 to 20 minutes to complete. Once done, you will see a new database cluster listed under the ClusterControl dashboard.

ClusterControl - New Cluster Added
ClusterControl - Topology

Under the hood, the deployment process did the following:

  • Create SSH key
  • Create cloud VM instances
  • Configure security groups and networking (firewalls, subnets)
  • Verify the SSH connectivity from ClusterControl to all created instances
  • Prepare VM’s for a specific type of cluster (VM node configuration like package installation, kernel configuration, etc)
  • Deploy a database on every instance
  • Configure the clustering or replication links
  • Register the deployment into ClusterControl

 After the deployment, you can review the process and see what exactly was executed. With the extended logging, you can see each command. You can see who triggered the job and what was the outcome.
If at any point you want to extend your cluster, you can use the scaling which is also integrated with your cloud provider.

The process is simple. In the first phase, you choose the desired VM type.

ClusterControl - Add Node

Finally, you can  choose the master node and remaining settings which depends on your cluster type:

ClusterControl - Add Node

Conclusion

We showed you how to set up your database MySQL Replication environment on Microsoft Azure, it only took a couple of clicks to build virtual machines, network, and finally a reliable master/slave replication cluster. With new scaling in the cloud functionality, you can also easily expand cluster whenever needed. 

This is just a first step if you want to see what to do next check out our other blogs where we talk about auto-recovery, backups, security and many other aspects of day to day administration with ClusterControl. Want to try it by yourself? Give it a try.

Automated Deployment of MySQL Galera Cluster to Amazon AWS with Puppet

$
0
0

Deployment and management your database environment can be a tedious task. It's very common nowadays to use tools for automating your deployment to make these tasks easier. Automation solutions such as Chef, Puppet, Ansible, or SaltStack are just some of the ways to achieve these goals.

This blog will show you how to use Puppet to deploy a Galera Cluster (specifically Percona XtraDB Cluster or PXC) utilizing ClusterControl Puppet Modules. This module makes the deployment, setup, and configuration easier than coding yourself from scratch. You may also want to check out one of our previous blogs about deploying a Galera Cluster using Chef,  “How to Automate Deployment of MySQL Galera Cluster Using S9S CLI and Chef.”

Our S9S CLI tools are designed to be used in the terminal (or console) and can be utilized to automatically deploy databases. In this blog, we'll show you how to do deploy a Percona XtraDB Cluster on AWS using Puppet, using ClusterControl and its s9s CLI tools to help automate the job.

Installation and Setup  For The Puppet Master and Agent Nodes

On this blog, I used Ubuntu 16.04 Xenial as the target Linux OS for this setup. It might be an old OS version for you, but we know it works with RHEL/CentOS and Debian/Ubuntu recent versions of the OS. I have two nodes that I used on this setup locally with the following host/IP:

Master Hosts:

     IP = 192.168.40.200

     Hostname = master.puppet.local

Agent Hosts:

     IP = 192.168.40.20

     Hostname = clustercontrol.puppet.local

Let's go over through the steps.

1) Setup the Master

## Install the packages required

wget https://apt.puppetlabs.com/puppet6-release-xenial.deb

sudo dpkg -i puppet6-release-xenial.deb

sudo apt update

sudo apt install -y puppetserver

## Now, let's do some minor configuration for Puppet

sudo vi /etc/default/puppetserver

## edit from 

JAVA_ARGS="-Xms2g -Xmx2g -Djruby.logger.class=com.puppetlabs.jruby_utils.jruby.Slf4jLogger"

## to

JAVA_ARGS="-Xms512m -Xmx512m -Djruby.logger.class=com.puppetlabs.jruby_utils.jruby.Slf4jLogger"

## add alias hostnames in /etc/hosts

sudo vi /etc/hosts

## and add

192.168.40.10 client.puppet.local

192.168.40.200 server.puppet.local

## edit the config for server settings.

sudo vi /etc/puppetlabs/puppet/puppet.conf

## This can be depending on your setup so you might approach it differently than below. 

[master]

vardir = /opt/puppetlabs/server/data/puppetserver

logdir = /var/log/puppetlabs/puppetserver

rundir = /var/run/puppetlabs/puppetserver

pidfile = /var/run/puppetlabs/puppetserver/puppetserver.pid

codedir = /etc/puppetlabs/code


dns_alt_names = master.puppet.local,master


[main]

certname = master.puppet.local

server = master.puppet.local 

environment = production

runinterval = 15m

## Generate a root and intermediate signing CA for Puppet Server

sudo /opt/puppetlabs/bin/puppetserver ca setup

## start puppet server

sudo systemctl start puppetserver

sudo systemctl enable puppetserver

2) Setup the Agent/Client Node

## Install the packages required

wget https://apt.puppetlabs.com/puppet6-release-xenial.deb

sudo dpkg -i puppet6-release-xenial.deb

sudo apt update

sudo apt install -y puppet-agent

## Edit the config settings for puppet client

sudo vi /etc/puppetlabs/puppet/puppet.conf

And add the example configuration below,

[main]

certname = clustercontrol.puppet.local

server = master.puppet.local

environment = production

runinterval = 15m

3) Authenticating (or Signing the Certificate Request) for Master/Client Communication

## Go back to the master node and run the following to view the view outstanding requests.                 

sudo /opt/puppetlabs/bin/puppetserver ca list

## The Result

Requested Certificates:

    clustercontrol.puppet.local   (SHA256) 0C:BA:9D:A8:55:75:30:27:31:05:6D:F1:8C:CD:EE:D7:1F:3C:0D:D8:BD:D3:68:F3:DA:84:F1:DE:FC:CD:9A:E1

## sign a request from agent/client

sudo /opt/puppetlabs/bin/puppetserver ca sign --certname clustercontrol.puppet.local

## The Result

Successfully signed certificate request for clustercontrol.puppet.local

## or you can also sign all request

sudo /opt/puppetlabs/bin/puppetserver ca sign --all

## in case you want to revoke, just do

sudo /opt/puppetlabs/bin/puppetserver ca revoke --certname <AGENT_NAME>

## to list all unsigned,

sudo /opt/puppetlabs/bin/puppetserver ca list --all

## Then verify or test in the client node,

## verify/test puppet agent

sudo /opt/puppetlabs/bin/puppet agent --test

Scripting Your Puppet Manifests and Setting up the ClusterControl Puppet Module

Our ClusterControl Puppet module can be downloaded here https://github.com/severalnines/puppet. Otherwise, you can also easily grab the Puppet Module from Puppet-Forge. We're regularly updating and modifying the Puppet Module, so we suggest you grab the github copy to ensure the most up-to-date version of the script. 

You should also take into account that our Puppet Module is tested on CentOS/Ubuntu running with the most updated version of Puppet (6.7.x.). For this blog, the Puppet Module is tailored to work with the most recent release of ClusterControl (which as of this writing is 1.7.3). In case you missed it, you can check out our releases and patch releases over here.

1) Setup the ClusterControl Module in the Master Node

# Download from github and move the file to the module location of Puppet:

wget https://github.com/severalnines/puppet/archive/master.zip -O clustercontrol.zip; unzip -x clustercontrol.zip; mv puppet-master /etc/puppetlabs/code/environments/production/modules/clustercontrol

2) Create Your Manifest File and Add the Contents as Shown Below

vi /etc/puppetlabs/code/environments/production/manifests/site.pp

Now, before we proceed, we need to discuss the manifest script and the command to be executed. First, we'll have to define the type of ClusterControl and its variables we need to provide. ClusterControl requires every setup to have token and SSH keys be specified and provided  accordingly. Hence, this can be done by running the following command below:

## Generate the key

bash /etc/puppetlabs/code/environments/production/modules/clustercontrol/files/s9s_helper.sh --generate-key

## Then, generate the token

bash /etc/puppetlabs/code/environments/production/modules/clustercontrol/files/s9s_helper.sh --generate-token

Now, let's discuss what we'll have to input within the manifest file one by one.

node 'clustercontrol.puppet.local' { # Applies only to mentioned node. If nothing mentioned, applies to all.

        class { 'clustercontrol':

            is_controller => true,

ip_address => '<ip-address-of-your-cluster-control-hosts>',

mysql_cmon_password => '<your-desired-cmon-password>',

                  api_token => '<api-token-generated-earlier>'

        }

Now, we'll have to define the <ip-address-of-your-cluster-control-hosts> of your ClusterControl node where it's actually the clustercontrol.puppet.local in this example. Specify also the cmon password and then place the API token as generated by the command mentioned earlier.

Afterwards, we'll use ClusterControlRPC to send a POST request to create an AWS entry:

exec { 'add-aws-credentials':

            path  => ['/usr/bin', '/usr/sbin', '/bin'],  

    command => "echo '{\"operation\" : \"add_credentials\", \"provider\" : aws, \"name\" : \"<your-aws-credentials-name>\", \"comment\" : \"<optional-comment-about-credential-entry>\", \"credentials\":{\"access_key_id\":\"<aws-access-key-id>\",\"access_key_secret\" : \"<aws-key-secret>\",\"access_key_region\" : \"<aws-region>\"}}'  | curl -sX POST -H\"Content-Type: application/json\" -d @- http://localhost:9500/0/cloud"

}

The placeholder variables I set are self-explanatory. You need to provide the desired credential name for your AWS, provide a comment if you wanted to, provided the AWS access key id, your AWS key secret and AWS region where you'll be deploying the Galera nodes.

Lastly, we'll have to run the command using s9s CLI tools.

exec { 's9s':

  path        => ['/usr/bin', '/usr/sbin', '/bin'],

  onlyif      => "test -f $(/usr/bin/s9s cluster --list --cluster-format='%I' --cluster-name '<cluster-name>' 2> /dev/null) > 0 ", 

  command     => "/usr/bin/s9s cluster --create --cloud=aws --vendor percona --provider-version 5.7  --containers=<node1>,<node2>,<node3> --nodes=<node1>,<node2>,<node3> --cluster-name=<cluster-name> --cluster-type=<cluster-type> --image <aws-image> --template <aws-instance-type> --subnet-id <aws-subnet-id> --region <aws-region> --image-os-user=<image-os-user> --os-user=<os-user> --os-key-file <path-to-rsa-key-file> --vpc-id <aws-vpc-id> --firewalls <aws-firewall-id> --db-admin <db-user> --db-admin-passwd <db-password> --wait --log",

  timeout     => 3600,

  logoutput   => true

}

Let’s look at the key-points of this command. First, the "onlyif" is defined by a conditional check to determine if such cluster name exists, then do not run since it's already added in the cluster. We'll proceed on running the command which utilizes the S9S CLI Tools. You'll need to specify the AWS IDs in the placeholder variables being set. Since the placeholder names are self-explanatory, its values will be taken from your AWS Console or by using the AWS CLI tools.

Now, let's check the succeeding steps remaining.

3) Prepare the Script for Your Manifest File

# Copy the example contents below (edit according to your desired values) and paste it to the manifest file, which is the site.pp.

node 'clustercontrol.puppet.local' { # Applies only to mentioned node. If nothing mentioned, applies to all.

        class { 'clustercontrol':

is_controller => true,

ip_address => '192.168.40.20',

mysql_cmon_password => 'R00tP@55',

mysql_server_addresses => '192.168.40.30,192.168.40.40',

api_token => '0997472ab7de9bbf89c1183f960ba141b3deb37c'

        }


exec { 'add-aws-credentials':

path  => ['/usr/bin', '/usr/sbin', '/bin'],  

command => "echo '{\"operation\" : \"add_credentials\", \"provider\" : aws, \"name\" : \"paul-aws-sg\", \"comment\" : \"my SG AWS Connection\", \"credentials\":{\"access_key_id\":\"XXXXXXXXXXX\",\"access_key_secret\" : \"XXXXXXXXXXXXXXX\",\"access_key_region\" : \"ap-southeast-1\"}}'  | curl -sX POST -H\"Content-Type: application/json\" -d @- http://localhost:9500/0/cloud"

}


exec { 's9s':

path        => ['/usr/bin', '/usr/sbin', '/bin'],

onlyif      => "test -f $(/usr/bin/s9s cluster --list --cluster-format='%I' --cluster-name 'cli-aws-repl' 2> /dev/null) > 0 ", 

command     => "/usr/bin/s9s cluster --create --cloud=aws --vendor percona --provider-version 5.7  --containers=db1,db2,db3 --nodes=db1,db2,db3 --cluster-name=cli-aws-repl --cluster-type=galera --image ubuntu18.04 --template t2.small --subnet-id subnet-xxxxxxxxx  --region ap-southeast-1 --image-os-user=s9s --os-user=s9s --os-key-file /home/vagrant/.ssh/id_rsa --vpc-id vpc-xxxxxxx --firewalls sg-xxxxxxxxx --db-admin root --db-admin-passwd R00tP@55 --wait --log",

timeout     => 3600,

logoutput   => true

}

}

Let's Do the Test and Run Within the Agent Node

/opt/puppetlabs/bin/puppet agent --test  

The End Product

Now, let's have a look once the agent is being ran. Once you have this running, visiting the URLhttp://<cluster-control-host>/clustercontrol, you'll be asked by ClusterControl to register first. 

Now, you wonder where's the result after we had run the RPC request with resource name 'add-aws-credentials'in our manifest file, it'll be found in the Integrations section within the ClusterControl.  Let's see how it looks like after the Puppet perform the runbook.

You can modify this in accordance to your like through the UI but you can also modify this by using our RPC API. 

Now, let's check the cluster,

From the UI view, it shows that it has been able to create the cluster, display the cluster in the dashboard, and also shows the job activities that were performed in the background.

Lastly, our AWS nodes are already present now in our AWS Console. Let's check that out,

All nodes are running healthy and are expected to its designated names and region.

Conclusion

In this blog, we are able to deploy a Galera/Percona Xtradb Cluster using automation with Puppet. We did not create the code from scratch, nor did we use any external tools that would have complicated the task. Instead, we used the CusterControl Module and the S9S CLI tool to build and deploy a highly available Galera Cluster.

An Overview of MongoDB Atlas: Part One

$
0
0

The cloud computing approach addresses some of the challenges associated with running data processing systems. Data-driven companies are pushing out rapid business transformation with cloud services, and many see cloud services as a substantial enhancement in automation, reliability, and on-demand scaling than the traditional infrastructure models which came before. The on-demand nature of the Software-as-a-Service (SaaS) paradigm means organizations can buy what they need, when they need it. Of course, the cost and cost-effective aspects are crucial, but not the only ones.

In the design on system architectures, we are always looking for the systems which fits the right number of users, at the right level of performance for each. We want to avoid performance issues & bottlenecks, and if those issues happen, we want a system which adapts to the changing demand. 

We also want things faster. The agile development process is getting more and more popular; mainly because it accelerates the delivery of initial business value and (through a process of continuous planning and feedback) it can ensure that the ROI is maximized

Lastly, we want a reduction in complexity. A key feature of MongoDB is its built-in redundancy. If you have two or more data nodes, they can be configured as a replica set or mongodb shards. Without proper automation in place, it can be a recurring task for several teams (network, storage, OS, etc.). Cloud automation can help you to reduce dependencies between the various groups in your organization. For example, you may not need to involve the network team when you create a new database system. 

Cloud automation not only saves time and money but also make your organization more competitive in the challenging market. 

In this blog, we will take a look at Atlas, the solution from MongoDB that tries to address all of these problems.

Getting Started with MongoDB Atlas

To start with MongoDB Atlas go to https://cloud.mongodb.com. In the registration form, you need to provide bare minimum information like email, company, country, and mobile number. 

MongoDB Atlas

MongoDB Atlas does an excellent job in infrastructure provisioning, setup. The whole process uses a dynamic web interface that walks you through various deployment options. It's easy, intuitive and doesn't require specialized knowledge.

Creating a New Cluster in MongoDB Atlas

After the first login, you will be asked to build your first cluster in one of the three most significant clouds. Atlas works with Amazon AWS, Google Cloud, and Microsoft Azure.  Based on your choice, you can pick up the location of the preferred data center location. To increase availability, you can set Multi-Region, Workload Isolation, or set various Replication options. Each Atlas project supports up to 25 clusters, but after the contact with the support, you should be able to host more.

M0 Cluster in MongoDB Atlas

You need to select the appropriate size of the server, coupled with IO and storage capacity. In this article, we will use the free version. It is free to start with MongoDB Atlas for prototyping, early development or to learn. The credit card is not needed, so you don't need to bother about hidden costs. The free edition called M0 Sandbox is limited to:

  • 512MB storage
  • vCPU shared
  • RAM shared
  • 100 max connections
  • There is a limit of one M0 cluster per project.

For dedicated clusters, MongoDB Atlas is billed hourly based on how much you use. The rate depends on a number of factors, most importantly, the size and number of servers you use. The price starts with 0.08/hr (M10, 2GB RAM, 10GB storage, 1vCPU) to M700 with 768GB RAM, 4096 GB storage, 96vCPUs from $33.26/hr.  Obviously, you would need to include other cost factors like, for example, the cost of backups.

According to MongoDB calculations, an AWS a 3-node replica set of M40s and run it 24/7 for one month using the included 80GB of standard block storage would cost you around $947.

The basic setup works with replication. If you need sharding M30 instance type is a minimum (8GB RAM, 40GB storage, 2vCPUs, price from $0.54/hr). 

MongoDB Atlas Network Access Initial Setup

One of the first steps we need to do after the cluster creation is to enable an IP whitelist. To enable access from everywhere you can set whitelist entry to 0.0.0.0/0 but it’s not recommended. If you don’t know your IP address Atlas will help you to identify it. 

MongoDB Atlas, Network Access

To keep your connection more secure you can also set up a network peering connection. This feature is not available for M0, M2, and M5 clusters. Network peering allows connectivity between MongoDB VPC and your cloud provider. Peer VPC network allows different VOC ti to communicate in private space, traffic doesn't traverse the public internet. 

To start working with your new cluster create an initial user. Do it in the Database Access tab. MongoDB uses Salted Challenge Response Authentication Mechanism. It’s a security mechanism based on SHA-256, user credentials against the user’s name, password and authentication database. 

MongoDB Atlas, Add new user

Migration of Existing MongoDB Cluster to MongoDB Atlas

There is also a possibility to migrate your existing on-prem cluster to Mongo Atlas. It's done via a dedicated service called Live Migration Service. Atlas Live Migration process streams data through a MongoDB-controlled application server. 

Live migration works by keeping a cluster in MongoDB Atlas in sync with your source database. During this process, your application can continue to read and write from your source database. Since the process watches upcoming changes, all will be replicated, and migration can be done online. You decide when to change the application connection setting and do cutover. To do the process less prone Atlas provides Validate option which checks whitelist IP access, SSL configuration, CA, etc.

What’s important here is the service is free of charge.

If you don't need online migration, you can also use mongoimport. Use mongo shell with minimum version 3.2.7 always use SSL. You can get test data from here.

​mongoimport --host TestCluster-shard-0/testcluster-shard-*****.azure.mongodb.net:27017,testcluster-shard-****.azure.mongodb.net:27017,testcluster-shard-******.azure.mongodb.net:27017 --ssl --username admin --authenticationDatabase admin  --type JSON --file city_inspections.json

2019-08-15T21:53:09.921+0200 WARNING: ignoring unsupported URI parameter 'replicaset'

2019-08-15T21:53:09.922+0200 no collection specified

2019-08-15T21:53:09.922+0200 using filename 'city_inspections' as collection

Enter password:


2019-08-15T21:53:14.288+0200 connected to: mongodb://testcluster-shard-*****.azure.mongodb.net:27017,testcluster-shard-*****.azure.mongodb.net:27017,testcluster-shard-*****.azure.mongodb.net:27017/?replicaSet=TestCluster-shard-0

2019-08-15T21:53:17.289+0200 [........................] test.city_inspections 589KB/23.2MB (2.5%)

2019-08-15T21:53:20.290+0200 [#.......................] test.city_inspections 1.43MB/23.2MB (6.2%)

2019-08-15T21:53:23.292+0200 [##......................] test.city_inspections 2.01MB/23.2MB (8.6%)

...

2019-08-15T21:55:09.140+0200 [########################] test.city_inspections 23.2MB/23.2MB (100.0%)

2019-08-15T21:55:09.140+0200 81047 document(s) imported successfully. 0 document(s) failed to import.

To check data, login with mongo shell.

mongo "mongodb+srv://testcluster-*****.azure.mongodb.net/test" --username admin

MongoDB shell version v4.2.0

Enter password:

connecting to: mongodb://testcluster-shard-00-00-*****.azure.mongodb.net:27017,testcluster-shard-00-02-*****.azure.mongodb.net:27017,testcluster-shard-00-01-*****.azure.mongodb.net:27017/test?authSource=admin&compressors=disabled&gssapiServiceName=mongodb&replicaSet=TestCluster-shard-0&ssl=true

2019-08-15T22:15:58.068+0200 I  NETWORK [js] Starting new replica set monitor for TestCluster-shard-0/testcluster-shard-00-00-*****.azure.mongodb.net:27017,testcluster-shard-00-02-*****.azure.mongodb.net:27017,testcluster-shard-00-01-*****.azure.mongodb.net:27017

2019-08-15T22:15:58.069+0200 I  CONNPOOL [ReplicaSetMonitor-TaskExecutor] Connecting to testcluster-shard-00-01-*****.azure.mongodb.net:27017

2019-08-15T22:15:58.070+0200 I  CONNPOOL [ReplicaSetMonitor-TaskExecutor] Connecting to testcluster-shard-00-00-*****.azure.mongodb.net:27017

2019-08-15T22:15:58.070+0200 I  CONNPOOL [ReplicaSetMonitor-TaskExecutor] Connecting to testcluster-shard-00-02-*****.azure.mongodb.net:27017

2019-08-15T22:15:58.801+0200 I  NETWORK [ReplicaSetMonitor-TaskExecutor] Confirmed replica set for TestCluster-shard-0 is TestCluster-shard-0/testcluster-shard-00-00-*****.azure.mongodb.net:27017,testcluster-shard-00-01-*****.azure.mongodb.net:27017,testcluster-shard-00-02-*****.azure.mongodb.net:27017

Implicit session: session { "id" : UUID("6a5d1ee6-064b-4ba8-881a-71aa4aef4983") }

MongoDB server version: 4.0.12

WARNING: shell and server versions do not match

MongoDB Enterprise TestCluster-shard-0:PRIMARY> show collections;

city_inspections

MongoDB Enterprise TestCluster-shard-0:PRIMARY> db.city_inspections.find();

{ "_id" : ObjectId("56d61033a378eccde8a83557"), "id" : "10284-2015-ENFO", "certificate_number" : 9287088, "business_name" : "VYACHESLAV KANDZHANOV", "date" : "Feb 25 2015", "result" : "No Violation Issued", "sector" : "Misc Non-Food Retail - 817", "address" : { "city" : "NEW YORK", "zip" : 10030, "street" : "FREDRCK D BLVD", "number" : 2655 } }

{ "_id" : ObjectId("56d61033a378eccde8a83559"), "id" : "10302-2015-ENFO", "certificate_number" : 9287089, "business_name" : "NYC CANDY STORE SHOP CORP", "date" : "Feb 25 2015", "result" : "No Violation Issued", "sector" : "Cigarette Retail Dealer - 127", "address" : { "city" : "NEW YORK", "zip" : 10030, "street" : "FREDRCK D BLVD", "number" : 2653 } }

...

{ "_id" : ObjectId("56d61033a378eccde8a8355e"), "id" : "10391-2015-ENFO", "certificate_number" : 3019415, "business_name" : "WILFREDO DELIVERY SERVICE INC", "date" : "Feb 26 2015", "result" : "Fail", "sector" : "Fuel Oil Dealer - 814", "address" : { "city" : "WADING RIVER", "zip" : 11792, "street" : "WADING RIVER MANOR RD", "number" : 1607 } }

Type "it" for more

MongoDB Enterprise TestCluster-shard-0:PRIMARY>

Conclusion

That’s all for part one. In the next article, we are going to cover monitoring, backups, day to day administration and MongoDB’s new service for building Data Lakes. Stay tuned!

A Guide to MySQL Galera Cluster Restoration Using mysqldump

$
0
0

Using logical backup programs like mysqldump is a common practice performed by MySQL admins for backup and restore (the process of moving a database from one server to another) and is also the most efficient way to perform a  database mass modification using a single text file. 

When doing this for MySQL Galera Cluster, however, the same rules apply except for the fact that it takes a lot of time to restore a dump file into a running Galera Cluster. In this blog, we will look at the best way to restore a Galera Cluster using mysqldump.

Galera Cluster Restoration Performance

One of the most common misconceptions about Galera Cluster is that restoring a database into a three-node cluster is faster than doing it to a standalone node. This is definitely incorrect when talking about a stateful service, like datastore and filesystem. To keep in sync, every member has to keep up with whatever changes happened with the other members. This is where locking, certifying, applying, rollbacking, committing are forced to be involved into the picture to ensure no data loss along the process, because for a database service, data loss is a big no-no.

Let's make some comparisons to see and understand the impact. Suppose we have a 2 GB of dump file for database 'sbtest'. We usually would load the data into the cluster via two endpoints:

  • load balancer host 
  • one of the database hosts

As for control measurement, we are also going to restore on a standalone node. Variable pxc_strict_mode is set to PERMISSIVE on all Galera nodes.

The backup was created on one of the Galera nodes with the following command:

$ mysqldump --single-transaction sbtest > sbtest.sql

We are going to use 'pv' to observe the progress and measure the restoration performance. Thus, the restore command is:

$ pv sbtest.sql | mysql -uroot -p sbtest

The restorations were repeated 3 times for each host type as shown in the following table:

Endpoint Type

Database Server

Restoration Time

(seconds)

Restoration Speed

(MiB/s)

Standalone

MySQL 5.7.25

3m 29s

3m 36s

3m 31s

8.73

8.44

8.64

Load

Balancer

HAProxy -> PXC 5.7.25 (multiple DB hosts - all active, leastconn)

5m 45s

6m 03s

5m 43s

5.29

5.02

5.43

ProxySQL -> PXC 5.7.25

(single DB host - single writer hostgroup)

6m 07s

7m 00s

6m 54s

4.97

4.34

4.41

Galera

Cluster

PXC 5.7.25

(single DB host)

5m 22s

6m 00s

5m 28s

5.66

5.07

5.56


Note that the way pv measures the restoration speed is based on the mysqldump text file that is being passed through it through pipe. It's not highly accurate but good enough to give us some measurements to compare. All hosts are having the same specs and running as a virtual machine on the same underlying physical hardware.

The following column chart summarizes the average time it takes to restore the mysqldump:

Standalone host is the clear winner with 212 seconds, while ProxySQL is the worst for this workload; almost two-times slower if compared to standalone.

The following column chart summarizes the average speed pv measures when restoring the mysqldump:

As expected, restoration on the standalone note is way faster with 8.6 MiB/s on average, 1.5x better than restoration directly on the Galera node.

To summarize our observation, restoring directly on a Galera Cluster node is way slower than a standalone host. Restoring through a load balancer is even worse.

Turning Off Galera Replication

Running mysqldump on a Galera Cluster will cause every single DML statement (INSERTs in this case) being broadcasted, certified and applied by Galera nodes through its group communication and replication library. Thus, the fastest way to restore a mysqldump is to perform the restoration on a single node, with Galera Replication turned off, kind of making it running like a standalone mode. The steps are:

  1. Pick one Galera node as the restore node. Stop the rest of the nodes.
  2. Turn off Galera Replication on the restore node.
  3. Perform the restoration.
  4. Stop and bootstrap the restore node.
  5. Force the remaining node to re-join and re-sync via SST.

For example, let's say we choose db1 to be the restore node. Stop the other nodes (db2 and db3) one node at a time so the nodes would leave the cluster gracefully:

$ systemctl stop mysql #db2

$ systemctl stop mysql #db3

Note: For ClusterControl users, simply go to Nodes -> pick the DB node -> Node Actions -> Stop Node. Do not forget to turn off ClusterControl automatic recovery for cluster and nodes before performing this exercise.

Now, login to db1 and turn the Galera node into a standalone node by setting wsrep_provider variable to 'none':

$ mysql -uroot -p

mysql> SET GLOBAL wsrep_provider = 'none';

mysql> SHOW STATUS LIKE 'wsrep_connected';

+-----------------+-------+

| Variable_name   | Value |

+-----------------+-------+

| wsrep_connected | OFF   |

+-----------------+-------+

Then perform the restoration on db1:

$ pv sbtest.sql | mysql -uroot -p sbtest

1.78GiB 0:02:46 [  11MiB/s] [==========================================>] 100%

The restoration time has improved 2x to 166 seconds (down from ~337 seconds) with 11MiB/s (up from ~5.43MiB/s). Since this node is now has the most updated data, we have to bootstrap the cluster based on this node and let the other nodes rejoin the cluster and force to re-syncing everything back. 

On db1, stop the MySQL service and start it again in bootstrap mode:

$ systemctl status mysql #check whether mysql or mysql@bootstrap is running

$ systemctl status mysql@bootstrap #check whether mysql or mysql@bootstrap is running

$ systemctl stop mysql # if mysql was running

$ systemctl stop mysql@bootstrap # if mysql@bootstrap was running

$ systemctl start mysql@bootstrap

While on every remaining node, wipe out the datadir (or you can just simply delete grastate.dat file) and start the MySQL service:

$ rm /var/lib/mysql/grastate.dat  # remove this file to force SST

$ systemctl start mysql

Do perform the start up process one node at a time. Once the working node is synced, proceed with the next node and so on.

Note: For ClusterControl users, you could skip the above step because ClusterControl can be configured to force SST during the bootstrap process. Just click on the Cluster Actions -> Bootstrap Cluster and pick the db1 as the bootstrap node and toggle on the option for "Clear MySQL Datadir on Joining nodes", as shown below:

We could also juice up the restoration process by allowing bigger packet size for the mysql client:

$ pv sbtest.sql | mysql -uroot -p --max_allowed_packet=2G sbtest

At this point, our cluster should be running with the restored data. Take note that in this test case, the total restoration time for the cluster is actually longer than if we performed the restoration directly on the Galera node thanks to our small dataset. If you have a huge mysqldump file to restore, believe us, this is one of the best ways you should do.

That's it for now. Happy restoring!


Running PostgreSQL Using Amazon RDS

$
0
0

Cloud computing is now commonplace in most companies. It allows for on demand availability of compute power, database, storage, applications, and other resources via the internet. 

The main advantages behind the cloud are that you don’t need to spend a lot of money to buy powerful servers or build your own data centers. But this is not the only advantage, when you need to scale you don’t need to buy a new server you can just add resources with a few clicks. In a similar way, we can also decrease the number of resources when they aren’t needed to reduce costs.

A cloud database is a database running on a cloud provider. It allows us to store, manage, retrieve, and manipulate our data via a cloud platform; accessible over the internet. 

In this blog, we’ll look at the different types of cloud offerings and then focus in on running a  PostgreSQL  database using Amazon RDS

Cloud Service Offerings & Options

Cloud Service Offerings & Options

As we can see in the image above, there are several different kinds of cloud services depending on the level of access needed.

  • On-prem: It’s installed and runs on computers on the premises of the person or organization using the system. In fact, this is not a cloud service, but it’s useful to see the difference.
  • IaaS: It’s an online service that provides high-level APIs used to access various low-level details of underlying network infrastructure like physical computing resources, location, data partitioning, scaling, security, backup, etc.
  • PaaS:It provides a platform allowing customers to develop, run, and manage applications without the complexity of building and maintaining the infrastructure associated with developing and launching an app.
  • SaaS: It’s accessed by users over the Internet using a client (browser). It doesn’t require any installation on the client side.

If we’re talking about PostgreSQL, there are cloud providers that offer PostgreSQL in the cloud; in different flavors and using different methods. As we mentioned above, we’re going to focus on Amazon RDS.

What is Amazon RDS (Relational Database Service)?

According to the Amazon web site, they offer over 165 fully featured services, including over 40 services that aren’t available anywhere else. So, AWS is probably the world’s most advanced cloud provider in terms of features and services with millions of customers.

Amazon RDS allows us to create, manage and scale a relational database in the cloud in an easy and fast way, and it’s available on different database types like Amazon Aurora, PostgreSQL, MySQL and more. AWS provides a tool called AWS Database Migration Service to migrate an existing database to Amazon RDS.

Benefits of Amazon RDS

  • Easy to use: We can use the Amazon RDS Management Console, the AWS RDS Command-Line Interface, or API calls to access the relational database. We don’t need infrastructure provisioning or installing and maintaining database software.
  • Scalable: We can scale our database's compute and storage resources with only a few clicks. Many Amazon RDS engine types allow us to launch one or more Read Replicas to offload read traffic from our primary database instance.
  • Availability: When we provision a Multi-AZ DB Instance, Amazon RDS synchronously replicates the data to a standby instance in a different Availability Zone (AZ). Amazon RDS has many other features that enhance reliability for critical production databases, including automated backups, database snapshots, and automatic host replacement.
  • Performance: We can choose between two SSD-backed storage options: one optimized for high-performance OLTP applications, and the other for cost-effective general-purpose use. 
  • Secure: Amazon RDS lets us run the database instances in Amazon VPC (Virtual Private Cloud), which allows us to isolate our database instances and to connect to our existing IT infrastructure through a VPN. Also, many Amazon RDS engine types offer encryption at rest and encryption in transit.

While this is not officially mentioned on the AWS web site, but if we consider DBaaS (Database as a Service) as a database service which is managed and deployed in the outside provider’s infrastructure (according to our list in the section above) we can say that Amazon RDS is a “kind-of” DBaaS, somewhere between a PaaS and a SaaS service.

A Guide to PostgreSQL on Amazon RDS

First, we need to login the AWS console. (If you don’t have an AWS account, you can create a free one here.)

Then, go to Services -> Database -> RDS and Create database section.

Create Database on Amazon RDS

Now, we must choose if we want to follow the normal or easy creation, the engine, and version that we’ll deploy. 

Choose a Database to Deploy on Amazon RDS

If we select the easy creation, we only need to add the database instance name, user and password.

Database Configuration Amazon RDS
In this case, we’ll choose PostgreSQL 10 and the normal creation to be able to see the creation details, so this will require a bit more work than the easy one.

In this case, we’ll choose PostgreSQL 10 and the normal creation to be able to see the creation details, so this will require a bit more work than the easy one.

In the normal creation, first, we’ll choose a template, it could be Production, Dev/Test or Free tier option.

Database Tiers Amazon RDS

In the next step, we’ll add the database instance name, user, and password.

Database Config Details Amazon RDS

The next step is the database instance size where we have several options in three different categories: Standard classes, Memory Optimized classes, and Burstable classes.

Database Instance Size Amazon RDS

In the storage section, we can select the disk type, size, and storage behavior.

Database Storage Options Amazon RDS

One of the most important AWS features is the Multi-AZ deployment, where we can create a standby instance in a different availability zone to provide redundancy.

Availability & Durability Options Amazon RDS

About the connectivity, we can choose a Virtual Private Cloud (VPC) to connect the new database. Here, we can select additional options like public access, availability zone, and database port.

Connectivity Options Amazon rDS

Then, we have additional configuration where we can specify the database name, database authentication, backups details, encryption, monitoring, logging, and maintenance service (auto minor upgrades).

Finally, we’ll have the option to check the Estimated Monthly Costs.


Estimated Costs Screen Amazon RDS

We can see more details about the costs here, or even use the AWS Monthly Calculator.

After adding all this information, we must wait until the creation process finishes.

Amazon RDS Creation Process

When the Status changes to “Available”, our database instance is ready to use.

If we press on the DB identifier (“pg1” in our example), we’ll access our database section, where we can see a summary with information like CPU usage, connections, status, and type. Here, we can also modify our instance configuration or perform different actions like reboot, delete, create read replica, take snapshots, and even more.

Database Identifier Amazon RDS

In the same place, we can also see more detailed information in different sections. 

Connectivity and Security

We can configure the security rules and check the network information.

Connectivity & Security Amazon RDS

Monitoring

We have some metrics to check our database status.

Database Monitoring CloudWatch Amazon RDS

Logs and Events 

We have alarms, events, and logs from our database.

Amazon RDS CloudWatch Alarms

Configuration 

We can see our instance configuration, but also a list of recommendations to improve it, like enable enhanced monitoring.

Instance Details Amazon RDS

Maintenance and Backups 

We can see information about the maintenance tasks, backups, and snapshot process.

Maintenance and Backups Amazon RDS

Now, we should be able to access our database by using the Endpoint name assigned by AWS (“pg1.cibqq2gl0qof.us-east-1.rds.amazonaws.com” in our example). For this, make sure you allowed access from the security group section and you enabled the public access from the instance configuration (Public accessibility: Yes). In our example, we’re allowing all the traffic from all the sources, but for security reason, you’ll probably want to limit the access from one or a few sources.

Edit Inbound Rules Amazon RDS

Now, let’s try to connect to our Amazon RDS instance from the command line:

[root@local ~]# psql -U postgres -h pg1.cibqq2gl0qof.us-east-1.rds.amazonaws.com

Password for user postgres:

psql (11.5, server 10.6)

SSL connection (protocol: TLSv1.2, cipher: ECDHE-RSA-AES256-GCM-SHA384, bits: 256, compression: off)

Type "help" for help.


postgres=> \l

                                  List of databases

   Name    | Owner   | Encoding |   Collate | Ctype    | Access privileges

-----------+----------+----------+-------------+-------------+-----------------------

 postgres  | postgres | UTF8     | en_US.UTF-8 | en_US.UTF-8 |

 rdsadmin  | rdsadmin | UTF8     | en_US.UTF-8 | en_US.UTF-8 | rdsadmin=CTc/rdsadmin

 template0 | rdsadmin | UTF8     | en_US.UTF-8 | en_US.UTF-8 | =c/rdsadmin          +

           |          | |             | | rdsadmin=CTc/rdsadmin

 template1 | postgres | UTF8     | en_US.UTF-8 | en_US.UTF-8 | =c/postgres          +

           |          | |             | | postgres=CTc/postgres

(4 rows)


postgres=> select version();

                                                version

--------------------------------------------------------------------------------------------------------

 PostgreSQL 10.6 on x86_64-pc-linux-gnu, compiled by gcc (GCC) 4.8.3 20140911 (Red Hat 4.8.3-9), 64-bit

(1 row)

In the same way, we can connect to it from our preferred GUI (if we have one).

pgAdmin Amazon RDS

A Note on Amazon Aurora

Amazon Aurora is a MySQL and PostgreSQL compatible relational database built for the cloud. According to the AWS web site, Amazon Aurora is three times faster than standard PostgreSQL databases and provides the security, availability, and reliability of commercial databases at 1/10th the cost. Regardless of the claim, this is not a true PostgreSQL instance, just a compatible engine. But, if you are considering running PostgreSQL on Amazon, you should definitely consider this as a possible alternative. You can learn more about Aurora and how it relates to PostgreSQL here.

Conclusion

The cloud is everywhere. We can use it for both small and huge projects alike. In this blog, we looked at the different kinds of clouds and shared how to run PostgreSQL on Amazon RDS. Let us know in the comments below you thoughts.


Validating Your PostgreSQL Backups on Docker

$
0
0

Backups are the vital and important part of any disaster recovery plan, taking backups of the production database is also a basic and an important part of PostgreSQL administration. However, DBA’s don’t often validate that those backups are reliable.

Every organization takes PostgreSQL database backups in different form, some may take a file system (physical) backup of the PostgreSQL data directories (using tools like Barman, PGBackRest) while others may take only logical backups (using pg_dump), and even others may take block level snapshots using tools like EBS or VMWare snapshot.

In this blog, we will show you how to validate your PostgreSQL backup by restoring the backup onto a Docker container using the tool pgBackRest for taking and restoring the backup. We are assuming that you already have knowledge on how to use PostgreSQL, Docker and pgBackRest.

Why Should You Use Docker?

Docker makes automation simpler, it also eases the job of integrating our PostgreSQL Backup Validation task in a CI/CD tools like CircleCI, Travis, GitLab or Jenkins. Using Docker avoids the time and resource we have to spend on bringing the new environment for testing the backup.

Demo Setup

Host 

Role

Installed

Packages 

Crontab

node-1 192.168.0.111

CentOS-7

Posgresql-11 primary Instance.

Created user and database “pgbench“ and initialized with pgbench tables.

postgresql-11, pgbackrest-2.15

Running pgbench every 5mins to simulate the workload.

node-2
192.168.0.112
CentOS-7

Test Machine - we will run our Docker validation on this host. 

docker-ce-18.06, pgbackrest-2.15


node-3

192.168.0.113

CentOS-7

pgBackRest Repository Host

pgbackrest-2.15

Running pgbackrest to take Incr backup every 4 hour

Diff backup every day

Full backup weekly 


For pgbackrest to work, I have setup passwordless SSH access between these nodes.

User “postgres” on node-1 and node-2 can login passwordless to user “pgbackrest” on node-3.

[vagrant@node-1 ~]$ sudo -u postgres ssh pgbackrest@node-3 uptime

 13:31:51 up  7:00, 1 user,  load average: 0.00, 0.01, 0.05

[vagrant@node-2 ~]$ sudo -u postgres ssh pgbackrest@node-3 uptime

 13:31:27 up  7:00, 1 user,  load average: 0.00, 0.01, 0.05

User “pgbackrest” on node-3 can login passwordless to user “postgres” on node-1 and node-2.

[vagrant@node-3 ~]$ sudo -u pgbackrest ssh postgres@node-1 uptime 

 13:32:29 up  7:02, 1 user,  load average: 1.18, 0.83, 0.58

[vagrant@node-3 ~]$ sudo -u pgbackrest ssh postgres@node-2 uptime 

 13:32:33 up  7:01, 1 user,  load average: 0.00, 0.01, 0.05

Overview of Backup Validation

Below is a brief overview of the steps we will be following for our PostgreSQL Backup Validation.

  1. Using the pgbackrest restore command we will fetch the latest backup from the pgBackRest Repository Host (node-3) to the Test Machine (node-2) directory /var/lib/pgsql/11/data
  2. During thedocker run, we mount the host machine (node-2) directory /var/lib/pgsql on the docker container and start the postgres/postmaster daemon from the mounted directory. We would also expose the port 5432 from container to host machine port 15432. 
  3. Once the docker container started running, we will connect to the PostgreSQL database via node-2:15432 and verify all tables and rows are restored. We would also check the PostgreSQL logs to make sure there is no ERROR message during the recovery and the instance has also reached the consistent state.

Most of the backup validation steps will be performed on host node-2.

Building the Docker Image

On node-2, create Dockerfile and build the docker image “postgresql:11”. In the below Dockerfile, we will apply the following changes over centos:7 base image.

  1. Installing postgresql-11, pgbackrest and openssh-clients. Openssh-clients is needed for pgbackrest.
  2. Configuring pgbackrest - We need pgbackrest configuration in the image to test PITR, without pgbackrest configuration restore_command would fail. As part of pgbackrest configuration 
    1. We are adding the pgbackrest repository host ip (192.168.0.113) in the config file /etc/pgbackrest.conf
    2. We also need password less SSH access between the docker container and pgbackrest repository host. For this, I am copying SSH_PRIVATE_KEY which I have already generated and I have also added it’s public key to the pgbackrest repository host ( pgbackrest@node-3 ) .
  3. VOLUME ["${PGHOME_DIR}"] - Defines the container directory /var/lib/pgsql as a mount point. While running docker run command we will specify node-2 host directory to this mount point.
  4. USER postgres - Any command, runs on the container will be executed as postgres user.
$ cat Dockerfile

FROM  centos:7


ARG PGBACKREST_REPO_HOST

ARG PGHOME_DIR=/var/lib/pgsql

## Adding Postgresql Repo for CentOS7

RUN yum -y install https://download.postgresql.org/pub/repos/yum/reporpms/EL-7-x86_64/pgdg-redhat-repo-latest.noarch.rpm

## Installing PostgreSQL

RUN yum -y install postgresql11 postgresql11-server postgresql11-devel postgresql11-contrib postgresql11-libs pgbackrest openssh-clients

## Adding configuration for pgbackrest, needed for WAL recovery and replication.

RUN echo -ne "[global]\nrepo1-host=${PGBACKREST_REPO_HOST}\n\n[pgbench]\npg1-path=/var/lib/pgsql/11/data\n"> /etc/pgbackrest.conf

## Adding Private Key to the Docker. Docker container would use this private key for pgbackrest wal recovery.

RUN mkdir -p ${PGHOME_DIR}/.ssh &&  chmod 0750 ${PGHOME_DIR}/.ssh

COPY --chown=postgres:postgres ./SSH_PRIVATE_KEY  ${PGHOME_DIR}/.ssh/id_rsa

RUN chmod 0600 ${PGHOME_DIR}/.ssh/id_rsa

RUN echo -ne "Host ${PGBACKREST_REPO_HOST}\n\tStrictHostKeyChecking no\n">> ${PGHOME_DIR}/.ssh/config

## Making "/var/lib/pgsql" as a mountable directory in the container

VOLUME ["${PGHOME_DIR}"]

## Setting postgres as the default user for any remaining commands

USER postgres

We now have two files, Dockerfile used by docker build and SSH_PRIVATE_KEY which we will be copied to the docker image. 

$ ls

Dockerfile  SSH_PRIVATE_KEY

Run the below command on node-2 to build our docker image. I have mentioned the pgbackrest repository host IP in the command and this IP will be used in pgbackrest parameter “repo-host”. 

$ docker build --no-cache -t postgresql:11 --build-arg PGBACKREST_REPO_HOST=192.168.0.113 .

Sending build context to Docker daemon  230.4kB

Step 1/12 : FROM  centos:7

 ---> 9f38484d220f

Step 2/12 : ARG PGBACKREST_REPO_HOST

 ---> Running in 8b7b36c6f151

Removing intermediate container 8b7b36c6f151

 ---> 31510e46e286

Step 3/12 : ARG PGHOME_DIR=/var/lib/pgsql

...

Step 4/12 : RUN yum -y install https://download.postgresql.org/pub/repos/yum/reporpms/EL-7-x86_64/pgdg-redhat-repo-latest.noarch.rpm

...

...

Step 12/12 : USER postgres

 ---> Running in c91abcf46440

Removing intermediate container c91abcf46440

 ---> bebce78df5ae

Successfully built bebce78df5ae

Successfully tagged postgresql:11

Make sure the image is successfully built, and check “postgresql:11” image is created recently as shown below.

$ docker image ls postgresql:11

REPOSITORY          TAG IMAGE ID            CREATED SIZE

postgresql          11 2e03ed2a5946        3 minutes ago 482MB

Restoring the PostgreSQL Backup

We will now restore our PostgreSQL backup maintained in pgbackrest backup repository host node-3. 

Below is the pgbackrest configuration file present on host node-2 and I have mentioned node-3 as pgbackrest repository host. Directory mentioned in the param pg1-path is where the PostgreSQL data directory would get restored.

[vagrant@node-2 ~]$ cat /etc/pgbackrest.conf 

[global]

log-level-file=detail

repo1-host=node-3


[pgbench]

pg1-path=/var/lib/pgsql/11/data

Using below pgbackrest restore command, postgresql data directory will be restored at node-2:/var/lib/pgsql/11/data

To validate PITR with the pgbackrest backup I have set --type=time --target='2019-07-30 06:24:50.241352+00', so that the WAL recovery stops before the mentioned time. 

[vagrant@node-2 ~]$ sudo -u postgres bash -c "/usr/bin/pgbackrest --type=time --target='2019-07-30 06:24:50.241352+00' --target-action=promote --recovery-option='standby_mode=on' --stanza=pgbench restore"

Above command may take time depending on the backup size and network bandwidth. Once restored, verify the size of the data directory and also check recovery.conf.

[vagrant@node-2 ~]$ sudo -u postgres du -sh /var/lib/pgsql/11/data 

2.1G    /var/lib/pgsql/11/data


[vagrant@node-2 ~]$ sudo -u postgres cat /var/lib/pgsql/11/data/recovery.conf

standby_mode = 'on'

restore_command = '/usr/bin/pgbackrest --stanza=pgbench archive-get %f "%p"'

recovery_target_time = '2019-07-30 06:24:50.241352+00'

Disable archive mode for PostgreSQL docker container.

[vagrant@node-2 ~]$ sudo -u postgres bash -c "echo 'archive_mode = off'>> /var/lib/pgsql/11/data/postgresql.auto.conf"

Start the docker container with the image “postgresql:11”. In the command we are 

  1. Setting container name as “pgbench”

  2. Mounting docker host(node-2) directory /var/lib/psql to the docker container directory /var/lib/psql 

  3. Exposing container port 5432 to port 15432 on node-2.

  4. Starting the postgres daemon using the command /usr/pgsql-11/bin/postmaster -D /var/lib/pgsql/11/data

[vagrant@node-2 ~]$ docker run --rm --name "pgbench" -v /var/lib/pgsql:/var/lib/pgsql -p 15432:5432 -d postgresql:11  /usr/pgsql-11/bin/postmaster -D /var/lib/pgsql/11/data

e54f2f65afa13b6a09236a476cb1de3d8e499310abcec2b121a6b35611dac276

Verify “pgbench” container is created and running.

[vagrant@node-2 ~]$ docker ps -f name=pgbench

CONTAINER ID        IMAGE COMMAND                  CREATED STATUS PORTS                     NAMES

e54f2f65afa1        postgresql:11 "/usr/pgsql-11/bin/p…"   34 seconds ago Up 33 seconds 0.0.0.0:15432->5432/tcp   pgbench

Validating PostgreSQL 

Since the host directory /var/lib/pgsql is shared with docker container, the logs generated by the PostgreSQL service is also visible from node-2. Verify today’s log to make sure PostgreSQL has started fine without any ERROR and make sure below log lines are present. 

[vagrant@node-2 ~]$ sudo -u postgres tailf /var/lib/pgsql/11/data/log/postgresql-Tue.csv

..

2019-07-30 06:38:34.633 UTC,,,7,,5d3fe5e9.7,5,,2019-07-30 06:38:33 UTC,1/0,0,LOG,00000,"consistent recovery state reached at E/CE000210",,,,,,,,,""

2019-07-30 06:38:34.633 UTC,,,1,,5d3fe5e9.1,2,,2019-07-30 06:38:33 UTC,,0,LOG,00000,"database system is ready to accept read only connections",,,,,,,,,""

2019-07-30 06:38:35.236 UTC,,,7,,5d3fe5e9.7,6,,2019-07-30 06:38:33 UTC,1/0,0,LOG,00000,"restored log file ""000000010000000E000000CF"" from archive",,,,,,,,,""

2019-07-30 06:38:36.210 UTC,,,7,,5d3fe5e9.7,7,,2019-07-30 06:38:33 UTC,1/0,0,LOG,00000,"restored log file ""000000010000000E000000D0"" from archive",,,,,,,,,""

...

2019-07-30 06:39:57.221 UTC,,,7,,5d3fe5e9.7,37,,2019-07-30 06:38:33 UTC,1/0,0,LOG,00000,"recovery stopping before commit of transaction 52181192, time 2019-07-30 06:25:01.576689+00",,,,,,,,,""

...

2019-07-30 06:40:00.682 UTC,,,7,,5d3fe5e9.7,47,,2019-07-30 06:38:33 UTC,1/0,0,LOG,00000,"archive recovery complete",,,,,,,,,""

Message "consistent recovery state reached at E/CE000210", indicates that with the pgbackrest backup data directory we were able to reach a consistent state.

Message "archive recovery complete", indicates that we are able to replay the WAL file backed-up by pgbackrest and able to recover without any issue.

Connect to postgresql instance via local port 15432 and verify tables and row counts.

[vagrant@node-2 ~]$ sudo -iu postgres /usr/pgsql-11/bin/psql  -p 15432 -h localhost -U pgbench 

Password for user pgbench: 

psql (11.4)

Type "help" for help.


pgbench=> \dt

              List of relations

 Schema |       Name | Type  | Owner  

--------+------------------+-------+---------

 public | pgbench_accounts | table | pgbench

 public | pgbench_branches | table | pgbench

 public | pgbench_history  | table | pgbench

 public | pgbench_tellers  | table | pgbench

(4 rows)


pgbench=> select * from pgbench_history limit 1;

 tid | bid |   aid | delta |           mtime | filler 

-----+-----+---------+-------+----------------------------+--------

  98 |   3 | 2584617 |   507 | 2019-07-30 06:20:01.412226 | 

(1 row)


pgbench=> select max(mtime) from pgbench_history ;

            max             

----------------------------

 2019-07-30 06:22:01.402245

(1 row)


pgbench=> select count(1) from pgbench_history ;

 count 

-------

 90677

(1 row)


pgbench=> select count(1) from pgbench_accounts ;

  count   

----------

 10000000

(1 row)

We have now restored our PostgreSQL backup on a docker container and also verified PITR. Once validating the backup we can stop the container and remove the data directory.

[vagrant@node-2 ~]$ docker stop pgbench

pgbench

[vagrant@node-2 ~]$ sudo -u postgres bash -c "rm -rf /var/lib/pgsql/11/data && mkdir -p /var/lib/pgsql/11/data && chmod 0700 /var/lib/pgsql/11/data"

Conclusion

In this blog, I demonstrated the backup validation using a small database on a small VirtualBox VM. Because of this, the backup validation was completed in just a few minutes. It’s important to note that in production you will need to choose a proper VM with enough Memory, CPU, and Disk to allow the backup validation to complete successfully. You can also automate the whole validation process in a bash script or even by integrating with a CI/CD pipeline so that you can regularly validate our PostgreSQL backups.


The Easy Way to Deploy a MySQL Galera Cluster on AWS

$
0
0

ClusterControl 1.7.3 comes with a notable improvement in cloud integration. It is possible to deploy a MySQL and PostgreSQL replication cluster to the cloud, as well as automatically launch a cloud instance and scale out your database cluster by adding a new database node. 

This blog post showcases how to easily deploy a Galera Cluster using ClusterControl on AWS. This new feature is part of the ClusterControl Community Edition, which comes with free deployment and monitoring features. This means that you can take advantage of this feature for no cost!

ClusterControl Database Cluster Architecture

The following diagram summarizes our overall database clusters architecture.

ClusterControl Database Cluster Architecture

The ClusterControl server is located outside of the AWS infrastructure, allowing for fair visibility to our database cluster (located in Frankfurt: eu-central-1). The ClusterControl server MUST have a dedicated public IP address. This is because the IP address will be granted by ClusterControl on the database server and AWS security group. The Galera database version that we are going to deploy is MariaDB Cluster 10.3, using ClusterControl 1.7.3.

Preparing the AWS Environment

ClusterControl is able to deploy a database cluster on supported cloud platforms, namely AWS, Google Cloud Platform (GCP), and Microsoft Azure. The first thing we have to configure is to get the AWS access keys to allow ClusterControl to perform programmatic requests to AWS services. You could use the root account access key, but this is not the recommended way. It's better to create a dedicated Identity and Access Management (IAM) user solely for this purpose.

Login to your AWS Console -> My Security Credentials -> Users -> Add User. Specify the user and pick "Programmatic Access" as the Access Type:

Adding a User in AWS Console

In the next page, create a new user group by clicking the "Create group" button and give the group name "DatabaseAutomation". Assign the following access type:

  • AmazonEC2FullAccess
  • AmazonVPCFullAccess
  • AmazonS3FullAccess (only if you plan to store the database backup on AWS S3)

Tick the DatabaseAutomation checkbox and click "Add user to group":

Add User Permissions Amazon AWS

Optionally, you can assign tags on the next page. Otherwise, just proceed to create the user. You should get the two most important things, Access key ID and Secret access key.

Add User Confirmation AWS

Download the CSV file and store it somewhere safe. We are now good to automate the deployment on cloud.

Install ClusterControl on the respective server:

$ whoami

root

$ wget http://severalnines.com/downloads/cmon/install-cc

$ chmod 755 install-cc

$ ./install-cc

Follow the installation instructions and go to http://192.168.0.11/clustercontrol and create the super admin user and password. 

To allow ClusterControl to perform automatic deployment on cloud, one has to create cloud credentials for the selected region with a valid AWS key ID and secret. Go to Sidebar -> Integrations -> Cloud Providers -> Add your first Cloud Credential -> Amazon Web Services and enter the required details and choose Frankfurt as the default region:

Add Cloud Credentials ClusterControl

This credential will be used by ClusterControl to automate the cluster deployment and management. At this point, we are ready to deploy our first cluster.

Database Cluster Deployment

Go to Deploy -> Deploy in the Cloud -> MySQL Galera -> MariaDB 10.3 -> Configure Cluster to proceed to the next page. 

Under Configure Cluster section, ensure the number of nodes is 3 and give a cluster name and MySQL root password:

Configure MySQL Galera Cluster in ClusterControl

Under Select Credential, choose a credential called "AWS Frankfurt" and proceed to the next page by clicking "Select Virtual Machine". Choose the preferred operating system and instance size. It's recommended to run our infrastructure inside a private cloud so we could get a dedicated internal IP address for our cloud instances and the hosts are not directly exposed to the public network. Click "Add New" button next to Virtual Private Cloud (VPC) field and give a subnet of 10.10.0.0/16 to this network:

Add VPC

The VPC that we have created is a private cloud and does not have internet connectivity. In order for ClusterControl to be able to deploy and manage the hosts from outside AWS network, we have to allow internet connectivity to this VPC. To do this, we have to do the following:

  1. Create an internet gateway
  2. Add external routing to the route table
  3. Associate the subnet to the route table

To create an internet gateway, login to AWS Management Console -> VPC -> Internet Gateways -> Create internet gateway ->assign a name for this gateway. Then select the created gateway from the list and go to Actions -> Attach to VPC -> select the VPC for the dropdown list -> Attach. We have now attach an internet gateway to the private cloud. However, we need to configure the network to forward all external requests via this internet gateway. Hence, we have to add a default route to the route table. Go to VPC -> Route Tables -> select the route table -> Edit Routes and specify the destination network, 0.0.0.0/0 and target (the created internet gateway ID) as below:

Edit Route Tables AWS Console

Then, we have to associate the DB subnet to this network so it assigns all instances created inside this network to the default route that we have created earlier, select the route table -> Edit Subnet Association -> assign the the DB subnet, as shown below:

Route Table Subnet AWS Console

The VPC is now ready to be used by ClusterControl for the deployment.

Once created, select the created VPC from the dropdown. For SSH Key, we will ask ClusterControl to auto generate it:

ClusterControl SSH Key Credentials

The generated SSH key will be located inside ClusterControl server under /var/lib/cmon/autogenerated_ssh_keys/s9s/ directory.

Click on "Deployment Summary". In this page, we have to assign a subnet from the VPC to the database cluster. Since this is a new VPC, it has no subnet and we have to create a new one. Click on "Add New Subnet" button and assign 10.10.1.0/24 as the network for our database cluster:

Add Subnet ClusterControl

Finally, select the create subnet in the textbox and click on "Deploy Cluster":

Select Virtual Machine ClusterControl

You can monitor the job progress under Activity -> Jobs -> Create Cluster. ClusterControl will perform the necessary pre-installation steps like creating the cloud instances, security group, generating SSH key and so on, before the actual installation steps begin.

Once cluster is ready, you should see the following cluster in ClusterControl dashboard:

ClusterControl Dashboard AWS Deployment

Our cluster deployment is now complete. 

Post AWS Database Deployment

We can start loading our data into the cluster or create a new database for your application usage. To connect, simply instruct your applications or clients to connect to the private or public IP address of one of the database servers. You can get this information by going to Nodes page, as shown in the following screenshot:

Node Data ClusterControl AWS Deployment

If you like to access the database nodes directly, you can use ClusterControl web-SSH module at Node Actions -> SSH Console, which gives you a similar experience like connecting via SSH client.

To scale the cluster up by adding a database node, you can just go Cluster Actions (server stack icon) -> Add Node -> Add a DB node on a new cloud instance and you will be presented with the following dialog:

Adding a Node ClusterControl AWS Deployment

Just simply follow the deployment wizard and configure your new instance accordingly. Once the instance is created, ClusterControl will install, configure and join the node into the cluster automatically.

That's it for now, folks. Happy clustering in the cloud!

Building a MySQL or MariaDB Database Cold Standby on Amazon AWS

$
0
0

High Availability is a must these days as most organizations can’t allow itself to lose its data. High Availability, however, always comes with a price tag (which can vary a lot.) Any setups which require nearly-immediate action would typically require an expensive environment which would mirror precisely the production setup. But, there are other options that can be less expensive. These may not allow for an immediate switch to a disaster recovery cluster, but they will still allow for business continuity (and won’t drain the budget.) 

An example of this type of setup is a “cold-standby” DR environment. It allows you to reduce your expenses while still being able to spin up a new environment in an external location should the disaster strikes. In this blog post we will demonstrate how to create such a setup.

The Initial Setup

Let’s assume we have a fairly standard Master / Slave MySQL Replication setup in our own datacenter. It is highly available setup with ProxySQL and Keepalived for Virtual IP handling. The main risk is that the datacenter will become unavailable. It is a small DC, maybe it’s only one ISP with no BGP in place. And in this situation, we will assume that if it would take hours to bring back the database that it’s ok as long as it’s possible to bring it back.

ClusterControl Cluster Topology

To deploy this cluster we used ClusterControl, which you can download for free. For our DR environment we will use EC2 (but it could also be any other cloud provider.)

The Challenge

The main issue we have to deal with is how should we ensure we do have a fresh data to restore our database in the disaster recovery environment? Of course, ideally we would have a replication slave up and running in EC2... but then we have to pay for it. If we are tight on the budget, we could try to get around that with backups. This is not the perfect solution as, in the worst case scenario, we will never be able to recover all the data. 

By “the worst case scenario” we mean a situation in which we won’t have access to the original database servers. If we will be able to reach them, data would not have been lost.

The Solution

We are going to use ClusterControl to setup a backup schedule to reduce the chance that the data would be lost. We will also use the ClusterControl feature to upload backups to the cloud. If the datacenter will not be available, we can hope that the cloud provider we have chosen will be reachable.

Setting up the Backup Schedule in ClusterControl

First, we will have to configure ClusterControl with our cloud credentials.

ClusterControl Cloud Credentials

We can do this by using “Integrations” from the left side menu.

ClusterControl Add Cloud Credentials

You can pick Amazon Web Services, Google Cloud or Microsoft Azure as the cloud you want ClusterControl to upload backups to. We will go ahead with AWS where ClusterControl will use S3 to store backups.

Add Cloud Credentials in ClusterControl

We then need to pass key ID and key secret, pick the default region and pick a name for this set of credentials.

AWS Cloud Integration Successful - ClusterControl

Once this is done, we can see the credentials we just added listed in ClusterControl.

Now, we shall proceed with setting up backup schedule.

Backup Scheduling ClusterControl

ClusterControl allows you to either create backup immediately or schedule it. We’ll go with the second option. What we want is to create a following schedule:

  1. Full backup created once per day
  2. Incremental backups created every 10 minutes.

The idea here is like follows. Worst case scenario we will lose only 10 minutes of the traffic. If the datacenter will become unavailable from outside but it would work internally, we could try to avoid any data loss by waiting 10 minutes, copying the latest incremental backup on some laptop and then we can manually send it towards our DR database using even phone tethering and a cellular connection to go around ISP failure. If we won’t be able to get the data out of the old datacenter for some time, this is intended to minimize the amount of transactions we will have to manually merge into DR database.

Create Backup Schedule in ClusterControl

We start with full backup which will happen daily at 2:00 am. We will use the master to take the backup from, we will store it on controller under /root/backups/ directory. We will also enable “Upload Backup to the cloud” option.

Backup Settings in ClusterControl

Next, we want to make some changes in the default configuration. We decided to go with automatically selected failover host (in case our master would be unavailable, ClusterControl will use any other node which is available). We also wanted to enable encryption as we will be sending our backups over the network.

Cloud Settings for Backup Scheduling in ClusterControl

Then we have to pick the credentials, select existing S3 bucket or create a new one if needed.

Create Backup in ClusterControl

We are basically repeating the process for the incremental backup, this time we used the “Advanced” dialog to run the backups every 10 minutes.

The rest of the settings is similar, we also can reuse the S3 bucket.

ClusterControl Cluster Details

The backup schedule looks as above. We don’t have to start full backup manually, ClusterControl will run incremental backup as scheduled and if it detects there’s no full backup available, it will run a full backup instead of the incremental.

With such setup we can be safe to say that we can recover the data on any external system with 10 minute granularity.

Manual Backup Restore

If it happens that you will need to restore the backup on the disaster recovery instance, there are a couple of steps you have to take. We strongly recommend to test this process from time to time, ensuring it works correctly and you are proficient in executing it.

First, we have to install AWS command line tool on our target server:

root@vagrant:~# apt install python3-pip

root@vagrant:~# pip3 install awscli --upgrade --user

Then we have to configure it with proper credentials:

root@vagrant:~# ~/.local/bin/aws configure

AWS Access Key ID [None]: yourkeyID

AWS Secret Access Key [None]: yourkeySecret

Default region name [None]: us-west-1

Default output format [None]: json

We can now test if we have the access to the data in our S3 bucket:

root@vagrant:~# ~/.local/bin/aws s3 ls s3://drbackup/

                           PRE BACKUP-1/

                           PRE BACKUP-2/

                           PRE BACKUP-3/

                           PRE BACKUP-4/

                           PRE BACKUP-5/

                           PRE BACKUP-6/

                           PRE BACKUP-7/

Now, we have to download the data. We will create directory for the backups - remember, we have to download whole backup set - starting from a full backup to the last incremental we want to apply.

root@vagrant:~# mkdir backups

root@vagrant:~# cd backups/

Now there are two options. We can either download backups one by one:

root@vagrant:~# ~/.local/bin/aws s3 cp s3://drbackup/BACKUP-1/ BACKUP-1 --recursive

download: s3://drbackup/BACKUP-1/cmon_backup.metadata to BACKUP-1/cmon_backup.metadata

Completed 30.4 MiB/36.2 MiB (4.9 MiB/s) with 1 file(s) remaining

download: s3://drbackup/BACKUP-1/backup-full-2019-08-20_113009.xbstream.gz.aes256 to BACKUP-1/backup-full-2019-08-20_113009.xbstream.gz.aes256


root@vagrant:~# ~/.local/bin/aws s3 cp s3://drbackup/BACKUP-2/ BACKUP-2 --recursive

download: s3://drbackup/BACKUP-2/cmon_backup.metadata to BACKUP-2/cmon_backup.metadata

download: s3://drbackup/BACKUP-2/backup-incr-2019-08-20_114009.xbstream.gz.aes256 to BACKUP-2/backup-incr-2019-08-20_114009.xbstream.gz.aes256

We can also, especially if you have tight rotation schedule, sync all contents of the bucket with what we have locally on the server:

root@vagrant:~/backups# ~/.local/bin/aws s3 sync s3://drbackup/ .

download: s3://drbackup/BACKUP-2/cmon_backup.metadata to BACKUP-2/cmon_backup.metadata

download: s3://drbackup/BACKUP-4/cmon_backup.metadata to BACKUP-4/cmon_backup.metadata

download: s3://drbackup/BACKUP-3/cmon_backup.metadata to BACKUP-3/cmon_backup.metadata

download: s3://drbackup/BACKUP-6/cmon_backup.metadata to BACKUP-6/cmon_backup.metadata

download: s3://drbackup/BACKUP-5/cmon_backup.metadata to BACKUP-5/cmon_backup.metadata

download: s3://drbackup/BACKUP-7/cmon_backup.metadata to BACKUP-7/cmon_backup.metadata

download: s3://drbackup/BACKUP-3/backup-incr-2019-08-20_115005.xbstream.gz.aes256 to BACKUP-3/backup-incr-2019-08-20_115005.xbstream.gz.aes256

download: s3://drbackup/BACKUP-1/cmon_backup.metadata to BACKUP-1/cmon_backup.metadata

download: s3://drbackup/BACKUP-2/backup-incr-2019-08-20_114009.xbstream.gz.aes256 to BACKUP-2/backup-incr-2019-08-20_114009.xbstream.gz.aes256

download: s3://drbackup/BACKUP-7/backup-incr-2019-08-20_123008.xbstream.gz.aes256 to BACKUP-7/backup-incr-2019-08-20_123008.xbstream.gz.aes256

download: s3://drbackup/BACKUP-6/backup-incr-2019-08-20_122008.xbstream.gz.aes256 to BACKUP-6/backup-incr-2019-08-20_122008.xbstream.gz.aes256

download: s3://drbackup/BACKUP-5/backup-incr-2019-08-20_121007.xbstream.gz.aes256 to BACKUP-5/backup-incr-2019-08-20_121007.xbstream.gz.aes256

download: s3://drbackup/BACKUP-4/backup-incr-2019-08-20_120007.xbstream.gz.aes256 to BACKUP-4/backup-incr-2019-08-20_120007.xbstream.gz.aes256

download: s3://drbackup/BACKUP-1/backup-full-2019-08-20_113009.xbstream.gz.aes256 to BACKUP-1/backup-full-2019-08-20_113009.xbstream.gz.aes256

As you remember, the backups are encrypted. We have to have encryption key which is stored in ClusterControl. Make sure you have its copy stored somewhere safe, outside of the main datacenter. If you cannot reach it, you won’t be able to decrypt backups. The key can be found in ClusterControl configuration:

root@vagrant:~# grep backup_encryption_key /etc/cmon.d/cmon_1.cnf

backup_encryption_key='aoxhIelVZr1dKv5zMbVPLxlLucuYpcVmSynaeIEeBnM='

It is encoded using base64 thus we have to decode it first and store it in the file before we can start decrypting the backup:

echo "aoxhIelVZr1dKv5zMbVPLxlLucuYpcVmSynaeIEeBnM=" | openssl enc -base64 -d > pass

Now we can reuse this file to decrypt backups. For now, let’s say we will do one full and two incremental backups. 

mkdir 1

mkdir 2

mkdir 3

cat BACKUP-1/backup-full-2019-08-20_113009.xbstream.gz.aes256 | openssl enc -d -aes-256-cbc -pass file:/root/backups/pass | zcat | xbstream -x -C /root/backups/1/

cat BACKUP-2/backup-incr-2019-08-20_114009.xbstream.gz.aes256 | openssl enc -d -aes-256-cbc -pass file:/root/backups/pass | zcat | xbstream -x -C /root/backups/2/

cat BACKUP-3/backup-incr-2019-08-20_115005.xbstream.gz.aes256 | openssl enc -d -aes-256-cbc -pass file:/root/backups/pass | zcat | xbstream -x -C /root/backups/3/

We have the data decrypted, now we have to proceed with setting up our MySQL server. Ideally, this should be exactly the same version as on the production systems. We will use Percona Server for MySQL:

cd ~
wget https://repo.percona.com/apt/percona-release_latest.generic_all.deb

sudo dpkg -i percona-release_latest.generic_all.deb

apt-get update

apt-get install percona-server-5.7

Nothing complex, just regular installation. Once it’s up and ready we have to stop it and remove the contents of its data directory.

service mysql stop

rm -rf /var/lib/mysql/*

To restore the backup we will need Xtrabackup - a tool CC uses to create it (at least for Perona and Oracle MySQL, MariaDB uses MariaBackup). It is important that this tool is installed in the same version as on the production servers:

apt install percona-xtrabackup-24

That’s all we have to prepare. Now we can start restoring the backup. With incremental backups it is important to keep in mind that you have to prepare and apply them on top of the base backup. Base backup also has to be prepared. It is crucial to run the prepare with ‘--apply-log-only’ option to prevent xtrabackup from running the rollback phase. Otherwise you won’t be able to apply next incremental backup.

xtrabackup --prepare --apply-log-only --target-dir=/root/backups/1/

xtrabackup --prepare --apply-log-only --target-dir=/root/backups/1/ --incremental-dir=/root/backups/2/

xtrabackup --prepare --target-dir=/root/backups/1/ --incremental-dir=/root/backups/3/

In the last command we allowed xtrabackup to run the rollback of not completed transactions - we won’t be applying any more incremental backups afterwards. Now it is time to populate the data directory with the backup, start the MySQL and see if everything works as expected:

root@vagrant:~/backups# mv /root/backups/1/* /var/lib/mysql/

root@vagrant:~/backups# chown -R mysql.mysql /var/lib/mysql

root@vagrant:~/backups# service mysql start

root@vagrant:~/backups# mysql -ppass

mysql: [Warning] Using a password on the command line interface can be insecure.

Welcome to the MySQL monitor.  Commands end with ; or \g.

Your MySQL connection id is 6

Server version: 5.7.26-29 Percona Server (GPL), Release '29', Revision '11ad961'


Copyright (c) 2009-2019 Percona LLC and/or its affiliates

Copyright (c) 2000, 2019, Oracle and/or its affiliates. All rights reserved.


Oracle is a registered trademark of Oracle Corporation and/or its

affiliates. Other names may be trademarks of their respective

owners.


Type 'help;' or '\h' for help. Type '\c' to clear the current input statement.


mysql> show schemas;

+--------------------+

| Database           |

+--------------------+

| information_schema |

| mysql              |

| performance_schema |

| proxydemo          |

| sbtest             |

| sys                |

+--------------------+

6 rows in set (0.00 sec)


mysql> select count(*) from sbtest.sbtest1;

+----------+

| count(*) |

+----------+

|    10506 |

+----------+

1 row in set (0.01 sec)

As you can see, all is good. MySQL started correctly and we were able to access it (and the data is there!) We successfully managed to bring our database back up-and-running in a separate location. The total time required depends strictly on the size of the data - we had to download data from S3, decrypt and decompress it and finally prepare the backup. Still, this is a very cheap option (you have to pay for S3 data only) which gives you an option for business continuity should a disaster strikes.


Comparing Galera Cluster Cloud Offerings: Part One Amazon AWS

$
0
0

Running a MySQL Galera Cluster (either the Percona, MariaDB, or Codership build) is, unfortunately, not a  supported (nor part of) the databases supported by Amazon RDS. Most of the databases supported by RDS use asynchronous replication, while Galera Cluster is a synchronous multi-master replication solution. Galera also requires InnoDB as its storage engine to function properly, and while you can use other storage engines such as MyISAM it is not advised that you use this storage engine because of the lack of transaction handling. 

Because of the lack of support natively in RDS, this blog will focus on the offerings available when choosing and hosting your Galera-based cluster using an AWS environment.

There are certainly many reasons why you would choose or not choose the AWS cloud platform, but for this particular topic we’re going to go over the advantages and benefits of what you can leverage rather than why you would choose the AWS Platform.

The Virtual Servers (Elastic Compute Instances)

As mentioned earlier, MySQL Galera is not part of RDS and InnoDB is a transactional storage engine for which you need the right resources for your application requirement. It must have the capacity to serve the demand of your client request traffic. At the time of this article, your sole choice for running Galera Cluster is by using EC2, Amazon's compute instance cloud offering. 

Because you have the advantage of running your system on a number of nodes on EC2 instances, running a Galera Cluster on EC2 verses on-prem doesn’t differ much. You can access the server remotely via SSH, install your desired software packages, and choose the kind of Galera Cluster build you like to utilize. 

Moreover, with EC2 this offering is more elastic and flexible, allowing you to deliver and offer a simpler,  granular setup. You can take advantage of the web services to automate or build a number of nodes if you need to scaleout your environment, or for example, automate the building of your staging or development environment. It also gives you an edge to quickly build your desired environment, choose and setup your desired OS, and pickup the right computing resources that fits your requirements (such as CPU, memory, and disk storage.) EC2 eliminates the time to wait for hardware, since you can do this on the fly. You can also leverage their AWS CLI tool to automate your Galera cluster setup.

Pricing for Amazon EC2 Instances

EC2 offers a number of selections which are very flexible for consumers who would like to host their Galera Cluster environment on AWS compute nodes. The AWS Free Tier includes 750 hours of Linux and Windows t2.micro instances, each month, for one year. You can stay within the Free Tier by using only EC2 Micro instances, but this might not be the best thing for production use. 

There are multiple types of EC2 instances for which you can deploy when provisioning your Galera nodes. Ideally, these r4/r5/x1 family (memory optimized) and c4/c5 family (compute optimized) are an ideal choice, and these prices differ depending on how large your server resource needs are and type of OS.

These are the types of paid instances you can choose...

On Demand 

Pay by compute capacity (per-hour or per-second), depends on the type of instances you run. For example, prices might differ when provisioning an Ubuntu instances vs RHEL instance aside from the type of instance. It has no long-term commitments or upfront payments needed. It also has the flexibility to increase or decrease your compute capacity. These instances are recommended for low cost and flexible environment needs like applications with short-term, spiky, or unpredictable workloads that cannot be interrupted, or applications being developed or tested on Amazon EC2 for the first time. Check it out here for more info.

Dedicated Hosts

If you are looking for compliance and regulatory requirements such as the need to acquire a dedicated server that runs on a dedicated hardware for use, this type of offer suits your needs. Dedicated Hosts can help you address compliance requirements and reduce costs by allowing you to use your existing server-bound software license, including Windows Server, SQL Server, SUSE Linux Enterprise Server, Red Hat Enterprise Linux, or other software licenses that are bound to VMs, sockets, or physical cores, subject to your license terms. It can be purchased On-Demand (hourly) or as a Reservation for up to 70% off the On-Demand price. Check it out here for more info.

Spot Instances

These instances allow you to request spare Amazon EC2 computing capacity for up to 90% off the On-Demand price. This is recommended for applications that have flexible start and end times, applications that are only feasible at very low compute prices, or users with urgent computing needs for large amounts of additional capacity. Check it out here for more info.

Reserved Instances

This type of payment offer provides you the option to grab up to a 75% discount and, depending on which instance you would like to reserve, you can acquire a capacity reservation giving you additional confidence in your ability to launch instances when you need them. This is recommended if your applications have steady state or predictable usage, applications that may require reserved capacity, or customers that can commit to using EC2 over a 1 or 3 year term to reduce their total computing costs. Check it out here for more info.

Pricing Note

One last thing with EC2, they also offer a per-second billing which also takes cost of unused minutes and seconds in an hour off of the bill. This is advantageous if you are scaling-out for a minimal amount of time, just to handle traffic request from a Galera node or in case you want to try and test on a specific node for just a limited time use.

Database Encryption on AWS

If you're concerned about the confidentiality of your data, or abiding the laws required for your security compliance and regulations, AWS offers data-at-rest encryption. If you're using MariaDB Cluster version 10.2+, they have built-in plugin support to interface with the Amazon Web Services (AWS) Key Management Service (KMS) API. This allows you to take advantage of AWS-KMS key management service to facilitate separation of responsibilities and remote logging & auditing of key access requests. Rather than storing the encryption key in a local file, this plugin keeps the master key in AWS KMS. 

When you first start MariaDB, the AWS KMS plugin will connect to the AWS Key Management Service and ask it to generate a new key. MariaDB will store that key on-disk in an encrypted form. The key stored on-disk cannot be used to decrypt the data; rather, on each startup, MariaDB connects to AWS KMS and has the service decrypt the locally-stored key(s). The decrypted key is stored in-memory as long as the MariaDB server process is running, and that in-memory decrypted key is used to encrypt the local data.

Alternatively, when deploying your EC2 instances, you can encrypt your data storage volume with EBS (Elastic Block Storage) or encrypt the instance itself. Encryption for EBS type volumes are all supported, though it might have an impact but the latency is very minimal or even not visible to the end users. For EC2 instance-type encryption, most of the large instances are supported. So if you're using compute or memory optimized nodes, you can leverage its encryption. 

Below are the list of supported instances types...

  • General purpose: A1, M3, M4, M5, M5a, M5ad, M5d, T2, T3, and T3a
  • Compute optimized: C3, C4, C5, C5d, and C5n
  • Memory optimized: cr1.8xlarge, R3, R4, R5, R5a, R5ad, R5d, u-6tb1.metal, u-9tb1.metal, u-12tb1.metal, X1, X1e, and z1d
  • Storage optimized: D2, h1.2xlarge, h1.4xlarge, I2, and I3
  • Accelerated computing: F1, G2, G3, P2, and P3

You can setup your AWS account to always enable encryption upon deployment of your EC2-type instances. This means that AWS will encrypt new EBS volumes on launch and encrypts new copies of unencrypted snapshots.

Multi-AZ/Multi-Region/Multi-Cloud Deployments

Unfortunately, as of this writing, there's no such direct support in the AWS Console (nor any of their AWS API) that supports Multi-AZ/-Region/-Cloud deployments for Galera node clusters. 

High Availability, Scalability, and Redundancy

To achieve a multi-AZ deployment, it's recommendable that you provision your galera nodes in different availability zones. This prevents the cluster from going down or a cluster malfunction due to lack of quorum. 

You can also setup an AWS Auto Scaling and create an auto scaling group to monitor and do status checks so your cluster will always have redundancy, scalable, and highly availability. Auto Scaling should solve your problem in the case that your node goes down for some unknown reason.

For multi-region or multi-cloud deployment, Galera has its own parameter called gmcast.segment for which you can set this upon server start. This parameter is designed to optimize the communication between the Galera nodes and minimize the amount of traffic sent between network segments including writeset relaying and IST and SST donor selection. 

This type of setup allows you to deploy multiple nodes in different regions for your Galera Cluster. Aside from that, you can also deploy your Galera nodes on a different vendor, for example, if it's hosted in Google Cloud and you want redundancy on Microsoft Azure. 

I would recommend you to check out our blog Multiple Data Center Setups Using Galera Cluster for MySQL or MariaDB and Zero Downtime Network Migration With MySQL Galera Cluster Using Relay Node to gather more information on how to implement these types of deployments.

Database Performance on AWS

Depending on your application demand, if your queries memory consuming the memory optimized instances are your ideal choice. If your application has higher transactions that require high-performance for web servers or batch processing, then choose compute optimized instances. If you want to learn more about optimizing your Galera Cluster, you can check out this blog How to Improve Performance of Galera Cluster for MySQL or MariaDB.

Database Backups on AWS

Creating backups can be difficult since there's no direct support within AWS that is specific for MySQL Galera technology. However, AWS provides you a disaster and recovery solution using EBS Snapshots. You can take snapshots of the EBS volumes attached to your instance, then either take a backup by schedule using CloudWatch or by using the Amazon Data Lifecycle Manager (Amazon DLM) to automate the snapshots. 

Take note that the snapshots taken are incremental backups, which means that only the blocks on the device that have changed after your most recent snapshot are saved. You can store these snapshots to AWS S3 to save storage costs. Alternatively,  you can use external tools like Percona Xtrabackup, and Mydumper (for logical backups) and store these to AWS EFS -> AWS S3 -> AWS Glacier

You can also setup Lifecycle Management in AWS if you need your backup data to be stored in a more cost efficient manner. If you have large files and are going to utilize the AWS EFS, you can leverage their AWS Backup solution as this is also a simple yet cost-effective solution.

On the other hand, you can also use external services (as well such as ClusterControl) which provides you both monitoring and backup solutions. Check this out if you want to know more.

Database Monitoring on AWS

AWS offers health checks and some status checks to provide you visibility into your Galera nodes. This is done through CloudWatch and CloudTrail

CloudTrail lets you enable and inspect the logs and perform audits based on what actions and traces have been made. 

CloudWatch lets you collect and track metrics, collect and monitor log files, and set custom alarms. You can set it up according to your custom needs and gain system-wide visibility into resource utilization, application performance, and operational health. CloudWatch comes with a free tier as long as you still fall within its limits (See the screenshot below.)

CloudWatch also comes with a price depending on the volume of metrics being distributed. Checkout its current pricing by checking here

Take note: there's a downside to using CloudWatch. It is not designed to cater to the database health, especially for monitoring MySQL Galera cluster nodes. Alternatively, you can use external tools that offer high-resolution graphs or charts that are useful in reporting and are easier to analyze when diagnosing a problematic node. 

For this you can use PMM by Percona, DataDog, Idera, VividCortex, or our very own ClusterControl (as monitoring is FREE with ClusterControl Community.) I would recommend that you use a monitoring tool that suits your needs based on your individual application requirements. It's very important that your monitoring tool be able to notify you aggressively or provide you integration for instant messaging systems such as Slack, PagerDuty or even send you SMS when escalating severe health status.

Database Security on AWS

Securing your EC2 instances is one of the most vital parts of deploying your database into the public cloud. You can setup a private subnet and setup the required security groups only favored to allow the port  or source IP depending on your setup. You can set your database nodes with a non-remote access and just set up a jump host or an Internet Gateway, if nodes requires to access the internet to access or update software packages. You can read our previous blog Deploying Secure Multicloud MySQL Replication on AWS and GCP with VPN on how we set this up. 

In addition to this, you can secure your data in-transit by using TLS/SSL connection or encrypt your data when it's at rest. If you're using ClusterControl, deploying a secure data in-transit is simple and easy. You can check out our blog SSL Key Management and Encryption of MySQL Data in Transit if you want to try out. For data at-rest, storing your data via S3 can be encrypted using AWS Server-Side Encryption or use AWS-KMS which I have discussed earlier. Check this external blog on how to setup and leverage a MariaDB Cluster using AWS-KMS so you can store your data securely at-rest.

Galera Cluster Troubleshooting on AWS

AWS CloudWatch can help especially when investigating and checking out the system metrics. You can check the network, CPU, memory, disk, and it's instance or compute usage and balance. This might not, however, meet your requirements when digging into a specific case. 

CloudTrail can perform solid traces of actions that has been governed based on your specific AWS account. This will help you determine if the occurrences aren't coming from MySQL Galera, but might be some bug or issues within the AWS environment (such as Hyper-V is having issues within the host machine where your instance, as the guest, is being hosted.)

If you're using ClusterControl, going to Logs -> System Logs, you'll be able to browse the captured error logs taken from the MySQL Galera node itself. Apart from this, ClusterControl provides real-time monitoring that would amplify your alarm and notification system in case an emergency or if your MySQL Galera node(s) is kaput.

Conclusion

AWS does not have pure support for a MySQL Galera Cluster setup, unlike AWS RDS which has MySQL compatibility. Because of this most of the recommendations or opinions running a Galera Cluster for production use within the AWS environment are based on experienced and well-tested environments that have been running for a very long time. 

MariaDB Cluster comes with a great productivity, as they constantly provide concise support for the AWS technology stack solution. In the upcoming release of MariaDB 10.5 version, they will offer a support for S3 Storage Engine, which may be worth the wait.

External tools can help you manage and control your MySQL Galera Cluster running on the AWS Cloud, so it's not a huge concern if you have some dilemmas and FUD on why you should run or shift to the AWS Cloud Platform.

AWS might not be the one-size-fits-all solution in some cases, but it provides a wide-array of solutions that you can customize and tailor it to fit your needs. 

In the next part of our blog, we'll look at another public cloud platform, particularly Google Cloud and see how we can leverage if we choose to run our Galera Cluster into their platform.

Tips for Storing PostgreSQL Backups on Amazon AWS

$
0
0

Data is probably one of the most valuable assets in a company. Because of this we should always have a Disaster Recovery Plan (DRP) to prevent data loss in the event of an accident or hardware failure. 

A backup is the simplest form of DR, however it might not always be enough to guarantee an acceptable Recovery Point Objective (RPO). It is recommended that you have at least three backups stored in different physical places. 

Best practice dictates backup files should have one stored locally on the database server (for a faster recovery), another one in a centralized backup server, and the last one the cloud. 

For this blog, we’ll take a look at which options Amazon AWS provides for the storage of PostgreSQL backups in the cloud and we’ll show some examples on how to do it.

About Amazon AWS

Amazon AWS is one of the world’s most advanced cloud providers in terms of features and services, with millions of customers. If we want to run our PostgreSQL databases on Amazon AWS we have some options...

  • Amazon RDS: It allows us to create, manage and scale a PostgreSQL database (or different database technologies) in the cloud in an easy and fast way.

  • Amazon Aurora: It’s a PostgreSQL compatible database built for the cloud. According to the AWS web site, it’s three times faster than standard PostgreSQL databases.

  • Amazon EC2: It’s a web service that provides resizable compute capacity in the cloud. It provides you with complete control of your computing resources and allows you to set up and configure everything about your instances from your operating system up to your applications.

But, in fact, we don’t need to have our databases running on Amazon to store our backups here.

Storing Backups on Amazon AWS

There are different options to store our PostgreSQL backup on AWS. If we’re running our PostgreSQL database on AWS we have more options and (as we’re in the same network) it could also be faster. Let’s see how AWS can help us store our backups.

AWS CLI

First, let’s prepare our environment to test the different AWS options. For our examples, we’ll use an On-prem PostgreSQL 11 server, running on CentOS 7. Here, we need to install the AWS CLI following the instructions from this site.

When we have our AWS CLI installed, we can test it from the command line:

[root@PG1bkp ~]# aws --version

aws-cli/1.16.225 Python/2.7.5 Linux/4.15.18-14-pve botocore/1.12.215

Now, the next step is to configure our new client running the aws command with the configure option.

[root@PG1bkp ~]# aws configure

AWS Access Key ID [None]: AKIA7TMEO21BEBR1A7HR

AWS Secret Access Key [None]: SxrCECrW/RGaKh2FTYTyca7SsQGNUW4uQ1JB8hRp

Default region name [None]: us-east-1

Default output format [None]:

To get this information, you can go to the IAM AWS Section and check the current user, or if you prefer, you can create a new one for this task.

After this, we’re ready to use the AWS CLI to access our Amazon AWS services.

Amazon S3

This is probably the most commonly used option to store backups in the cloud. Amazon S3 can store and retrieve any amount of data from anywhere on the Internet. It’s a simple storage service that offers an extremely durable, highly available, and infinitely scalable data storage infrastructure at low costs.

Amazon S3 provides a simple web service interface which you can use to store and retrieve any amount of data, at any time, from anywhere on the web, and (with the AWS CLI or AWS SDK) you can integrate it with different systems and programming languages.

How to use it

Amazon S3 uses Buckets. They are unique containers for everything that you store in Amazon S3. So, the first step is to access the Amazon S3 Management Console and create a new Bucket.

Create Bucket Amazon AWS

In the first step, we just need to add the Bucket name and the AWS Region.

Create Bucket Amazon AWS

Now, we can configure some details about our new Bucket, like versioning and logging.

Block Public Access Bucket Amazon AWS

And then, we can specify the permissions for this new Bucket.

S3 Buckets Amazon AWS

Now we have our Bucket created, let’s see how we can use it to store our PostgreSQL backups.

First, let’s test our client connecting it to S3.

[root@PG1bkp ~]# aws s3 ls

2019-08-23 19:29:02 s9stesting1

It works! With the previous command, we list the current Buckets created.

So, now, we can just upload the backup to the S3 service. For this, we can use aws sync or aws cp command. 

[root@PG1bkp ~]# aws s3 sync /root/backups/BACKUP-5/ s3://s9stesting1/backups/

upload: backups/BACKUP-5/cmon_backup.metadata to s3://s9stesting1/backups/cmon_backup.metadata

upload: backups/BACKUP-5/cmon_backup.log to s3://s9stesting1/backups/cmon_backup.log

upload: backups/BACKUP-5/base.tar.gz to s3://s9stesting1/backups/base.tar.gz

[root@PG1bkp ~]# 

[root@PG1bkp ~]# aws s3 cp /root/backups/BACKUP-6/pg_dump_2019-08-23_205919.sql.gz s3://s9stesting1/backups/

upload: backups/BACKUP-6/pg_dump_2019-08-23_205919.sql.gz to s3://s9stesting1/backups/pg_dump_2019-08-23_205919.sql.gz

[root@PG1bkp ~]# 

We can check the Bucket content from the AWS web site.

S3 Overview

Or even by using the AWS CLI.

[root@PG1bkp ~]# aws s3 ls s3://s9stesting1/backups/

2019-08-23 19:29:31          0

2019-08-23 20:58:36    2974633 base.tar.gz

2019-08-23 20:58:36       1742 cmon_backup.log

2019-08-23 20:58:35       2419 cmon_backup.metadata

2019-08-23 20:59:52       1028 pg_dump_2019-08-23_205919.sql.gz

For more information about AWS S3 CLI, you can check the official AWS documentation.

Amazon S3 Glacier

This is the lower-cost version of Amazon S3. The main difference between them is velocity and accessibility. You can use Amazon S3 Glacier if the cost of storage needs to stay low and you don’t require millisecond access to your data. Usage is another important difference between them.

How to use it

Instead Buckets, Amazon S3 Glacier uses Vaults. It’s a container for storing any object. So, the first step is to access the Amazon S3 Glacier Management Console and create a new Vault.

Create Vault S3 Glacier

Here, we need to add the Vault Name and the Region and, in the next step, we can enable the event notifications that uses the Amazon Simple Notification Service (Amazon SNS).

Now we have our Vault created, we can access it from the AWS CLI.

[root@PG1bkp ~]# aws glacier describe-vault --account-id - --vault-name s9stesting2

{

    "SizeInBytes": 0,

    "VaultARN": "arn:aws:glacier:us-east-1:984227183428:vaults/s9stesting2",

    "NumberOfArchives": 0,

    "CreationDate": "2019-08-23T21:08:07.943Z",

    "VaultName": "s9stesting2"

}

It’s working. So now, we can upload our backup here.

[root@PG1bkp ~]# aws glacier upload-archive --body /root/backups/BACKUP-6/pg_dump_2019-08-23_205919.sql.gz --account-id - --archive-description "Backup upload test" --vault-name s9stesting2

{

    "archiveId": "ddgCJi_qCJaIVinEW-xRl4I_0u2a8Ge5d2LHfoFBlO6SLMzG_0Cw6fm-OLJy4ZH_vkSh4NzFG1hRRZYDA-QBCEU4d8UleZNqsspF6MI1XtZFOo_bVcvIorLrXHgd3pQQmPbxI8okyg",

    "checksum": "258faaa90b5139cfdd2fb06cb904fe8b0c0f0f80cba9bb6f39f0d7dd2566a9aa",

    "location": "/984227183428/vaults/s9stesting2/archives/ddgCJi_qCJaIVinEW-xRl4I_0u2a8Ge5d2LHfoFBlO6SLMzG_0Cw6fm-OLJy4ZH_vkSh4NzFG1hRRZYDA-QBCEU4d8UleZNqsspF6MI1XtZFOo_bVcvIorLrXHgd3pQQmPbxI8okyg"

}

One important thing is the Vault status is updated about once per day, so we should wait to see the file uploaded.

[root@PG1bkp ~]# aws glacier describe-vault --account-id - --vault-name s9stesting2

{

    "SizeInBytes": 33796,

    "VaultARN": "arn:aws:glacier:us-east-1:984227183428:vaults/s9stesting2",

    "LastInventoryDate": "2019-08-24T06:37:02.598Z",

    "NumberOfArchives": 1,

    "CreationDate": "2019-08-23T21:08:07.943Z",

    "VaultName": "s9stesting2"

}

Here we have our file uploaded on our S3 Glacier Vault.

For more information about AWS Glacier CLI, you can check the official AWS documentation.

EC2

This backup store option is the more expensive and time consuming one, but it’s useful if you want to have full-control over the backup storage environment and wish to perform custom tasks on the backups (e.g. Backup Verification.)

Amazon EC2 (Elastic Compute Cloud) is a web service that provides resizable compute capacity in the cloud. It provides you with complete control of your computing resources and allows you to set up and configure everything about your instances from your operating system up to your applications. It also allows you to quickly scale capacity, both up and down, as your computing requirements change.

Amazon EC2 supports different operating systems like Amazon Linux, Ubuntu, Windows Server, Red Hat Enterprise Linux, SUSE Linux Enterprise Server, Fedora, Debian, CentOS, Gentoo Linux, Oracle Linux, and FreeBSD.

How to use it

Go to the Amazon EC2 section, and press on Launch Instance. In the first step, you must choose the EC2 instance operating system.

EC2 Choose an Amazon Machine Image (AMI)

In the next step, you must choose the resources for the new instance.

Choose an Instance Type AWS

Then, you can specify more detailed configuration like network, subnet, and more.

Configure Instance Details - AWS

Now, we can add more storage capacity on this new instance, and as a backup server, we should do it.

Add Storage AWS

When we finish the creation task, we can go to the Instances section to see our new EC2 instance.

Launch AWS EC2 Instance

When the instance is ready (Instance State running), you can store the backups here, for example, sending it via SSH or FTP using the Public DNS created by AWS. Let’s see an example with Rsync and another one with SCP Linux command.

[root@PostgreSQL1 ~]# rsync -avzP -e "ssh -i /home/user/key1.pem" /root/backups/BACKUP-11/base.tar.gz ubuntu@ec2-3-87-167-157.compute-1.amazonaws.com:/backups/20190823/

sending incremental file list

base.tar.gz

      4,091,563 100%    2.18MB/s 0:00:01 (xfr#1, to-chk=0/1)


sent 3,735,675 bytes  received 35 bytes 574,724.62 bytes/sec

total size is 4,091,563  speedup is 1.10

[root@PostgreSQL1 ~]# 

[root@PostgreSQL1 ~]# scp -i /tmp/key1.pem /root/backups/BACKUP-12/pg_dump_2019-08-25_211903.sql.gz ubuntu@ec2-3-87-167-157.compute-1.amazonaws.com:/backups/20190823/

pg_dump_2019-08-25_211903.sql.gz                                                                                                                                        100% 24KB 76.4KB/s 00:00

AWS Backup

AWS Backup is a centralized backup service that provides you with backup management capabilities, such as backup scheduling, retention management, and backup monitoring, as well as additional features, such as lifecycling backups to a low-cost storage tier, backup storage, and encryption that is independent of its source data, and backup access policies.

You can use AWS Backup to manage backups of EBS volumes, RDS databases, DynamoDB tables, EFS file systems, and Storage Gateway volumes.

How to use it

Go to the AWS Backup section on the AWS Management Console.

AWS Backup

Here you have different options, such as Schedule, Create or Restore a backup. Let’s see how to create a new backup.

Create On Demand Backup AWS Backup

In this step, we must choose the Resource Type that can be DynamoDB, RDS, EBS, EFS or Storage Gateway, and more details like expiration date, backup vault, and the IAM Role.

AWS Backup Jobs

Then, we can see the new job created in the AWS Backup Jobs section.

Snapshot

Now, we can mention this known option in all virtualization environments. The snapshot is a backup taken at a specific point in time, and AWS allows us to use it for the AWS products. Let’s an example of an RDS snapshot.

AWS DB Snapshot

We only need to choose the instance and add the snapshot name, and that’s it. We can see this and the previous snapshot in the RDS Snapshot section.

Amazon RDS Snapshots

Managing Your Backups with ClusterControl

ClusterControl is a comprehensive management system for open source databases that automates deployment and management functions, as well as health and performance monitoring. ClusterControl supports deployment, management, monitoring and scaling for different database technologies and environments, EC2 included. So, we can, for example, create our EC2 instance on AWS, and deploy/import our database service with ClusterControl.

ClusterControl Database Clusters

Creating a Backup

For this task, go to ClusterControl -> Select Cluster -> Backup -> Create Backup.

ClusterControl Create Backup

We can create a new backup or configure a scheduled one. For our example, we’ll create a single backup instantly.

ClusterControl Create Backup Details

We must choose one method, the server from which the backup will be taken, and where we want to store the backup. We can also upload our backup to the cloud (AWS, Google or Azure) by enabling the corresponding button.

ClusterControl Create Backup Settings

Then we specify the use of compression, the compression level, encryption and retention period for our backup.

ClusterControl Create Backup Cloud Settings

If we enabled the upload backup to the cloud option, we’ll see a section to specify the cloud provider (in this case AWS) and the credentials (ClusterControl -> Integrations -> Cloud Providers). For AWS, it uses the S3 service, so we must select a Bucket or even create a new one to store our backups.

ClusterControl Backup Overview

On the backup section, we can see the progress of the backup, and information like method, size, location, and more.

Conclusion

Amazon AWS allows us to store our PostgreSQL backups, whether we’re using it as a database cloud provider or not. To have an effective backup plan you should consider storing at least one database backup copy in the cloud to avoid data loss in the event of hardware failure in another backup store. The cloud lets you store as many backups as you want to store or pay for.

An Overview of the Various Scan Methods in PostgreSQL

$
0
0

In any of the relational databases engines, it is required to generate a best possible plan which corresponds to the execution of the query with least time and resources. Generally, all databases generate plans in a tree structure format, where the leaf node of each plan tree is called table scan node. This particular node of the plan corresponds to the algorithm to be used to fetch data from the base table.

For example, consider a simple query example as SELECT * FROM TBL1, TBL2 where TBL2.ID>1000; and suppose the plan generated is as below:

PostgreSQL Sample Plan Tree

So in the above plan tree, “Sequential Scan on TBL1” and “Index Scan on TBL2” corresponds to table scan method on table TBL1 and TBL2 respectively. So as per this plan, TBL1 will be fetched sequentially from the corresponding pages and TBL2 can be accessed using INDEX Scan.

Choosing the right scan method as part of the plan is very important in terms of overall query performance.

Before getting into all types of scan methods supported by PostgreSQL, let’s revise some of the major key points which will be used frequently as we go through the blog.

PostgreSQL Data Layout
  • HEAP: Storage area for storing the whole row of the table. This is divided into multiple pages (as shown in the above picture) and each page size is by default 8KB. Within each page, each item pointer (e.g. 1, 2, ….) points to data within the page.
  • Index Storage: This storage stores only key values i.e. columns value contained by index. This is also divided into multiple pages and each page size is by default 8KB.
  • Tuple Identifier (TID): TID is 6 bytes number which consists of two parts. The first part is 4-byte page number and remaining 2 bytes tuple index inside the page. The combination of these two numbers uniquely points to the storage location for a particular tuple.

Currently, PostgreSQL supports below scan methods by which all required data can be read from the table:

  • Sequential Scan
  • Index Scan
  • Index Only Scan
  • Bitmap Scan
  • TID Scan

Each of these scan methods are equally useful depending on the query and other parameters e.g. table cardinality, table selectivity, disk I/O cost, random I/O cost, sequence I/O cost, etc. Let’s create some pre-setup table and populate with some data, which will be used frequently to better explain these scan methods.

postgres=# CREATE TABLE demotable (num numeric, id int);

CREATE TABLE

postgres=# CREATE INDEX demoidx ON demotable(num);

CREATE INDEX

postgres=# INSERT INTO demotable SELECT random() * 1000,  generate_series(1, 1000000);

INSERT 0 1000000

postgres=# analyze;

ANALYZE

So in this example, one million records are inserted and then the table is analyzed so that all statistics are up to date.

Sequential Scan

As the name suggests, a Sequential scan of a table is done by sequentially scanning all item pointers of all pages of the corresponding tables. So if there are 100 pages for a particular table and then there are 1000 records in each page, as part of sequential scan it will fetch 100*1000 records and check if it matches as per isolation level and also as per the predicate clause. So even if only 1 record is selected as part of the whole table scan, it will have to scan 100K records to find a qualified record as per the condition.

As per the above table and data, the following query will result in a sequential scan as the majority of data are getting selected.

postgres=# explain SELECT * FROM demotable WHERE num < 21000;

                             QUERY PLAN

--------------------------------------------------------------------

 Seq Scan on demotable  (cost=0.00..17989.00 rows=1000000 width=15)

   Filter: (num < '21000'::numeric)

(2 rows)

NOTE

Though without calculating and comparing plan cost, it is almost impossible to tell which kind of scans will be used. But in order for the sequential scan to be used at-least below criteria should match:

  1. No Index available on key, which is part of the predicate.
  2. Majority of rows are getting fetched as part of the SQL query.

TIPS

In case only very few % of rows are getting fetched and the predicate is on one (or more) column, then try to evaluate performance with or without index.

Index Scan

Unlike Sequential Scan, Index scan does not fetch all records sequentially. Rather it uses different data structure (depending on the type of index) corresponding to the index involved in the query and locate required data (as per predicate) clause with very minimal scans. Then the entry found using the index scan points directly to data in heap area (as shown in the above figure), which is then fetched to check visibility as per the isolation level. So there are two steps for index scan:

  • Fetch data from index related data structure. It returns the TID of corresponding data in heap.
  • Then the corresponding heap page is directly accessed to get whole data. This additional step is required for the below reasons:
    • Query might have requested to fetch columns more than whatever available in the corresponding index.
    • Visibility information is not maintained along with index data. So in order to check the visibility of data as per isolation level, it needs to access heap data.

Now we may wonder why not always use Index Scan if it is so efficient.  So as we know everything comes with some cost. Here the cost involved is related to the type of I/O we are doing. In the case of Index Scan, Random I/O is involved as for each record found in index storage, it has to fetch corresponding data from HEAP storage whereas in case of Sequential Scan, Sequence I/O is involved which takes roughly just 25% of random I/O timing.

So Index scan should be chosen only if overall gain outperform the overhead incurred because of Random I/O cost.

As per the above table and data, the following query will result in an index scan as only one record is getting selected. So random I/O is less as well as searching of the corresponding record is quick.

postgres=# explain SELECT * FROM demotable WHERE num = 21000;

                                QUERY PLAN

--------------------------------------------------------------------------

 Index Scan using demoidx on demotable  (cost=0.42..8.44 rows=1 width=15)

   Index Cond: (num = '21000'::numeric)

(2 rows)

Index Only Scan

Index Only Scan is similar to Index Scan except for the second step i.e. as the name implies it only scans index data structure. There are two additional pre-condition in order to choose Index Only Scan compare to Index Scan:

  • Query should be fetching only key columns which are part of the index.
  • All tuples (records) on the selected heap page should be visible. As discussed in previous section index data structure does not maintain visibility information so in order to select data only from index we should avoid checking for visibility and this could happen if all data of that page are considered visible.

The following query will result in an index only scan. Even though this query is almost similar in terms of selecting number of records but as only key field (i.e. “num”) is getting selected, it will choose Index Only Scan.

postgres=# explain SELECT num FROM demotable WHERE num = 21000;

                                  QUERY PLAN

-----------------------------------------------------------------------------

Index Only Scan using demoidx on demotable  (cost=0.42..8.44 rows=1 Width=11)

   Index Cond: (num = '21000'::numeric)

(2 rows)

Bitmap Scan

Bitmap scan is a mix of Index Scan and Sequential Scan. It tries to solve the disadvantage of Index scan but still keeps its full advantage. As discussed above for each data found in the index data structure, it needs to find corresponding data in heap page. So alternatively it needs to fetch index page once and then followed by heap page, which causes a lot of random I/O. So bitmap scan method leverage the benefit of index scan without random I/O. This works in two levels as below:

  • Bitmap Index Scan: First it fetches all index data from the index data structure and creates a bit map of all TID. For simple understanding, you can consider this bitmap contains a hash of all pages (hashed based on page no) and each page entry contains an array of all offset within that page.
  • Bitmap Heap Scan: As the name implies, it reads through bitmap of pages and then scans data from heap corresponding to stored page and offset. At the end, it checks for visibility and predicate etc and returns the tuple based on the outcome of all these checks.

Below query will result in Bitmap scan as it is not selecting very few records (i.e. too much for index scan) and at the same time not selecting a huge number of records (i.e. too little for a sequential scan).

postgres=# explain SELECT * FROM demotable WHERE num < 210;

                                  QUERY PLAN

-----------------------------------------------------------------------------

 Bitmap Heap Scan on demotable  (cost=5883.50..14035.53 rows=213042 width=15)

   Recheck Cond: (num < '210'::numeric)

   ->  Bitmap Index Scan on demoidx  (cost=0.00..5830.24 rows=213042 width=0)

      Index Cond: (num < '210'::numeric)

(4 rows)

Now consider below query, which selects the same number of records but only key fields (i.e. only index columns). Since it selects only key, it does not need to refer heap pages for other parts of data and hence there is no random I/O involved. So this query will choose Index Only Scan instead of Bitmap Scan.

postgres=# explain SELECT num FROM demotable WHERE num < 210;

                                   QUERY PLAN

---------------------------------------------------------------------------------------

 Index Only Scan using demoidx on demotable  (cost=0.42..7784.87 rows=208254 width=11)

   Index Cond: (num < '210'::numeric)

(2 rows)

TID Scan

TID, as mentioned above, is 6 bytes number which consists of 4-byte page number and remaining 2 bytes tuple index inside the page. TID scan is a very specific kind of scan in PostgreSQL and gets selected only if there is TID in the query predicate. Consider below query demonstrating the TID Scan:

postgres=# select ctid from demotable where id=21000;

   ctid

----------

 (115,42)

(1 row) 

postgres=# explain select * from demotable where ctid='(115,42)';

                        QUERY PLAN

----------------------------------------------------------

 Tid Scan on demotable  (cost=0.00..4.01 rows=1 width=15)

   TID Cond: (ctid = '(115,42)'::tid)

(2 rows)

So here in the predicate, instead of giving an exact value of the column as condition, TID is provided. This is something similar to ROWID based search in Oracle.

Bonus

All of the scan methods are widely used and famous. Also, these scan methods are available in almost all relational database. But there is another scan method recently in discussion in the PostgreSQL community and as well recently added in other relational databases. It is called “Loose IndexScan” in MySQL, “Index Skip Scan” in Oracle and “Jump Scan” in DB2.

This scan method is used for a specific scenario where in distinct value of leading key column of B-Tree index is selected. As part of this scan, it avoids traversing all equal key column value rather just traverse the first unique value and then jump to the next big one. 

This work is still in progress in PostgreSQL with the tentative name as “Index Skip Scan” and we may expect to see this in a future release.

Viewing all 1475 articles
Browse latest View live