Quantcast
Channel: Severalnines
Viewing all 1476 articles
Browse latest View live

Comparing Percona XtraBackup to MySQL Enterprise Backup: Part One

$
0
0

When it comes to backups and data archiving, IT departments are often under stress to meet stringent service level agreements as well as deliver more robust backup procedures that would minimize the downtime, speed up the backup process, cost less, and meet tight security requirements.

There are multiple ways to take a backup of a MySQL database, but we can divide these methods into two groups - logical and physical.

Logical Backups contain data that is exported using SQL commands and stored in a file. It can be, e.g., a set of SQL commands, that, when executed, will result in restoring the content of the database. With some modifications to the output file's syntax, you can store your backup in CSV files.

Logical backups are easy to perform, solely with a one-liner, you can take a backup of all of your table, database, or all mysql databases in the instance. 

Unfortunately, logical backups have many limitations.  They are usually slower than a physical one. This is due to the overhead needed to execute SQL commands to get the data out and then to execute another set of SQL commands to get the data back into the database.  They are less flexible, unless you write complex backup workloads that would include multiple steps. It doesn't work well in a parallel environment, provides less security, and so on and so one.

Physical Backups in MySQL World

MySQL doesn't come with online physical backup for community edition. You can either pay for an Enterprise version or use a third-party tool. The most popular third-party tool on the market is XtraBackup. Those we are going to compare in this blog article.

Percona XtraBackup is the very popular, open-source, MySQL/MariaDB hot backup software that performs non-blocking backups for InnoDB and XtraDB databases. It falls into the physical backup category, which consists of exact copies of the MySQL data directory and files underneath it.

One of the biggest advantages of XtraBackup is that it does not lock your database during the backup process. For large databases (100+ GB), it provides much better restoration time as compared to mysqldump. The restoration process involves preparing MySQL data from the backup files, before replacing or switching it with the current data directory on the target node.

Percona XtraBackup works by remembering the log sequence number (LSN) when it starts and then copies away the data files to another location. Copying data takes time, and if the files are changing, they reflect the state of the database at different points in time. At the same time, XtraBackup runs a background process that keeps an eye on the transaction log (aka redo log) files, and copies changes from it. This has to be done continually because the transaction logs are written in a round-robin fashion, and can be reused after a while. XtraBackup needs the transaction log records for every change to the data files since it began execution.

By using this tool you can:

  • Create hot InnoDB backups, that complete quickly and reliably, without pausing your database or adding load to the server
  • Make incremental backups
  • Move tables between MySQL servers on-line
  • Create new MySQL replication slaves easily
  • Stream compressed MySQL backups to another server
  • Save on disk space and network bandwidth

MySQL Enterprise Backup delivers hot, online, non-blocking backups on multiple platforms. It's not a free backup tool, but it offers a lot of features. The standard license cost is $5000 (but may vary on your agreement with Oracle.) 

Backup Process Supported Platforms

MySQL Enterprise

It may run on Linux, Windows, Mac & Solaris. What is essential it may also store backup to tape, which is usually a cheaper solution than writes to disks. The direct tape writes supports integration with Veritas Netbackup, Tivoli Storage Manager, and EMC NetWorker. 

XtraBackup

XtraBackup may run only on the Linux platform, which may be undoubtedly a show stopper for those running on windows. A solution here maybe replication to the slave running on Linux and running backup from there. 

Backup Process Main Differences

MySQL Enterprise Backup provides a rich set of back and recovery features and functionality including significant performance improvements over existing MySQL backup methods. 

Oracle shows Enterprise backup to be even 49x faster than mysqldump. That, of course, may vary depending on you data however there are many features to improve the backup process. A parallel backup is definitely one of the biggest differences between mysqldump and Enterprise backup. It increases performance by multi-threaded processing. The most interesting feature, however, is compression.

--compress

Creates a backup in compressed format. For a regular backup, among all the storage engines supported by MySQL, only data files of the InnoDB format are compressed, and they bear the .ibz extension after the compression. Similarly, for a single-image backup, only data files of the InnoDB format inside the backup image are compressed. The binary log and relay log files are compressed and saved with the .bz extension when being included in a compressed backup.

-compress-method=zlib,lz4(default), lzma, punch-hole

--compress-level=LEVEL(0-9)

--include-tables=REGEXP

MySQL Backups with ClusterControl

ClusterControl allows you to schedule backups using XtraBackup and mysqldump. It can store the backup files locally on the node where the backup is taken, or the backup files can also be streamed to the controller node and compressed on-the-fly. It does not support MySQL Enterprise backup however with the extended features of mysqldump and XtraBackup it may be a good option. 

ClusterControl is the all-inclusive open source database management system for users with mixed environments. It provides advanced backup management functionality for MySQL or MariaDB.

ClusterControl Backup Repository

With ClusterControl you can:

  • Create backup policies
  • Monitor backup status, executions, and servers without backups
  • Execute backups and restores (including a point in time recovery)
  • Control backup retention
  • Save backups in cloud storage
  • Validate backups (full test with the restore on the standalone server)
  • Encrypt backups
  • Compress backups
  • And many others
ClusterControl Backup Recovery

Conclusion

As a DBA, you need to make sure that the databases are backed up regularly, and appropriate recovery procedures are in place and tested. Both Percona XtraBackup and MySQL Enterprise Backup provides DBAs with a high-performance, online backup solution with data compression and encryption technology to warrant your data is protected in the event of downtime or an outage

Backups should be planned according to the restoration requirement. Data loss can be full or partial. For instance, you do not always need to recover the whole data. In some cases, you might just want to do a partial recovery by restoring missing tables or rows. With the reach feature set, both solutions would be a great replacement of mysqldump, which is still a very popular method to do the backup. Having mysqldump is also important for partial recovery, where corrupted databases can be corrected by analyzing at the contents of the dump. Binary logs allow us to achieve point-in-time recovery, e.g., up to right before the MySQL server went down. 

This is all for part one, in the next part we are going to test the performance of both solutions and run some real case backup and recovery scenarios. 


How to Avoid PostgreSQL Cloud Vendor Lock-in

$
0
0

Vendor lock-in is a well-known concept for database technologies. With cloud usage increasing, this lock-in has also expanded to include cloud providers. We can define vendor lock-in as a proprietary lock-in that makes a customer dependent on a vendor for their products or services. Sometimes this lock-in doesn’t mean that you can’t change the vendor/provider, but it could be an expensive or time-consuming task.

PostgreSQL, an open source database technology, doesn’t have the vendor lock-in problem in itself, but if you’re running your systems in the cloud, it’s likely you’ll need to cope with that issue at some time.

In this blog, we’ll share some tips about how to avoid PostgreSQL cloud lock-in and also look at how ClusterControl can help in avoiding it.

Tip #1: Check for Cloud Provider Limitations or Restrictions

Cloud providers generally offer a simple and friendly way (or even a tool) to migrate your data to the cloud. The problem is when you want to leave them it can be hard to find an easy way to migrate the data to another provider or to an on-prem setup. This task usually has a high cost (often based on the amount of traffic).

To avoid this issue, you must always first check the cloud provider documentation and limitations to know the restrictions that may be inevitable when leaving.

Tip #2: Pre-Plan for a Cloud Provider Exit

The best recommendation that we can give you is don’t wait until the last minute to know how to leave your cloud provider. You should plan it long in advance so you can know the best, fastest, and least expensive way to make your exit., 

Because this plan most-likely depends on your specific business requirements the plan will be different depending on whether you can schedule maintenance windows and if the company will accept any downtime periods. Planning it beforehand, you will definitely avoid a headache at the end of the day.

Tip #3: Avoid Using Any Exclusive Cloud Provider Products

A cloud provider’s product will almost always run better than an open source product. This is due to the fact that it was designed and tested to run on the cloud provider’s infrastructure. The performance will often be considerably better than the second one.

If you need to migrate your databases to another provider, you’ll have the technology lock-in problem as the cloud provider product is only available in the current cloud provider environment. This means you won’t be able to migrate easily. You can probably find a way to do it by generating a dump file (or another backup method), but you'll probably have a long downtime period (depending on the amount of data and technologies that you want to use).

If you are using Amazon RDS or Aurora, Azure SQL Database, or Google Cloud SQL, (to focus on the most currently used cloud providers) you should consider checking the alternatives to migrate it to an open source database. With this, we’re not saying that you should migrate it, but you should definitely have an option to do it if needed.

Tip #4: Store You Backups to Another Cloud Provider

A good practice to decrease downtime, whether in the case of migration or for disaster recovery, is not only to store backups in the same place (for a faster recovery reasons), but also to store backups in a different cloud provider or even on-prem. 

By following this practice when you need to restore or migrate your data, you just need to copy the latest data after the backup was taken back. The amount of traffic and time will be considerably less than copying all data without compression during the migration or failure event.

Tip #5: Use a Multi-Cloud or Hybrid Model

This is probably the best option if you want to avoid cloud lock-in. Storing the data in two or more places in real-time (or as close to real-time as you can get) allows you to migrate in a fast way and you can do it with the least downtime possible. If you have a PostgreSQL cluster in one cloud provider and you have a PostgreSQL standby node in another one, in case that you need to change your provider, you can just promote the standby node and send the traffic to this new primary PostgreSQL node. 

A similar concept is applied to the hybrid model. You can keep your production cluster in the cloud, and then you can create a standby cluster or database node on-prem, which generates a hybrid (cloud/on-prem) topology, and in case of failure or migration necessities, you can promote the standby node without any cloud lock-in as you’re using your own environment.

In this case, keep in mind that probably the cloud provider will charge you for the outbound traffic, so under heavy traffic, keep this method working could generate an excessive cost for the company.

How ClusterControl Can Help Avoid PostgreSQL Lock-in

In order to avoid PostgreSQL lock-in, you can also use ClusterControl to deploy (or import), manage, and monitor your database clusters. This way you won’t depend on a specific technology or provider to keep your systems up and running.

ClusterControl has a friendly and easy-to-use UI, so you don’t need to use a cloud provider management console to manage your databases, you just need to login in and you’ll have an overview of all your database clusters in the same system.

It has three different versions (including a community free version). You can still use ClusterControl (without some paid features) even if your license is expired and it won’t affect your database performance.

You can deploy different open source database engines from the same system, and only SSH access and a privileged user is required to use it.

ClusterControl can also help in managing your backup system. From here, you can schedule a new backup using different backup methods (depending on the database engine), compress, encrypt, verify your backups by restoring it in a different node. You can also store it in multiple different locations at the same time (including the cloud).

The multi-cloud or hybrid implementation is easily doable with ClusterControl by using the Cluster-to-Cluster Replication or the Add Replication Slave feature. You only need to follow a simple wizard to deploy a new database node or cluster in a different place. 

Conclusion

As data is probably the most important asset to the company, most probably you’ll want to keep data as controlled as possible. Having a cloud lock-in doesn’t help on this. If you’re in a cloud lock-in scenario, it means that you can’t manage your data as you wish, and that could be a problem.

However, cloud lock-in is not always a problem. It could be possible that you’re running all your system (databases, applications, etc) in the same cloud provider using the provider products (Amazon RDS or Aurora,Azure SQL Database, or Google Cloud SQL) and you’re not looking for migrating anything, instead of that, it's possible that you’re taking advantage of all the benefits of the cloud provider. Avoiding cloud lock-in is not always a must as it depends on each case.

We hope you enjoyed our blog sharing the most common ways to avoid a PostgreSQL cloud lock-in and how ClusterControl can help.

How ClusterControl Performs Automatic Database Recovery and Failover

$
0
0

ClusterControl is programmed with a number of recovery algorithms to automatically respond to different types of common failures affecting your database systems. It understands different types of database topologies and database-related process management to help you determine the best way to recover the cluster. In a way, ClusterControl improves your database availability.

Some topology managers only cover cluster recovery like MHA, Orchestrator and mysqlfailover but you have to handle the node recovery by yourself. ClusterControl supports recovery at both cluster and node level.

Configuration Options

There are two recovery components supported by ClusterControl, namely:

  • Cluster - Attempt to recover a cluster to an operational state
  • Node - Attempt to recover a node to an operational state

These two components are the most important things in order to make sure the service availability is as high as possible. If you already have a topology manager on top of ClusterControl, you can disable automatic recovery feature and let other topology manager handle it for you. You have all the possibilities with ClusterControl. 

The automatic recovery feature can be enabled and disabled with a simple toggle ON/OFF, and it works for cluster or node recovery. The green icons mean enabled and red icons means disabled. The following screenshot shows where you can find it in the database cluster list:

There are 3 ClusterControl parameters that can be used to control the recovery behaviour. All parameters are default to true (set with boolean integer 0 or 1):

  • enable_autorecovery - Enable cluster and node recovery. This parameter is the superset of enable_cluster_recovery and enable_node_recovery. If it's set to 0, the subset parameters will be turned off.
  • enable_cluster_recovery - ClusterControl will perform cluster recovery if enabled.
  • enable_node_recovery - ClusterControl will perform node recovery if enabled.

Cluster recovery covers recovery attempt to bring up entire cluster topology. For example, a master-slave replication must have at least one master alive at any given time, regardless of the number of available slave(s). ClusterControl attempts to correct the topology at least once for replication clusters, but infinitely for multi-master replication like NDB Cluster and Galera Cluster.

Node recovery covers node recovery issue like if a node was being stopped without ClusterControl knowledge, e.g, via system stop command from SSH console or being killed by OOM process.

Node Recovery

ClusterControl is able to recover a database node in case of intermittent failure by monitoring the process and connectivity to the database nodes. For the process, it works similarly to systemd, where it will make sure the MySQL service is started and running unless if you intentionally stopped it via ClusterControl UI.

If the node comes back online, ClusterControl will establish a connection back to the database node and will perform the necessary actions. The following is what ClusterControl would do to recover a node:

  • It will wait for systemd/chkconfig/init to start up the monitored services/processes for 30 seconds
  • If the monitored services/processes are still down, ClusterControl will try to start the database service automatically.
  • If ClusterControl is unable to recover the monitored services/processes, an alarm will be raised.

Note that if a database shutdown is initiated by user, ClusterControl will not attempt to recover the particular node. It expects the user to start it back via ClusterControl UI by going to Node -> Node Actions -> Start Node or use the OS command explicitly.

The recovery includes all database-related services like ProxySQL, HAProxy, MaxScale, Keepalived, Prometheus exporters and garbd. Special attention to Prometheus exporters where ClusterControl uses a program called "daemon" to daemonize the exporter process. ClusterControl will try to connect to exporter's listening port for health check and verification. Thus, it's recommended to open the exporter ports from ClusterControl and Prometheus server to make sure no false alarm during recovery.

Cluster Recovery

ClusterControl understands the database topology and follows best practices in performing the recovery. For a database cluster that comes with built-in fault tolerance like Galera Cluster, NDB Cluster and MongoDB Replicaset, the failover process will be performed automatically by the database server via quorum calculation, heartbeat and role switching (if any). ClusterControl monitors the process and make necessary adjustments to the visualization like reflecting the changes under Topology view and adjusting the monitoring and management component for the new role e.g, new primary node in a replica set.

For database technologies that do not have built-in fault tolerance with automatic recovery like MySQL/MariaDB Replication and PostgreSQL/TimescaleDB Streaming Replication, ClusterControl will perform the recovery procedures by following the best-practices provided by the database vendor. If the recovery fails, user intervention is required, and of course you will get an alarm notification regarding this.

In a mixed/hybrid topology, for example an asynchronous slave which is attached to a Galera Cluster or NDB Cluster, the node will be recovered by ClusterControl if cluster recovery is enabled.

Cluster recovery does not apply to standalone MySQL server. However, it's recommended to turn on both node and cluster recoveries for this cluster type in the ClusterControl UI.

MySQL/MariaDB Replication

ClusterControl supports recovery of the following MySQL/MariaDB replication setup:

  • Master-slave with MySQL GTID
  • Master-slave with MariaDB GTID
  • Master-slave with without GTID (both MySQL and MariaDB)
  • Master-master with MySQL GTID
  • Master-master with MariaDB GTID
  • Asynchronous slave attached to a Galera Cluster

ClusterControl will respect the following parameters when performing cluster recovery:

  • enable_cluster_autorecovery
  • auto_manage_readonly
  • repl_password
  • repl_user
  • replication_auto_rebuild_slave
  • replication_check_binlog_filtration_bf_failover
  • replication_check_external_bf_failover
  • replication_failed_reslave_failover_script
  • replication_failover_blacklist
  • replication_failover_events
  • replication_failover_wait_to_apply_timeout
  • replication_failover_whitelist
  • replication_onfail_failover_script
  • replication_post_failover_script
  • replication_post_switchover_script
  • replication_post_unsuccessful_failover_script
  • replication_pre_failover_script
  • replication_pre_switchover_script
  • replication_skip_apply_missing_txs
  • replication_stop_on_error

For more details on each of the parameter, refer to the documentation page.

ClusterControl will obey the following rules when monitoring and managing a master-slave replication:

  • All nodes will be started with read_only=ON and super_read_only=ON (regardless of its role).
  • Only one master (read_only=OFF) is allowed to operate at any given time.
  • Rely on MySQL variable report_host to map the topology.
  • If there are two or more nodes that have read_only=OFF at a time, ClusterControl will automatically set read_only=ON on both masters, to protect them against accidental writes. User intervention is required to pick the actual master by disabling the read-only. Go to Nodes -> Node Actions -> Disable Readonly.

In case the active master goes down, ClusterControl will attempt to perform the master failover in the following order:

  1. After 3 seconds of master unreachability, ClusterControl will raise an alarm.
  2. Check the slave availability, at least one of the slaves must be reachable by ClusterControl.
  3. Pick the slave as a candidate to be a master.
  4. ClusterControl will calculate the probability of errant transactions if GTID is enabled. 
  5. If no errant transaction is detected, the chosen will be promoted as the new master.
  6. Create and grant replication user to be used by slaves.
  7. Change master for all slaves that were pointing to the old master to the newly promoted master.
  8. Start slave and enable read only.
  9. Flush logs on all nodes.
  10. If the slave promotion fails, ClusterControl will abort the recovery job. User intervention or a cmon service restart is required to trigger the recovery job again.
  11. When old master is available again, it will be started as read-only and will not be part of the replication. User intervention is required.

At the same time, the following alarms will be raised:

Check out Introduction to Failover for MySQL Replication - the 101 Blog and Automatic Failover of MySQL Replication - New in ClusterControl 1.4 to get further information on how to configure and manage MySQL replication failover with ClusterControl.

PostgreSQL/TimescaleDB Streaming Replication

ClusterControl supports recovery of the following PostgreSQL replication setup:

ClusterControl will respect the following parameters when performing cluster recovery:

  • enable_cluster_autorecovery
  • repl_password
  • repl_user
  • replication_auto_rebuild_slave
  • replication_failover_whitelist
  • replication_failover_blacklist

For more details on each of the parameter, refer to the documentation page.

ClusterControl will obey the following rules for managing and monitoring a PostgreSQL streaming replication setup:

  • wal_level is set to "replica" (or "hot_standby" depending on the PostgreSQL version).
  • Variable archive_mode is set to ON on the master.
  • Set recovery.conf file on the slave nodes, which turns the node into a hot standby with read-only enabled.

In case if the active master goes down, ClusterControl will attempt to perform the cluster recovery in the following order:

  1. After 10 seconds of master unreachability, ClusterControl will raise an alarm.
  2. After 10 seconds of graceful waiting timeout, ClusterControl will initiate the master failover job.
  3. Sample the replayLocation and receiveLocation on all available nodes to determine the most advanced node.
  4. Promote the most advanced node as the new master.
  5. Stop slaves.
  6. Verify the synchronization state with pg_rewind.
  7. Restarting slaves with the new master.
  8. If the slave promotion fails, ClusterControl will abort the recovery job. User intervention or a cmon service restart is required to trigger the recovery job again.
  9. When old master is available again, it will be forced to shut down and will not be part of the replication. User intervention is required. See further down.

When the old master comes back online, if PostgreSQL service is running, ClusterControl will force shutdown of the PostgreSQL service. This is to protect the server from accidental writes, since it would be started without a recovery file (recovery.conf), which means it would be writable. You should expect the following lines will appear in postgresql-{day}.log:

2019-11-27 05:06:10.091 UTC [2392] LOG:  database system is ready to accept connections

2019-11-27 05:06:27.696 UTC [2392] LOG:  received fast shutdown request

2019-11-27 05:06:27.700 UTC [2392] LOG:  aborting any active transactions

2019-11-27 05:06:27.703 UTC [2766] FATAL:  terminating connection due to administrator command

2019-11-27 05:06:27.704 UTC [2758] FATAL:  terminating connection due to administrator command

2019-11-27 05:06:27.709 UTC [2392] LOG:  background worker "logical replication launcher" (PID 2419) exited with exit code 1

2019-11-27 05:06:27.709 UTC [2414] LOG:  shutting down

2019-11-27 05:06:27.735 UTC [2392] LOG:  database system is shut down

The PostgreSQL was started after the server was back online around 05:06:10 but ClusterControl performs a fast shutdown 17 seconds after that around 05:06:27. If this is something that you would not want it to be, you can disable node recovery for this cluster momentarily.

Check out Automatic Failover of Postgres Replication and Failover for PostgreSQL Replication 101 to get further information on how to configure and manage PostgreSQL replication failover with ClusterControl.

Conclusion

ClusterControl automatic recovery understands database cluster topology and is able to recover a down or degraded cluster to a fully operational cluster which will improve the database service uptime tremendously. Try ClusterControl now and achieve your nines in SLA and database availability. Don't know your nines? Check out this cool nines calculator.

Automating MongoDB with SaltStack

$
0
0

Database deployment for a multiple number of servers becomes more complex and time consuming with time when adding new resources or making changes. In addition, there is a likelihood of human errors that may lead to catastrophic outcomes whenever the system is configured manually.  

A database deployment automation tool will enable us to deploy a database across multiple servers ranging from development to production environments. The results from an automated deployment are reliable, more efficient and predictable besides providing the current state information of your nodes which can be further used to plan for resources you will need to add to your servers. With a well-managed deployment, the productivity of both development and operational teams improves thereby enabling the business to develop faster, accomplish more and due to easy frequent deployment, the overall software setup will be ultimately better and function reliably for end-users. 

MongoDB can be deployed manually but the task becomes more and more cumbersome when you have to configure a cluster of many members being hosted on different servers. We therefore need to resolve to use an automotive tool that can save us the stress. Some of the available tools that can be used include Puppet, Chef, Ansible, and SaltStack.

The main benefits of deploying your MongoDB with any of these tools are:

  1. Time saving. Imagine having 50 nodes for your database and you need to update MongoDB version for each. This will take you ages going through the process. However, with an automatic tool, you will just need to write some instructions and issues a command to do the rest of the update for you. Developers will then have time to work on new features rather than fixing manual deployments.
  2. Reduced errors hence customer satisfaction. Making new updates may introduce errors to a database system especially if the configuration has to be done manually. With a tool like SaltStack, removing manual steps reduces human error and frequent updates with new features will address customer needs hence keeping the organization competitive.
  3. Lower configuration cost. With a deployment tool, anyone can deploy even yourself since the process itself will be much easier. This will eliminate the need for experts to do the work and reduced errors

What is SaltStack

SaltStack is an open-source remote execution tool and a configuration management system developed in Python. 

The remote execution features are used to run commands on various machines in parallel with a flexible targeting system. If for example you have 3 server machines and you would like to install MongoDB for each, you can run the installation commands on these machines simultaneously from a master node. 

In terms of configuration management, a client-server interface is established to ease and securely transform the infrastructure components into the desired state.

SaltStack Architecture

The basic setup model for SaltStack is Client-Server where the server can be referred to as the master and the Clients as slaves. The master issues command or rather instructions as the controlling system that need to be executed by the clients/minions which are the controlled systems.

SaltSack Components

The following are what SaltStack is made of

  1. Master: Responsible for issuing instructions to the slaves and change them to the desired state after execution.
  2. Minion: It is the controlled system which needs to be transformed into some desired state.
  3. Salt Grains:  this is static data or metadata regarding the minion and it constitutes information like the model, serial number, memory capacity, and the Operating System. They are collected when the minion first connects to the server. They can be used for targeting a certain group of minions in relation to some aspect. For example, you can run a command stating, install MongoDB for all machines with a Windows operating system. 
  4. Execution Modules/instructions: These are Ad hoc commands issued to one or more target minions and are executed from the command line.
  5. Pillars: are user defined variables distributed among the minions. They are used for: minion configuration, highly sensitive data, arbitrary data, and variables. Not all minions are accessible to all pillars, one can restrict which pillars are for a certain group of minions.
  6. State files. This is the core of Salt state System (SLS) and it represents the state in which the system should be in. It is an equivalent to a playbook in case of Ansible considering that they are also in YAML format i.e
#/srv/salt/mongodbInstall.sls (file root)

install_mongodb: (task id)

pkg.installed: (state declaration)

-name:mongodb  (name of package to install)
  1. Top file: Used to map a group of machines and define which state files should be applied . i.e.

#/srv/salt/top.sls

  base:

   ‘minion1’:

     -mongodb
  1. Salt Proxy:  This is a feature that enables controlling devices that cannot run a standard salt-minion. They include network gears with an API running on a proprietary OS, devices with CPU and memory limitations or ones that cannot run minions due to security reasons. A Junos proxy has to be used for discovery, control, remote execution and state management of these devices.

SaltStack Installation

We can use the pip command to install SaltStack as 

$ pip install salt

To confirm the installation, run the command$ salt --version and you should get something like salt 2019.2.2 (Fluorine)

Before connecting to the master the minion will require a minimum configuration of the master ip address and minion id which will be used by the master for its reference. These configurations can be done in the files /etc/salt/minion.

We can then run the master in various modes that is daemon or in debug mode. For the daemon case you will have$salt-master -d and for debug mode,  $salt-master -l debug. You will need to accept the minion’s key before starting it by running $ salt-key -a nameOfMinion. To list the available keys, run $ salt-key -l

In the case of the minion, we can start it with $salt-minion -l debug.

For example, if we want to create a file in all the minions from the master, we can run the command 

$ salt ‘’*” file.touch ‘/tmp/salt_files/sample.text

All nodes will have a new sample.text file in the salt_files folder. The * option is used to refer to all minions. To specify for example all minions with id name having the string minion, we will use a regex expression as below 

$ salt “minion*” file.touch ‘/tmp/salt_files/sample.text

To see the metadata collected for a given minion, run:

$salt ‘minion1’ grains.items.

Setting up MongoDB with SaltStack

We can create a database called myAppdata with the setDatabase.sls with the contents below 

classes:

- service.mongodb.server.cluster

parameters:

   _param:

     mongodb_server_replica_set: myAppdata

     mongodb_myAppdata_password: myAppdataPasword

     mongodb_admin_password: cloudlab

     mongodb_shared_key: xxx

   mongodb:

     server:

       database:

         myAppdata:

           enabled: true

           password: ${_param:mongodb_myAppdata_password}

           users:

           -  name: myAppdata

              password: ${_param:mongodb_myAppdata_password}

Starting a Single MongoDB Server 

mongodb:

  server:

    enabled: true

    bind:

      address: 0.0.0.0

      port: 27017

    admin:

      username: admin

      password: myAppdataPasword

    database:

      myAppdata:

        enabled: true

        encoding: 'utf8'

        users:

        - name: 'username'

          password: 'password'

Setting up a MongoDB Cluster with SaltStack

mongodb:

  server:

    enabled: true

    logging:

      verbose: false

      logLevel: 1

      oplogLevel: 0

    admin:

      user: admin

      password: myAppdataPasword

    master: mongo01

    members:

      - host: 192.168.100.11

        priority: 2

      - host: 192.168.101.12

      - host: 192.168.48.13

    replica_set: default

    shared_key: myAppdataPasword

Conclusion

Like ClusterControl, SaltStack is an automation tool that can be used to ease deployment and operations tasks. With an automation tool, there are reduced errors, reduced time of configuration, and more reliable results.

Clustered Database Node Failure and its Impact on High Availability

$
0
0

A node crash can happen at any time, it is unavoidable in any real world situation. Back then, when giant, standalone databases roamed the data world, each fall of such a titan created ripples of issues that moved across the world. Nowadays data world has changed. Few of the titans survived, they were replaced by swarms of small, agile, clustered database instances that can adapt to the ever changing business requirements. 

One example of such a database is Galera Cluster, which (typically) is deployed in the form of a cluster of nodes. What changes if one of the Galera nodes fail? How does this affect the availability of the cluster as a whole? In this blog post we will dig into this and explain the Galera High Availability basics.

Galera Cluster and Database High Availability

Galera Cluster is typically deployed in clusters of at least three nodes. This is due to the fact that Galera uses a quorum mechanism to ensure that the cluster state is clear for all of the nodes and that the automated fault handling can happen. For that three nodes are required - more than 50% of the nodes have to be alive after a node’s crash in order for cluster to be able to operate.

Galera Cluster

Let’s assume you have a three nodes in Galera Cluster, just as on the diagram above. If one node crashes, the situation changes into following:

Node “3” is off but there are nodes “1” and “2”, which consist of 66% of all nodes in the cluster. This means, those two nodes can continue to operate and form a cluster. Node “3” (if it happens to be alive but it cannot connect to the other nodes in the cluster) will account for 33% of the nodes in the cluster, thus it will cease to operate.

We hope this is now clear: three nodes are the minimum. With two nodes each would be 50% of the nodes in the cluster thus neither will have majority - such cluster does not provide HA. What if we would add one more node?

Such setup allows also for one node to fail:

In such case we have three (75%) nodes up-and-running, which is the majority. What would happen if two nodes fail?

Two nodes are up, two are down. Only 50% of the nodes are available, there is no majority thus cluster has to cease its operations. The minimal cluster size to support failure of two nodes is five nodes:

In the case as above two nodes are off, three are remaining which makes it 60% available thus the majority is reached and cluster can operate.

To sum up, three nodes are the minimum cluster size to allow for one node to fail. Cluster should have an odd number of nodes - this is not a requirement but as we have seen, increasing cluster size from three to four did not make any difference on the high availability - still only one failure at the same time is allowed. To make the cluster more resilient and support two node failures at the same time, cluster size has to be increased from three to five. If you want to increase the cluster's ability to handle failures even further you have to add another two nodes.

Impact of Database Node Failure on the Cluster Load

In the previous section we have discussed the basic math of the high availability in Galera Cluster. One node can be off in a three node cluster, two off in a five node cluster. This is a basic requirement for Galera. 

You have to also keep in mind other aspects too. We’ll take a quick look at them just now. For starters, the load on the cluster. 

Let’s assume all nodes have been created equal. Same configuration, same hardware, they can handle the same load. Having load on one node only doesn’t make too much sense cost-wise on three node cluster (not to mention five node clusters or larger). You can safely expect that if you invest in three or five galera nodes you want to utilize all of them. This is quite easy - load balancers can distribute the load across all Galera nodes for you. You can send the writes to one node and balance reads across all nodes in the cluster. This poses additional threat you have to keep in mind. How does the load will look like if one node will be taken out of the cluster? Let’s take a look at the following case of a five node cluster.

We have five nodes, each one is handling 50% load. This is quite ok, nodes are fairly loaded yet they still have some capacity to accommodate unexpected spikes in the workload. As we discussed, such cluster can handle up to two node failures. Ok, let’s see how this would look like:

Two nodes are down, that’s ok. Galera can handle it. 100% of the load has to be redistributed across three remaining nodes. This makes it a total 250% of the load distributed across three nodes. As a result, each of them will be running at 83% of their capacity. This may be acceptable but 83% of the load on average means that the response time will be increased, queries will take longer and any spike in the workload most likely will cause serious issues. 

Will our five node cluster (with 50% utilization of all nodes) really able to handle failure of two nodes? Well, not really, no. It will definitely not be as performant as the cluster before the crashes. It may survive but it’s availability may be seriously affected by temporary spikes in the workload.

You also have to keep in mind one more thing - failed nodes will have to be rebuilt. Galera has an internal mechanism that allows it to provision nodes which join the cluster after the crash. It can either be IST, incremental state transfer, when one of the remaining nodes have required data in gcache. If not, full data transfer will have to happen - all data will be transferred from one node (donor) to the joining node. The process is called SST - state snapshot transfer. Both IST and SST requires some resources. Data has to be read from disk on the donor and then transferred over the network. IST is more light-weight, SST is much heavier as all the data has to be read from disk on the donor. No matter which method will be used, some additional CPU cycles will be burnt. Will the 17% of the free resources on the donor enough to run the data transfer? It’ll depend on the hardware. Maybe. Maybe not. What doesn’t help is that most of the proxies, by default, remove donor node from the pool of nodes to send traffic to. This makes perfect sense - node in “Donor/Desync” state may lag behind the rest of the cluster. 

When using Galera, which is virtually a synchronous cluster, we don’t expect nodes to lag. This could be a serious issue for the application. On the other hand, in our case, removing donor from the pool of nodes to load balance the workload ensures that the cluster will be overloaded (250% of the load will be distributed across two nodes only, 125% of node’s capacity is, well, more than it can handle). This would make the cluster definitely not available at all.

Conclusion

As you can see, high availability in the cluster is not just a matter of quorum calculation. You have to account for other factors like workload, its change in time, handling state transfers. When in doubt, test yourself. We hope this short blog post helped you to understand that high availability is quite a tricky subject even if only discussed based on two variables - number of nodes and node’s capacity. Understanding this should help you design better and more reliable HA environments with Galera Cluster.

How to Backup an Encrypted Database with Percona Server for MySQL 8.0

$
0
0

Production interruptions are nearly guaranteed to happen at some point in time. We know it so we plan backups, create recovery standby databases, convert single instances into clusters.

Admitting the need for a proper recovery scenario, we must analyze the possible disaster timeline and failure scenarios and implement steps to bring your database up. Planned outage execution can help prepare, diagnose, and recover from the next one. To mitigate the impact of downtime, organizations need an appropriate recovery plan, which would include all factors required to bring service into life.

Backup Management is not as mild as just scheduling a backup job. There are many factors to consider, such as retention, storage, verification, and whether the backups you are taking are physical or logical and what is easy to overlook security. 

Many organizations vary their approach to backups, trying to have a combination of server image backups (snapshots), logical and physical backups stored in multiple locations. It is to avoid any local or regional disasters that would wipe up our databases and backups stored in the same data center.

We want to make it secure. Data and backups should be encrypted. But there are many implications when both options are in place. In this article, we will take a look at backup procedures when we deal with encrypted databases.

Encryption-at-Rest for Percona Server for MySQL 8.0

Starting from MySQL 5.7.11, the community version of MySQL began support for InnoDB tablespace encryption. It is called Transparent Tablespace Encryption or referred to as Encryption-at-Rest. 

The main difference compared to the enterprise version is the way the keys are stored - keys are not located in a secure vault, which is required for regulatory compliance. The same applies to Percona Server, starting version 5.7.11, it is possible to encrypt InnoDB tablespace. In the Percona Server 8.0, support for encrypting binary logs has been greatly extended. Version 8.0 added 

(Per Percona 8.0 release doc):

  • Temporary File Encryption
  • InnoDB Undo Tablespace Encryption
  • InnoDB System Tablespace Encryption (InnoDB System Tablespace Encryption)
  • default_table_encryption  =OFF/ON (General Tablespace Encryption)
  • table_encryption_privilege_check =OFF/ON (Verifying the Encryption Settings)
  • InnoDB redo log encryption (for master key encryption only) (Redo Log Encryption)
  • InnoDB merge file encryption (Verifying the Encryption Setting)
  • Percona Parallel doublewrite buffer encryption (InnoDB Tablespace Encryption)

For those interested in-migration from MySQL Enterprise version to Percona -  It is also possible to integrate with Hashicorp Vault server via a keyring_vault plugin, matching the features available in Oracle’s MySQL Enterprise edition.

Data at rest encryption requires that a keyring plugin. There are two options here:

How to Enable Tablespace Encryption

To enable encryption start your database with the --early-plugin-load option:

either by hand:

$ mysqld --early-plugin-load="keyring_file=keyring_file.so"

or by modifying the configuration file:

[mysqld]

early-plugin-load=keyring_file.so

Starting Percona Server 8.0 two types of tablespaces can be encrypted. General tablespace and system tablespace. Sys tablespace is controlled via parameter innodb_sys_tablespace_encrypt. By default, the sys tablespace is not encrypted, and if you have one already, it's not possible to convert it to encrypted state, a new instance must be created (start an instance with --bootstrap option). 

General tablespace support encryption either of all tables in tablespace or none. It's not possible to run encryption in mixed mode. In order to create ate tablespace with encryption use ENCRYPTION='Y/N' flag. 

Example:

mysql> CREATE TABLESPACE severalnines ADD DATAFILE 'severalnines.ibd' ENCRYPTION='Y';

Backing up an Encrypted Database

When you add encrypted tablespaces it's necessary to include keyring file in the xtrabackup command. To do it you must specify the path to a keyring file as the value of the --keyring-file-data option.

$ xtrabackup --backup --target-dir=/u01/mysql/data/backup/ --user=root --keyring-file-data=/u01/secure_location/keyring_file

Make sure to store the keyring file in a secure location. Also, make sure to always have a backup of the file. Xtrabackup will not copy the keyring file in the backup directory. To prepare the backup, you need to make a copy of the keyring file yourself.

Preparing the Backup

Once we have our backup file we should prepare it for the recovery. Here you also need to specify the keyring-file-data.

$ xtrabackup --prepare --target-dir=/u01/mysql/data/backup/ --keyring-file-data=/u01/secure_location/keyring_file

The backup is now prepared and can be restored with the --copy-back option. In the case that the keyring has been rotated, you will need to restore the keyring (which was used to take and prepare the backup).

In order to prepare the backup xtrabackup, we will need access to the keyring.  Xtrabackup doesn’t talk directly to the MySQL server and doesn’t read the default my.cnf configuration file during prepare, specify keyring settings via the command line:

$ xtrabackup --prepare --target-dir=/data/backup --keyring-vault-config=/etc/vault.cnf

The backup is now prepared and can be restored with the --copy-back option:

$ xtrabackup --copy-back --target-dir=/u01/backup/ --datadir=/u01/mysql/data/

Performing Incremental Backups

The process of taking incremental backups with InnoDB tablespace encryption is similar to taking the same incremental backups with an unencrypted tablespace.

To make an incremental backup, begin with a full backup. The xtrabackup binary writes a file called xtrabackup_checkpoints into the backup’s target directory. This file contains a line showing the to_lsn, which is the database’s LSN at the end of the backup.

First, you need to create a full backup with the following command:

$ xtrabackup --backup --target-dir=/data/backups/base --keyring-file-data=/var/lib/mysql-keyring/keyring

Now that you have a full backup, you can make an incremental backup based on it. Use a command such as the following:

$ xtrabackup --backup --target-dir=/data/backups/inc1 \

--incremental-basedir=/data/backups/base \

--keyring-file-data=/var/lib/mysql-keyring/keyring

The /data/backups/inc1/ directory should now contain delta files, such as ibdata1.delta and test/table1.ibd.delta

The meaning should be self-evident. It’s now possible to use this directory as the base for yet another incremental backup:

$ xtrabackup --backup --target-dir=/data/backups/inc2 \

--incremental-basedir=/data/backups/inc1 \

--keyring-file-data=/var/lib/mysql-keyring/keyring

Preparing Incremental Backups

So far the process of backing up the database is similar to a regular backup, except for the flag where we specified location of keyring file. 

Unfortunately, the --prepare step for incremental backups is not the same as for normal backups.

In normal backups, two types of operations are performed to make the database consistent: committed transactions are replayed from the log file against the data files, and uncommitted transactions are rolled back. You must skip the rollback of uncommitted transactions when preparing a backup, because transactions that were uncommitted at the time of your backup may be in progress, and it’s likely that they will be committed in the next incremental backup. You should use the --apply-log-only option to prevent the rollback phase.

If you do not use the--apply-log-only option to prevent the rollback phase, then your incremental backups will be useless. After transactions have been rolled back, further incremental backups cannot be applied.

Beginning with the full backup you created, you can prepare it and then apply the incremental differences to it. Recall that you have the following backups:

/data/backups/base

/data/backups/inc1

/data/backups/inc2

To prepare the base backup, you need to run --prepare as usual, but prevent the rollback phase:

$ xtrabackup --prepare --apply-log-only --target-dir=/data/backups/base --keyring-file-data=/var/lib/mysql-keyring/keyring

To apply the first incremental backup to the full backup, you should use the following command:

$ xtrabackup --prepare --apply-log-only --target-dir=/data/backups/base \

--incremental-dir=/data/backups/inc1 \

--keyring-file-data=/var/lib/mysql-keyring/keyring

if the keyring has been rotated between the base and incremental backup that you’ll need to use the keyring that was in use when the first incremental backup has been taken.

Preparing the second incremental backup is a similar process

$ xtrabackup --prepare --target-dir=/data/backups/base \

--incremental-dir=/data/backups/inc2 \

--keyring-file-data=/var/lib/mysql-keyring/keyring

Note;--apply-log-only should be used when merging all incrementals except the last one. That’s why the previous line doesn’t contain the --apply-log-only option. Even if the --apply-log-only was used on the last step, backup would still be consistent but in that case server would perform the rollback phase.
The last step is to restore it with --copy-back option. In case the keyring has been rotated you’ll need to restore the keyring which was used to take and prepare the backup.

While the described restore method works, it requires an access to the same keyring that the server is using. It may not be possible if the backup is prepared on a different server or at a much later time, when keys in the keyring are purged, or, in the case of a malfunction, when the keyring vault server is not available at all.

The--transition-key=<passphrase> option should be used to make it possible for xtrabackup to process the backup without access to the keyring vault server. In this case, xtrabackup derives the AES encryption key from the specified passphrase and will use it to encrypt tablespace keys of tablespaces that are being backed up.

Creating a Backup with a Passphrase

The following example illustrates how the backup can be created in this case:

$ xtrabackup --backup --user=root -p --target-dir=/data/backup \

--transition-key=MySecetKey

Restoring the Backup with a Generated Key

When restoring a backup you will need to generate a new master key. Here is the example for keyring_file:

$ xtrabackup --copy-back --target-dir=/data/backup --datadir=/data/mysql \

--transition-key=MySecetKey --generate-new-master-key \

--keyring-file-data=/var/lib/mysql-keyring/keyring

In case of keyring_vault, it will look like this:

$ xtrabackup --copy-back --target-dir=/data/backup --datadir=/data/mysql \

--transition-key=MySecetKey --generate-new-master-key \

--keyring-vault-config=/etc/vault.cnf
 

Best Practices for Archiving Your Database in the Cloud

$
0
0

With the technology available today there is no excuse for failing to recover your data due to lack of backup policies or understanding of how vital it is to take backups as part of your daily, weekly, or monthly routine. Database backups must be taken on a regular basis as part of your overall disaster recovery strategy. 

The technology for handling backups has never been more efficient and many best practices have been adopted (or bundled) as part of a certain database technology or service that offers it.

To some extent, people still don’t understand how to store data backups efficiently, nor do they understand the difference between data backups versus archived data. 

Archiving your data provides many benefits, especially in terms of efficiency such as storage costs, optimizing data retrieval, data facility expenses, or payroll for skilled people to maintain your backup storage and its underlying hardware. In this blog, we'll look at the best practices for archiving your data in the cloud.

Data Backups vs Data Archives

For some folks in the data tech industry, these topics are often confusing, especially for newcomers.

Data backups are backups that are taken from your physical and raw data to be stored locally or offsite which can be accessed in case of emergency or data recovery. It is used to restore data in case it is lost, corrupted or destroyed. 

Data archived, on the other hand, are data (or can still be a backup data) but are no longer used or less critical to your business needs such as stagnant data, yet it's still not obsolete and has value on it. This means that data that is to be stored is still important but that doesn’t need to be accessed or modified frequently (if at all).  Its purpose can be among these:

  • reduce its primary consumption so it can be stored on a low-performant machines since data stored on it doesn't mean it has to be retrieved everyday or immediately.
  • Retain cost-efficiency on maintaining your data infrastructure
  • Worry-less for an overgrowing data especially those data that are old or data that are infrequently changed from time-to-time.
  • Avoid large expenses when maintaining backup appliances or software that are integrated into the backup system.
  • As a requirement to meet regulatory standards like HIPAA, PCI-DSS or GDPR to store legacy data or data that they are required to keep

While for databases, it has a very promising benefits which are,

  • it helps reduce data complexity especially when data grows drastically but archiving your data helps maintain the size of your data set.
  • It helps your daily, weekly, or monthly data backups perform optimally because it has less data since it doesn't need to include processing the old or un-useful data. It's un-useful since it's not a useless data but it's just un-useful for daily or frequent needs.
  • It helps your queries perform efficiently and optimization results can be consistent at times since it doesn't require to scan large and old data.
  • data storage space can be managed and controlled accordingly based on its data retention and policy.

Data archived facility is not necessarily has to be the same power and resources as the data backups storage have. Tape drives, magnetic disk, or optical drives can be used for data archiving opposes. While it's  purpose of storing the data means its infrequently accessed or shall be accessed not very soon but still can be accessible when it's needed.

Additionally, people involved in data archival requires to identify what archived data means. Data archives are those data that are not reproducible or data that can be re-generated or self-generated. If the data stored in the database are records that can be a result of a mathematical determinants or calculation that are predictably reproducible, then these can be re-generated if needed. This can be excluded for your data archival purposes.

Data Retention Standards

It's true that pruning your data records stored in your database and moving it to your archives has some great benefits. It doesn't mean, however, that you are free to do this as it depends on your business requirements. In fact, different countries have laws that require you to follow (or at least implement) based on the regulation. You will need to determine what archived data mean to your business application or what data are infrequently accessed. 

For example, Healthcare providers are commonly required (depending on its country of origin) to retain patient's information for long periods of time. While in Finance, the rules depend on the specific country. What data you need to retain should be verified so you can safely prune it for archival purposes and then store it in a safe, secure place.

The Data Life-Cycle

Data backups and data archives are usually taken alongside through a backup life-cycle process. This life-cycle process has to be defined within your backup policy. Most backup policies have to undergo the process as listed below...

  • it has the process defined on which it has to be taken (daily, weekly, monthly),
  • if it has to be a full backup or an incremental backup,
  • the format of the backup if it has to be compressed or stored in an archived file format, 
  • if the data has to be encrypted or not, 
  • its designated location to store the backup (locally stored on the same machine or over the local network), 
  • its secondary location to store the backup (cloud storage, or in a collo), 
  • and it's data retention on how old your data can be present until its end-of-life or destroyed. 

What Applications Need Data Archiving?

While everyone can enjoy the benefits of data archiving, there are certain fields that regularly practice this process for managing and maintaining their data. 

Government institutions fall into this criteria. Security and public safety (such as video surveillance, threats to personal, residential, social, and business safety) require that this information be retained. This type of data must be stored securely for years to come for forensic and investigative purposes.

Digital Media companies often have to store large amounts of content of their data and these files are often very large in size. Digital Libraries also has to store tons of data for research or information for public use. 

Healthcare providers, including insurance, are required to retain large amounts of information on their patients' for many years. Certainly, data can grow quickly and it can affect the efficiency of the database when it's not maintained properly. 

Cloud Storage Options For Your Archived Data

The oop cloud companies are actively competing to get you great features to store your archived data in the cloud. It starts with a low cost price and offers flexibility to access your data off-site. Cloud storage is a useful and reliable off-site data storage for data backups and data archiving purposes, especially because it's very cost efficient. You don't need to maintain large amounts of data. No need to maintain your hardware and storage services in your local site or primary site. It's less expensive, as well, in handling electricity billings. 

These points are important as you might not need to access your archived date in real-time. On certain occasions, especially when a recovery or investigation has to be done, you might require access to your data abruptly. For some businesses, they offer their customers the ability to access their old data, but you have to wait for hours or days before they can provide the access to download the archived data.

For example, in AWS, they have AWS S3 Glacier which offers a great flexibility. In fact, you can store your data via S3, setup a life-cycle policy and define the end of your data when it will be destroyed. Check out the documentation on How Do I Create a Lifecycle Policy for an S3 Bucket?. The great thing with AWS S3 Glacier is that, it is highly flexible. See their waterfall model below,

Image Courtesy of Amazon's Documentation "Transitioning Objects Using Amazon S3 Lifecycle".

At this level, you can store your backups to S3 and let the life-cycle process defined in that bucket handle the data archival purposes. 

If you're using GCP (Google Cloud Platform), they also offer similar approach. Check out their documentation about Object Lifecycle Management. GCP uses the TTL (or Time-to-Live) approach for retaining objects stored in their Cloud Storage. The great thing with the GCP offering is that they have Archival Cloud Storage which offers Nearline and Coldline storage types. 

Coldline is ideal for data that are infrequently modified or access in a year. Where as with the Nearline storage type, it's more frequent (a monthly rate or at least modified once a month) but possibly multiple times throughout the year. Your data stored in a life-cycle basis can be accessed in a sub-second and that could be fast.

With Microsoft Azure, its offerings are plain and simple. They offer the same thing as GCP and AWS does and it offers you to move your archived data into hot or cool tiers. You maybe able to prioritize your requested archived data when needed to the hot or cool tiers but comes with a price compared to a standard request. Checkout their documentation on Rehydrate blob data from the archive tier.

Overall, this provides hassle free when storing your archived data to the cloud. You may need to define your requirements and of course cost involved when determining which cloud would you need to avail.

Best Practices for Your Archived Data in the Cloud

Since we have tackled the differences of data backups and archived data (or data archives), and some of the top cloud vendor offerings, let's take a list of what's the best practices you must have when storing to the cloud.

  • Identify the type of data to be archived. As stated earlier, data backups is not data archived but your data backups can be a data archived. However, data archives are those data that are stagnant, old data, and has infrequently accessed. You need to identify first what are these, mark a tag or add a label to these archived data so you would be able to identify it when stored off-site.
  • Determine Data Access Frequency. Before everything else has to be archived,  you need to identify how frequently will you be going to access the archived data when needed. Certain price can differ on the time you have to access data. For example, Amazon S3 will charge higher if you avail for Expedite Retrieval using Provisioned instead of On-Demand, same thing with Microsoft Azure when you rehydrate archived data with a higher priority.
  • Ensure Multiple Copies Are Spread. Yes, you read it correctly. Even it's archived data or stagnant data, you still need to ensure that your copies are highly available and highly durable when needed. The cloud vendors we have mentioned earlier offers SLA's that will give you an overview of how they store the data for efficiency and faster accessibility. In fact, when configuring your life-cycle policy/backup policy, ensure that you are able to store it in multiple regions or replicate your archived data into a different region. Most of these tech-giant cloud vendors stores their archival cloud storage offerings with multiple zones to offer highly scalable and durable in times of data retrieval is requested.
  • Data Compliance. Ensure that data compliance and regulations are followed accordingly and make it happen during initial phase and not later. Unless the data doesn't affect customer's profile and are just business logic data and history, it might be harmless when it's destroyed but it's better to make things in accord.
  • Provider standards. Choose the right cloud backup and data-retention provider. Walking the path of online data archiving and backup with an experienced service provider could save you from unrecoverable data loss. The top 3 tech-giants of the cloud can be your top choice. But you're free to choose as well promising cloud vendors out there such as Alibaba, IBM or Oracle Archive Storage. It can be best to try it out before making your final decision.

Data Archiving Tools and Software

Database using MariaDB, MySQL, or Percona Server can benefit with using pt-archiver. pt-archiver has been widely used for almost a decade and allows you to prune your data while doing archiving as well. For example, the command below to remove orphan records can be done as,

pt-archiver --source h=host,D=db,t=child --purge \

  --where 'NOT EXISTS(SELECT * FROM parent WHERE col=child.col)'

or send the rows to a different host such as OLAP server,

pt-archiver --source h=oltp_server,D=test,t=tbl --dest h=olap_server \

  --file '/var/log/archive/%Y-%m-%d-%D.%t'                           \

  --where "1=1" --limit 1000 --commit-each

For PostgreSQL or TimescaleDB, you can try and use the CTE (Common Table Expressions) to achieve this. For example,

CREATE TABLE public.user_info_new (LIKE public.user_info INCLUDING ALL);


ALTER TABLE public.user_info_new OWNER TO sysadmin;


GRANT select ON public.user_info_new TO read_only

GRANT select, insert, update, delete ON public.user_info TO user1;

GRANT all ON public.user_info TO admin;


ALTER TABLE public.user_info INHERIT public.user_info_new;


BEGIN;

LOCK TABLE public.user_info IN ACCESS EXCLUSIVE MODE;

LOCK TABLE public.user_info_new IN ACCESS EXCLUSIVE MODE;

ALTER TABLE public.user_info RENAME TO user_info_old;

ALTER TABLE public.user_info_new RENAME TO user_info;


COMMIT;  (or ROLLBACK; if there's a problem)

Then do a,

WITH row_batch AS (

    SELECT id FROM public.user_info_old WHERE updated_at >= '2016-10-18 00:00:00'::timestamp LIMIT 20000 ),

delete_rows AS (

    DELETE FROM public.user_info_old u USING row_batch b WHERE b.id = o.id RETURNING o.id, account_id, created_at, updated_at, resource_id, notifier_id, notifier_type)

INSERT INTO public.user_info SELECT * FROM delete_rows;

Using CTE with Postgres might incur performance issues. You might have to run this during non-peak hours. See this external blog to be careful on using CTE with PostgreSQL.

For MongoDB, you can try and use mongodump with the --archive parameters just like below,

mongodump --archive=test.$(date +"%Y_%m_%d").archive --db=test

this will dump an archive file namely test.<current-date>.archive

Using ClusterControl for Data Archival

ClusterControl allows you to set a backup policy and upload data off-site to your desired cloud storage location. ClusterControl supports the Top three clouds (AWS, GCP, and Microsoft Azure). Please checkout our previous blog on Best Practices for Database Backups to learn more.

With ClusterControl you can take a backup by first defining the backup policy, choose the database, and archive the table just like below...

Make sure that the "Upload Backup to the cloud" is enabled or checked just like above. Define the backup settings and set retention,

Then define the cloud settings just like below.

For the selected bucket, ensure that you have setup lifecycle management, and in this scenario, we're using AWS S3. In order to setup the lifecycle rule, you just have to select the bucket, then go to the Management tab just like below,

then setup the lifecycle rules as follows,

then ensure its transitions,

In the example above, we're ensuring the transition will go to Amazon S3 Glacier, which is our best choice to retain archived data.

Once you are done setting up, you're good-to-go to take the backup. Your archived data will follow the lifecycle you have setup within AWS for this example. If you use GCP or Microsoft Azure, it's just the same process where you have to set the backup along with its lifecycle.

Conclusion

Adopting the best practices for archiving your data into the cloud can be cumbersome at the beginning, however, if you have the right set of tools or bundled software, it will make your life easier to implement the process.


How to Install ClusterControl to a Custom Location

$
0
0

ClusterControl consists of a number of components and one of the most important ones is the ClusterControl UI. This is the web application through which the user interacts with other backend ClusterControl components like controller, notification, web-ssh module and cloud module. Each component is packaged independently with its own name, therefore easier for potential issues to be fixed and delivered to the end user. For more info on ClusterControl components, check out the documentation page.

In this blog post, we are going to look into ways to customize our ClusterControl installation, especially the ClusterControl UI which by default will be located under /var/www/html (default document root of Apache). Note that it's recommended to host ClusterControl on a dedicated server where it can use all the default paths which will simplify ClusterControl maintenance operations.

Installing ClusterControl

For a fresh installation, go to our Download page to get the installation link. Then, start installing ClusterControl using the installer script as root user:

$ whoami

root

$ wget https://severalnines.com/downloads/cmon/install-cc

$ chmod 755 install-cc

$ ./install-cc

Follow the installation wizard accordingly and the script will install all dependencies, configure ClusterControl components and start them up. The script will configure Apache 2.4, and use the package manager to install ClusterControl UI which by default located under /var/www/html.

Preparation

Once ClusterControl is installed into its default location, we can then move the UI directories located under /var/www/html/clustercontrol and /var/www/html/cmon into somewhere else. Let's prepare the new path first.

Suppose we want to move the UI components to a user directory under /home. Firstly, create the user. In this example, the user name is "cc":

$ useradd -m cc

The above command will automatically create a home directory for user "cc", under /home/cc. Then, create the necessary directories for Apache usage for this user. We are going to create a directory called "logs" for Apache logs, "public_html" for Apache document root of this user and the "www" as a symbolic link to the public_html:

$ cd /home/cc

$ mkdir logs

$ mkdir public_html

$ ln -sf public_html www

Make sure all of them are owned by Apache:

$ chown apache:apache logs public_html

To allow Apache process to access public_html under user cc, we have to allow global read to the home directory of user cc:

$ chmod 755 /home/cc

We are now good to move stuff.

Customizing the Path

Stop ClusterControl related services and Apache:

$ systemctl stop httpd # RHEL/CentOS

$ systemctl stop apache2 # Debian/Ubuntu

$ systemctl stop cmon cmon-events cmon-ssh cmon-cloud

We basically have two options in moving the directory into the user's directory:

  1. Move everything from /var/www/html into /home/cc/public_html.
  2. Create a symbolic link from /var/www/html/clustercontrol to /home/cc/public_html (recommended).

If you opt for option #1, simply move the ClusterControl UI directories into the new path,/home/cc/public_html:

$ mv /var/www/html/clustercontrol /home/cc/public_html/

$ mv /var/www/html/cmon /home/cc/public_html/

Make sure the ownership is correct:

$ chown -R apache:apache /home/cc/public_html # RHEL/CentOS

$ chown -R www-data:www-data /home/cc/public_html # Debian/Ubuntu

However, there is a drawback since ClusterControl UI package will always get extracted under /var/www/html. This means if you upgrade the ClusterControl UI via package manager, the new content will be available under /var/www/html. Refer to "Potential Issues" section further down for more details.

If you choose option #2, which is the recommended way, you just need to create a symlink (link reference to another file or directory) under the user's public_html directory for both directories. When an upgrade happens, the DEB/RPM postinst script will replace the existing installation with the updated version under /var/www/html. To do a symlink, simply:

$ ln -sf /var/www/html/clustercontrol /home/cc/public_html/clustercontrol

$ ln -sf /var/www/html/cmon /home/cc/public_html/cmon

Another step is required for option #2, where we have to allow Apache to follow symbolic links outside of the user's directory. Create a .htaccess file under /home/cc/public_html and add the following line:

# /home/cc/public_html/.htaccess

Options +FollowSymlinks -SymLinksIfOwnerMatch

Open Apache site configuration file at /etc/httpd/conf.d/s9s.conf (RHEL/CentOS) or /etc/apache2/sites-enabled/001-s9s.conf (Debian/Ubuntu) using your favourite text editor and modify it to be as below (pay attention on lines marked with ##):

<VirtualHost *:80>

    ServerName cc.domain.com  ## 


    ServerAdmin webmaster@cc.domain.com

    DocumentRoot /home/cc/public_html  ##


    ErrorLog /home/cc/logs/error.log  ##

    CustomLog /home/cc/logs/access.log combined  ##


    # ClusterControl SSH

    RewriteEngine On

    RewriteRule ^/clustercontrol/ssh/term$ /clustercontrol/ssh/term/ [R=301]

    RewriteRule ^/clustercontrol/ssh/term/ws/(.*)$ ws://127.0.0.1:9511/ws/$1 [P,L]

    RewriteRule ^/clustercontrol/ssh/term/(.*)$ http://127.0.0.1:9511/$1 [P]

    RewriteRule ^/clustercontrol/sse/events/(.*)$ http://127.0.0.1:9510/events/$1 [P,L]


    # Main Directories

    <Directory />

            Options +FollowSymLinks

            AllowOverride All

    </Directory>

    <Directory /home/cc/public_html>  ##

            Options +Indexes +FollowSymLinks +MultiViews

            AllowOverride All

            Require all granted

    </Directory>

</VirtualHost>

The similar modifications apply to the HTTPS configuration at /etc/httpd/conf.d/ssl.conf (RHEL/CentOS) or /etc/apache2/sites-enabled/001-s9s-ssl.conf (Debian/Ubuntu). Pay attention to lines marked with ##:

<IfModule mod_ssl.c>

        <VirtualHost _default_:443>

                ServerName cc.domain.com  ##

                ServerAdmin webmaster@cc.domain.com ##


                DocumentRoot /home/cc/public_html  ##


                # ClusterControl SSH

                RewriteEngine On

                RewriteRule ^/clustercontrol/ssh/term$ /clustercontrol/ssh/term/ [R=301]

                RewriteRule ^/clustercontrol/ssh/term/ws/(.*)$ ws://127.0.0.1:9511/ws/$1 [P,L]

                RewriteRule ^/clustercontrol/ssh/term/(.*)$ http://127.0.0.1:9511/$1 [P]

                RewriteRule ^/clustercontrol/sse/events/(.*)$ http://127.0.0.1:9510/events/$1 [P,L]


                <Directory />

                        Options +FollowSymLinks

                        AllowOverride All

                </Directory>

                <Directory /home/cc/public_html>  ##

                        Options +Indexes +FollowSymLinks +MultiViews

                        AllowOverride All

                        Require all granted

                </Directory>


                SSLEngine on

     SSLCertificateFile /etc/pki/tls/certs/s9server.crt # RHEL/CentOS

     SSLCertificateKeyFile /etc/pki/tls/private/s9server.key # RHEL/CentOS

     SSLCertificateKeyFile /etc/ssl/certs/s9server.crt # Debian/Ubuntu

     SSLCertificateKeyFile /etc/ssl/private/s9server.key # Debian/Ubuntu


                <FilesMatch "\.(cgi|shtml|phtml|php)$">

                                SSLOptions +StdEnvVars

                </FilesMatch>

                <Directory /usr/lib/cgi-bin>

                                SSLOptions +StdEnvVars

                </Directory>


                BrowserMatch "MSIE [17-9]" ssl-unclean-shutdown


        </VirtualHost>

</IfModule>

Restart everything:

$ systemctl restart httpd

$ systemctl restart cmon cmon-events cmon-ssh cmon-cloud

Consider the IP address of the ClusterControl is 192.168.1.202 and domain cc.domain.com resolves to 192.168.1.202, you can access ClusterControl UI via one of the following URLs:

You should see the ClusterControl login page at this point. The customization is now complete.

Potential Issues

Since the package manager simply executes the post-installation script during package upgrade, the content of the new ClusterControl UI package (the actual package name is clustercontrol.x86_64) will be extracted into /var/www/html (it's hard coded inside post installation script). The following is what would happen:

$ ls -al /home/cc/public_html

clustercontrol

cmon

$ ls -al /var/www/html # empty

$ yum upgrade clustercontrol -y

$ ls -al /var/www/html # new files are extracted here

clustercontrol

cmon

Therefore, if you use symlink method, you may skip the following additional steps.

To complete the upgrade process, one has to replace the existing installation under the custom path with the new installation manually. First, perform the upgrade operation:

$ yum upgrade clustercontrol -y # RHEL/CentOS

$ apt upgrade clustercontrol -y # Debian/Ubuntu

Move the existing installation to somewhere safe. We will need the old bootstrap.php file later on:

$ mv /home/cc/public_html/clustercontrol /home/cc/public_html/clustercontrol_old

Move the new installation from the default path /var/www/html into user's document root:

$ mv /var/www/html/clustercontrol /home/cc/public_html

Copy bootstrap.php from the old installation to the new one:

$ mv /home/cc/public_html/clustercontrol_old/bootstrap.php /home/cc/public_html/clustercontrol

Get the new version string from bootstrap.php.default:

$ cat /home/cc/public_html/clustercontrol/bootstrap.php.default | grep CC_UI_VERSION

define('CC_UI_VERSION', '1.7.4.6537-#f427cb');

Update the new version string for CC_UI_VERSION value inside bootstrap.php using your favourite text editor:

$ vim /home/cc/public_html/clustercontrol/bootstrap.php

Save the file and the upgrade is now complete.

That's it, folks. Happy customizing!


ClusterControl Takes the Spotlight as Top IT Management Software; Chosen as Rising Star of 2019 by B2B Review Platform

$
0
0

ClusterControl is all about delivering robust, open source, database management for the IT management needs of our clients. This goal drives us every day, so much so that it lead us to receive two awards recently from CompareCamp: the Rising Star of 2019 Award and the Great User Experience Award.

CompareCamp is a B2B Review Platform that delivers credible SaaS reviews and updated technology news from industry experts. Thousands of users rely on CompareCamp reviews that detail the pros and cons of software from different industries. 

ClusterControl was given the Great User Experience Award because it effectively boosted users’ rate of productivity through highly secured tools for real-time monitoring, failure detection, load balancing, data migrating, and automated recovery. Our dedicated features for node recovery, SSL encryption, and performance reporting received raves from experts.

We also received the Rising Star of 2019 Award due to our initial review and being a highly recommended IT management software by CompareCamp. 

To read the full review, please visit CompareCamp.

Using Database Backup Advisors to Automate Maintenance Tasks

$
0
0

A disaster usually causes an outage, which means system downtime and potential loss of data. Once we have detected the blackout, we trigger our DR plan to recover from it. But it would be a surprise, if there is no backup, or after long hours of recovery, you see it's not the one you need. 

While outages can be costly - there is often a financial impact  which can be harmful to the business and data loss may be a reason to close the company. 

To minimize data loss, we need to have multiple copies of data in various places. We can design our infrastructure in different layers and abstract each layer from the one below it. For instance, we build a layer for clusters of database instances to protect against hardware failure. We replicate databases across datacenters so we can defend ourselves against a data center failure. Every additional layer adds complexity, which can become a nightmare to manage. But still, in essence, a backup will take the central place in the disaster recovery.

That's why it's crucial to be sure it's something we can rely on. But how to achieve this? Well, one of the options is to verify if backups were executed based on the last few lines of backup script. 

A simple example:

#!/bin/sh

mysqldump -h 192.168.1.1 -u user -ppassword dbname > filename.sql


if [ "$?" -eq 0 ]; then

    echo "Success."

else

    echo "Error."

fi

But what if the backup script did  not start at all? Google offers quite a bit of search results for "Linux cron, not running." 

Unfortunately, open-source databases often do not offer backup repository. 

Another backup testing. You may have heard  about Schrödinger's cat.  A known Schrödinger's Backup theory is . "The condition of any backup is unknown until a restore is attempted." Sounds like a simple approach but such an attempt would mean you have to set up a test environment, copy files run restore ... after every backup. 

In this article, we will see how you can use ClusterControl to make sure your backup is executed  to achieve Enterprise-Grade databases with Open Source Databases.

Backup Reports

ClusterControl has been aimed at operational reports. Operational Reporting provides support to day-to-day enterprise activity monitoring and control. The backup report is one of many. You can find reports like:

  • Daily System Report
  • Package Upgrade Report
  • Schema Change Report
  • Availability 
  • Backup
Create Operational Report

But why you would need this?

You may already have an excellent monitoring tool with all possible metrics/graphs and you probably have also set up alerts based on metrics and thresholds (some will even have automated advisors providing them recommendations or fixing things automatically.) That's good - having visibility into your system is important; nevertheless, you need to be able to process a lot of information.

ClusterControl Backup Report

How does this work? ClusterControl collects information on the backup process, the systems, platforms, and devices in the backup infrastructure when the backup job is triggered. All of that information is aggregated and stored in a CMON (internal database), so there is no need to query particular databases additionally. Additionally, when it discovers that you have a running cluster, but there was no backup, it will be reported too.

In the report details, you can track a  backup ID with detailed data about the location, size, time, and backup method. Templates work with data for different database types, so when you manage your mixed environment, you will get the same feel and look. It helps to manage different database backups better.

CLI Reports

For those who prefer the command-line interface, a good option to track backups ClusterControl Command Line Interface (CLI).

CLI lets you execute most of the functions available within ClusterControl using simple commands. Backup execution and backup reports are one of them. 

Used in conjunction with the powerful GUI, it gives ClusterControl users alternative ways to manage their open-source database environments using whatever engine they prefer.

$ s9s backup --list --cluster-id=1 --long --human-readable

ID CID STATE     OWNER HOSTNAME CREATED  SIZE FILENAME

 1   1 COMPLETED dba   10.0.0.5 07:21:39 252K mysqldump_2017-05-09_072135_mysqldb.sql.gz

 1   1 COMPLETED dba   10.0.0.5 07:21:43 1014 mysqldump_2017-05-09_072135_schema.sql.gz

 1   1 COMPLETED dba   10.0.0.5 07:22:03 109M mysqldump_2017-05-09_072135_data.sql.gz

 1   1 COMPLETED dba   10.0.0.5 07:22:07 679 mysqldump_2017-05-09_072135_triggerseventsroutines.sql.gz

 2   1 COMPLETED dba   10.0.0.5 07:30:20 252K mysqldump_2017-05-09_073016_mysqldb.sql.gz

 2   1 COMPLETED dba   10.0.0.5 07:30:24 1014 mysqldump_2017-05-09_073016_schema.sql.gz

 2   1 COMPLETED dba   10.0.0.5 07:30:44 109M mysqldump_2017-05-09_073016_data.sql.gz

 2   1 COMPLETED dba   10.0.0.5 07:30:49 679 mysqldump_2017-05-09_073016_triggerseventsroutines.sql.gz

Beginning from version 1.4.1, the installer script will automatically install this package on the ClusterControl node. CLI is part of s9s-tools package. You can also install it separately on a different machine to manage the database cluster remotely. Similar to ClusterControl it uses secure SSH communication. 

Automatic Backup Verification

A backup is not a backup if we are not able to retrieve the data. Verifying backups is something that is usually overlooked by many companies. Let’s see how ClusterControl can automate the verification of backups and help avoid any surprises.

In ClusterControl, select your cluster and go to the "Backup" section, then, select “Create Backup”.

The automatic verify backup feature is available for the scheduled backups so, let’s choose the “Schedule Backup” option.

When scheduling a backup, in addition to selecting the common options like method or storage, we also need to specify schedule/frequency. In this example, we are going to setup MySQL backup verification. However the same can be achieved for PostgreSQL and Timescale databases. 

When backup verification is checked another tab will appear.

Here we can set all the necessary steps to prepare the environment. When IP is provided we are good to go and schedule such backup. Whenever backup finishes it will be copied to a temporary backup verification environment (“restore backup on” option).  After successful refresh, you will see the status of verification in the backup repository tab. 

Failed Backup Executions and Integration Services

Another interesting option to get more clues about backup execution is to use ClusterControl Integration services. You can control the backup execution status with third-party services.

Third-party tools integration enables you to automate alerts with other popular systems. Currently, ClusterControl supports ServiceNow, PagerDuty, VictorOps, OpsGenie, Slack, Telegram, and Webhooks. 

ClusterControl Integration Services

Below we can see an example of Slack channel integration. Whenever a backup event occurs it will appear in the slack channel.  

ClusterControl Integration Services

Conclusion

Backups are mandatory in any environment. They help you protect your data and are in the center of any disaster recovery scenario. ClusterControl can help automate the backup process for your databases and, in case of failure, restore it with a few clicks. Also, you can be sure they are executed successfully and reliable so in case of disaster, you will not lose your data.

Creating a Cold Standby for PostgreSQL Using Amazon AWS

$
0
0

The need to achieve database High Availability is a pretty common task, and often a must. If your company has a limited budget, then maintaining a replication slave (or more than one) that is running on the same cloud provider (just waiting if it’s needed someday) can be expensive. Depending on the type of application, there are some cases where a replication slave is necessary to improve the RTO (Recovery Time Objective).

There is another option, however, if your company can accept a short delay to get your systems back online.

Cold Standby, is a redundancy method where you have a standby node (as a backup) for the primary one. This node is only used during a master failure. The rest of the time the cold standby node is shut down and only used to load a backup when needed.

To use this method,  it’s necessary to have a predefined backup policy (with redundancy) according to an acceptable RPO (Recovery Point Objective) for the company. It may be that losing 12 hours of data is acceptable for the business or losing just one hour could be a big problem. Every company and application must determine their own standard.

In this blog, you’ll learn you how to create a backup policy and how to restore it to a Cold Standby Server using ClusterControl and its integration with Amazon AWS.

For this blog, we’ll assume that you already have an AWS account and ClusterControl installed. While we’re going to use AWS as the cloud provider in this example, you can use a different one. We’ll use the following PostgreSQL topology deployed using ClusterControl:

  • 1 PostgreSQL Primary Node
  • 2 PostgreSQL Hot-Standby Nodes
  • 2 Load Balancers (HAProxy + Keepalived)
ClusterControl Topology View Section

Creating an Acceptable Backup Policy

The best practice for creating this type of policy is to store the backup files in three different places, one stored locally on the database server (for faster recovery), another one in a centralized backup server, and the last one in the cloud. 

You can improve on this by also using full, incremental and differential backups. With ClusterControl you can perform all the above best practices, all from the same system, with a friendly and easy to use UI. Let’s start by creating the AWS integration in ClusterControl.

Configuring the ClusterControl AWS Integration

Go to ClusterControl -> Integrations -> Cloud Providers -> Add Cloud Credentials.

Choose a cloud provider. We support AWS, Google Cloud or Azure. In this case, chose AWS and continue.

Here you need to add a Name, a Default region, and an AWS key ID and key secret. To get or create these last ones, you should go to the IAM (Identity and Access Management) section on the AWS management console. For more information, you can refer to our documentation or AWS documentation.

Now you have the integration created, let’s go to schedule the first backup using ClusterControl.

Scheduling a Backup with ClusterControl

Go to ClusterControl -> Select the PostgreSQL Cluster -> Backup -> Create Backup.

You can choose if you want to create a single backup instantly or schedule a new backup. So, let’s choose the second option and continue.

When you’re scheduling a backup, first, you need to specify schedule/frequency. Then, you must choose a backup method (pg_dumpall, pg_basebackup, pgBackRest), the server from which the backup will be taken, and where you want to store the backup. You can also upload our backup to the cloud (AWS, Google or Azure) by enabling the corresponding button.

Then specify the use of compression, the compression level, encryption and retention period for your backup. There is another feature called “Verify Backup” that you’ll see more in detail soon in this blog post.

If the “Upload Backup to the cloud” option was enabled, you’ll see this step where you must select the cloud credentials, and create or select an S3 bucket where to store the backup. You must also specify the retention period.

Now you’ll have the scheduled backup in the ClusterControl Schedule Backups section. To cover the best practices mentioned earlier, you can schedule a backup to store it into an external server (ClusterControl server) and in the cloud, and then schedule another backup to store it locally in the database node for a faster recovery.

Restoring a Backup on Amazon EC2

Once the backup is finished, you can restore it by using ClusterControl in the Backup section. 

Creating the Amazon EC2 Instance

First of all, to restore it, you’ll need somewhere to do it, so let’s create a basic Amazon EC2 instance. Go to” Launch Instance” in the AWS management console in the EC2 section, and configure your instance.

When your instance is created, you’ll need to copy the SSH public key from the ClusterControl server. 

Restoring the Backup Using ClusterControl

Now you have the new EC2 instance, let’s use it to restore the backup there. For this, in your ClusterControl go to the backup section (ClusterControl -> Select Cluster -> Backup), and there you can select "Restore Backup", or directly "Restore" on the backup that you want to restore.

You have three options to restore the backup. You can restore the backup in an existing database node, restore and verify the backup on a standalone host or create a new cluster from the backup. As you want to create a cold standby node, let’s use the second option “Restore and Verify on standalone host”.

You’ll need a dedicated host (or VM) that is not part of the cluster to restore the backup, so let’s use the EC2 instance created for this job. ClusterControl will install the software and it’ll restore the backup in this host. 

If the option “Shutdown the server after the backup has been restored” is enabled, ClusterControl will stop the database node after finishing the restore job, and that is exactly what we need for this cold standby creation.

You can monitor the backup progress in the ClusterControl Activity section.

Using the ClusterControl Verify Backup Feature

A backup is not a backup if it's not restorable. So, you should make sure that the backup is working and restore it in the cold standby node frequently.

This ClusterControl Verify Backup backup feature is a way to automate the maintenance of a cold standby node restoring a recent backup to keep this as up-to-date as possible avoiding the manual restore backup job. Let’s see how it works.

As the “Restore and Verify on standalone host” task, it’ll require a dedicated host (or VM) that is not part of the cluster to restore the backup, so let’s use the same EC2 instance here.

The automatic verify backup feature is available for the scheduled backups. So, go to ClusterControl -> Select the PostgreSQL Cluster -> Backup -> Create Backup and repeat the steps that you saw earlier to schedule a new backup.

In the second step, you will have the “Verify Backup” feature available to enable it.

Using the above options, ClusterControl will install the software and restore the backup on the host. After restoring it, if everything went fine, you will see the verification icon in the ClusterControl Backup section.

Conclusion

If you have a limited budget, but require High Availability, you can use a cold standby PostgreSQL node that could be valid or not depending on the RTO and RPO of the company. In this blog, we showed you how to schedule a backup (according to your business policy) and how to restore it manually. We also showed how to restore the backup automatically in a Cold Standby Server using ClusterControl, Amazon S3, and Amazon EC2.

Handling Replication Issues from non-GTID to GTID MariaDB Database Clusters

$
0
0

We recently ran into an interesting customer support case involving a MariaDB replication setup. We spent a lot of time researching this problem and thought it would be worth sharing this with you in this blog post.

Customer’s Environment Description

The issue was as follows: an old (pre 10.x) MariaDB server was in use and an attempt was made to migrate data from it into more recent MariaDB replication setup. This resulted in issues with using Mariabackup to rebuild slaves in the new replication cluster. For the purpose of the tests we recreated this behavior in the following environment:

The data has been migrated from 5.5 to 10.4 using mysqldump:

mysqldump --single-transaction --master-data=2 --events --routines sbtest > /root/dump.sql

This allowed us to collect master binary log coordinates and the consistent dump. As a result, we were able to provision MariaDB 10.4 master node and set up the replication between old 5.5 master and new 10.4 node. The traffic was still running on 5.5 node. 10.4 master was generating GTID’s as it had to replicate data to 10.4 slave. Before we dig into details, let's take a quick look into how GTID’s work in MariaDB.

MariaDB and GTID

For starters, MariaDB uses a different format of the GTID than Oracle MySQL. It consists of three numbers separated by dashes:

0 - 1 - 345

First is a replication domain, which allows for multi-source replication to be properly handled. This is not relevant to our case as all the nodes are in the same replication domain. Second number is the server ID of the node that generated the GTID. Third one is the sequence number - it monotonically increases with every event stored in the binary logs.

MariaDB uses several variables to store the information about GTID’s executed on a given node. The most interesting for us are:

Gtid_binlog_pos - as per the documentation, this variable is the GTID of the last event group written to the binary log.

Gtid_slave_pos - as per the documentation, this system variable contains the GTID of the last transaction applied to the database by the server's slave threads.

Gtid_current_pos - as per the documentation, this system variable contains the GTID of the last transaction applied to the database. If the server_id of the corresponding GTID in gtid_binlog_pos is equal to the servers own server_id, and the sequence number is higher than the corresponding GTID in gtid_slave_pos, then the GTID from gtid_binlog_pos will be used. Otherwise the GTID from gtid_slave_pos will be used for that domain.

So, to make it clear, gtid_binlog_pos stores GTID of the last locally executed event. Gtid_slave_pos stores GTID of the event executed by the slave thread and gtid_current_pos shows either the value from gtid_binlog_pos, if it has the highest sequence number and it has server-id or gtid_slave_pos if it has the highest sequence. Please keep this in your mind.

An Overview of the Issue

The initial state of the relevant variables are on 10.4 master:

MariaDB [(none)]> show global variables like '%gtid%';

+-------------------------+----------+

| Variable_name           | Value |

+-------------------------+----------+

| gtid_binlog_pos         | 0-1001-1 |

| gtid_binlog_state       | 0-1001-1 |

| gtid_cleanup_batch_size | 64       |

| gtid_current_pos        | 0-1001-1 |

| gtid_domain_id          | 0 |

| gtid_ignore_duplicates  | ON |

| gtid_pos_auto_engines   | |

| gtid_slave_pos          | 0-1001-1 |

| gtid_strict_mode        | ON |

| wsrep_gtid_domain_id    | 0 |

| wsrep_gtid_mode         | OFF |

+-------------------------+----------+

11 rows in set (0.001 sec)

Please note gtid_slave_pos which, theoretically, doesn’t make sense - it came from the same node but via slave thread. This could happen if you make a master switch before. We did just that - having two 10.4 nodes we switched the masters from host with server ID of 1001 to host with server ID of 1002 and then back to 1001.

Afterwards we configured the replication from 5.5 to 10.4 and this is how things looked like:

MariaDB [(none)]> show global variables like '%gtid%';

+-------------------------+-------------------------+

| Variable_name           | Value |

+-------------------------+-------------------------+

| gtid_binlog_pos         | 0-55-117029 |

| gtid_binlog_state       | 0-1001-1537,0-55-117029 |

| gtid_cleanup_batch_size | 64                      |

| gtid_current_pos        | 0-1001-1 |

| gtid_domain_id          | 0 |

| gtid_ignore_duplicates  | ON |

| gtid_pos_auto_engines   | |

| gtid_slave_pos          | 0-1001-1 |

| gtid_strict_mode        | ON |

| wsrep_gtid_domain_id    | 0 |

| wsrep_gtid_mode         | OFF |

+-------------------------+-------------------------+

11 rows in set (0.000 sec)

As you can see, the events replicated from MariaDB 5.5, they all have been accounted for in gtid_binlog_pos variable: all events with server ID of 55. This results in a serious issue. As you may remember, gtid_binlog_pos should contain events executed locally on the host. Here it contains events replicated from another server with different server ID.

This makes things dicey when you want to rebuild the 10.4 slave, here’s why. Mariabackup, just like Xtrabackup, works in a simple way. It copies the files from the MariaDB server while scanning redo logs and storing any incoming transactions. When the files have been copied, Mariabackup would freeze the database using either FLUSH TABLES WITH READ LOCK or backup locks, depending on the MariaDB version and the availability of the backup locks. Then it reads the latest executed GTID and stores it alongside the backup. Then the lock is released and backup is completed. The GTID stored in the backup should be used as the latest executed GTID on a node. In case of rebuilding slaves it will be put as a gtid_slave_pos and then used to start the GTID replication. This GTID is taken from gtid_current_pos, which makes perfect sense - after all it is the “GTID of the last transaction applied to the database”. Acute reader can already see the problem. Let’s show the output of the variables when 10.4 replicates from the 5.5 master:

MariaDB [(none)]> show global variables like '%gtid%';

+-------------------------+-------------------------+

| Variable_name           | Value |

+-------------------------+-------------------------+

| gtid_binlog_pos         | 0-55-117029 |

| gtid_binlog_state       | 0-1001-1537,0-55-117029 |

| gtid_cleanup_batch_size | 64                      |

| gtid_current_pos        | 0-1001-1 |

| gtid_domain_id          | 0 |

| gtid_ignore_duplicates  | ON |

| gtid_pos_auto_engines   | |

| gtid_slave_pos          | 0-1001-1 |

| gtid_strict_mode        | ON |

| wsrep_gtid_domain_id    | 0 |

| wsrep_gtid_mode         | OFF |

+-------------------------+-------------------------+

11 rows in set (0.000 sec)

Gtid_current_pos is set to 0-1001-1. This is definitely not the correct moment in time, it’s taken from gtid_slave_pos while we have a bunch of transactions that came from 5.5 after that. The problem is that those transactions are stored as gtid_binlog_pos. On the other hand gtid_current_pos is calculated in a way that it requires local server ID for GTID’s in gitd_binlog_pos before they can be used as the gtid_current_pos. In our case they have the server ID of the 5.5 node so they will not be treated properly as events executed on the 10.4 master. After backup restore, if you’d set the slave according to the GTID state stored in the backup, it would end up re-applying all the events that came from 5.5. This, obviously, would break the replication.

The Solution

A solution to this problem is to take several additional steps:

  1. Stop the replication from 5.5 to 10.4. Run STOP SLAVE on 10.4 master
  2. Execute any transaction on 10.4 - CREATE SCHEMA IF NOT EXISTS bugfix - this will change the GTID situation like this:
MariaDB [(none)]> show global variables like '%gtid%';

+-------------------------+---------------------------+

| Variable_name           | Value   |

+-------------------------+---------------------------+

| gtid_binlog_pos         | 0-1001-117122   |

| gtid_binlog_state       | 0-55-117121,0-1001-117122 |

| gtid_cleanup_batch_size | 64                        |

| gtid_current_pos        | 0-1001-117122   |

| gtid_domain_id          | 0   |

| gtid_ignore_duplicates  | ON   |

| gtid_pos_auto_engines   |   |

| gtid_slave_pos          | 0-1001-1   |

| gtid_strict_mode        | ON   |

| wsrep_gtid_domain_id    | 0   |

| wsrep_gtid_mode         | OFF   |

+-------------------------+---------------------------+

11 rows in set (0.001 sec)

The latest GITD was executed locally, so it was stored as gtid_binlog_pos. As it has the local server ID, it’s picked as the gtid_current_pos. Now, you can take a backup and use it to rebuild slaves off 10.4 master. Once this is done, start the slave thread again.

MariaDB is aware that this kind of bug exists, one of the relevant bug report we found is: https://jira.mariadb.org/browse/MDEV-10279 Unfortunately, there’s no fix so far. What we found is that this issue affects MariaDB up to 5.5. Non-GTID events that come from MariaDB 10.0 are correctly accounted on 10.4 as coming from the slave thread and gtid_slave_pos is properly updated. MariaDB 5.5 is quite an old one (even though it still supported) so you still may see setups running on it and attempts to migrate from 5.5 to more recent, GTID-enabled MariaDB versions. What’s worse, according to the bug report we found, this also affects replication coming from non-MariaDB (one of the comments mentions issue showing up on Percona Server 5.6) servers into MariaDB. 

Anyway, we hope you found this blog post useful and hopefully you will not run into the problem we just described.


Basic Considerations for Taking a MongoDB Backup

$
0
0

Database systems have a responsibility to store and ensure consistent availability of relevant data whenever needed at any time in operation. Most companies fail to continue with business after cases of data loss as a result of a database failure, security bridge, human error or catastrophic failure that may completely destroy the operating nodes in production. Keeping databases in the same data center puts one at high risk of losing all the data in case of these outrages.

Replication and Backup are the commonly used ways of ensuring high availability of data. The selection between the two is dependent on how frequently the data is changing. Backup is best preferred where data is not changing more frequently and no expectation of having so many backup files. On the other end, replication is preferred for frequently changing data besides some other merits associated like serving data in a specific location by reducing the latency of requests. However, both replication and backup can be used for maximum data integrity and consistency during restoration in any case of failure.

Database backups render more advantages besides providing a restoration point to providing basics for creating new environments for development, open access, and staging without tempering with production. The development team can quickly and easily test newly integrated features and accelerate their development. Backups can also be used to the checkpoint for code errors wherever the resulting data is not consistent.

Considerations for Backing Up MongoDB

Backups are created at certain points to reflect (acting as a snapshot of the database) what data the database hosts at that given moment. If the database fails at a given point, we can use the last backup file to roll back the DB to a point before it failed. However, one needs to take into consideration some factors before doing a recovery and they include:

  1. Recovery Point Objective
  2. Recovery Time Objective
  3. Database and Snapshot Isolation
  4. Complications with Sharding
  5. Restoration Process
  6. Performance Factors and Available Storage
  7. Flexibility
  8. Complexity of Deployment

Recovery Point Objective

This is carried out so as to determine how much data you are ready to lose during the backup and restoration process. For example, if we have user data and clickstream data, user data will be given priority over the clickstream analytics since the latter can be regenerated by monitoring operations in your application after restoration. A continuous backup should be preferred for critical data such as bank information, production industry data and communication systems information and should be carried out in close intervals. If the data does not change frequently, it may be less expensive to lose much of it if you do a restored snapshot of for example 6 months or 1 year earlier.

Recovery Time Objective

This is to analyze and determine how quickly the restoration operation can be done. During recovery, your applications will incur some downtime which is also directly proportional to the amount of data that needs to be recovered. If you are restoring a large set of data it will take longer.

Database and Snapshot Isolation

Isolation is a measure of how close backup snapshots are from the primary database servers in terms of logical configuration and physically. If they happen to be close enough, the recovery time reduces at the expense of increased likelihood of being destroyed at the same time the database is destroyed. It is not advisable to host backups and the production environment in the same system so as to avoid any disruption on the servers from mitigating into the backups too. 

Complications with Sharding

For a distributed database system through sharding, some backup complexity is presented and write activities may have to be paused across the whole system. Different shards will finish different types of backups at different times. Considering logical backups and Snapshot backups,

Logical Backups

  • Shards are of different sizes hence will finish at different times
  • MongoDB-base dumps will ignore the --oplog hence won’t be consistent at each shard.
  • The balancer could be off while it is supposed to be on just because some shards maybe have not finished the restoration process

Snapshot Backups

  • Works well for a single replica from versions 3.2 and later. You should, therefore, consider updating your MongoDB version.

Restoration Process

Some people carry out backups without testing if they will work in case of restoration. A backup in essence is to provide a restoration capability otherwise it will render to be useless. You should always try to run the backups at different test servers to see if they are working.

Performance Factors and Available Storage

Backups also tend to take many sizes as the data from the database itself and need to be compressed enough not to occupy a lot of unnecessary space that may cut the overall storage resources of the system. They can be archived into zip files hence reducing their overall sizes. Besides, as mentioned before, one can archive the backups in different datacenters from the database itself. 

Backups may determine different performances of the database in that some could degrade it. In that case, continuous backups will render some setback hence should be converted to scheduled backups to avoid depletion of maintenance windows. In most cases, secondary servers are deployed to support backups. In this case:

  • Single nodes cannot be consistently backed up because MongoDB uses read-uncommitted without an oplog when using the mongodump command and in that case backups will not be safe.
  • Use secondary nodes for backups since the process itself takes time according to the amount of data involved and the applications connected will incur some downtime. If you use the primary which has to also update the Oplogs, then you may lose some data during that downtime
  • The restore process takes a lot of time but the storage resources assigned are tiny.

Flexibility

Many at times you may not want some of the data during backup, as for the example of Recovery Point Objective, one may want the recovery be done and filter out the user clicks data. To do so, you need a Partial backup strategy that will provide the flexibility to filter out the data that you won’t be interested in, hence reduce the recovery duration and resources that would have been wasted. Incremental backup can also be useful such that only data parts that have changed will be backed up from the last snapshot rather than taking entire backups for every snapshot.

Complexity of Deployment

Your backup strategy should be easy to set and maintain with time. You can also schedule your backups so that you don’t need to do them manually whenever you want to.

Conclusion

Database systems guarantee “life after death” if only there is well-established backup up system in place. The database could be destroyed by catastrophic factors, human error or security attacks that can lead to loss or corruption of data. Before doing a backup, one has to consider the type of data in terms of size and importance. It is always not advisable to keep your backups in the same data center as your database so as to reduce the likelihood of the backups being destroyed simultaneously. Backups may alter the performance of the database hence one should be careful about the strategy to use and when to carry out the backup. Do not carry out your backups on the primary node since it may result in system downtime during the backup and consequently loss important data.

Tags: 

Building a Monitoring Pipeline for InfluxDB with Sensu & Grafana

$
0
0

Metrics are at the heart of any good monitoring strategy — including how to collect them, where to send them, and how you visualize that data. In this post, I’ll walk you through building your own open-source monitoring pipeline with Sensu, InfluxDB, and Grafana to monitor performance metrics (specifically, check output metric extraction). While I won’t go into step-by-step installation instructions for each of these tools, I’ll make sure to link out to the proper guides so you can follow along. 

Checking Output Metric Extraction with Sensu

Sensu is an open source monitoring solution that integrates with a wide ecosystem of complementary tooling (including InfluxDB and Grafana). Sensu Go is the latest and greatest version of Sensu — it’s designed to be more portable, faster to deploy, and (even more) friendly to containerized and ephemeral environments. To try it out (and get started quickly so you can follow along), download the Sensu sandbox. The Sensu sandbox comes pre-loaded with Sensu and related services up and running so you can skip the basic install steps and just focus on learning how to monitor performance metrics.

Here’s what we’ll be doing with our metrics:

Getting the Sandbox Setup

First off, we’ll collect metrics using the aforementioned Sensu check output metric extraction. To get started, you’ll need to spin up your Sensu backend, agent, and CLI (sensuctl is our command-line tool for managing resources within Sensu — see this guide for more info). Below I’ll give the commands necessary to get things up and running inside the sandbox. If you aren’t using the sandbox you’ll be able to still follow along with some minor changes to your commands.

Start up the sandbox:

ENABLE_SENSU_SANDBOX_PORT_FORWARDING=1 vagrant up

This will enable port forwarding for services running inside the sandbox so you can access them from the host machine.
Enter the sandbox:

vagrant ssh

Start backend inside the sandbox:

sudo systemctl start sensu-backend

Start agent inside the sandbox:

sudo systemctl start sensu-agent

Configure CLI (if you’re not using the sandbox):

sensuctl configure

Confirm the Sensu agent is running

sensuctl entity list

You should see a listing for sensu-go-sandbox

Collecting Metrics

Now that you have Sensu running in the sandbox, it’s time to create a check and configure it to extract metrics. The script I’m using in our examples is system-profile-linux, which prints metrics in Graphite Plaintext Format, but Sensu supports several other formats. Another note worth calling out: the example command is only compatible with Linux, because that’s what the Sensu sandbox is using, but Sensu works with several operating systems (including OSX, Windows, and Docker). If you’re using another OS, you’ll have to adjust your check commands to make sure they’re compatible. The main thing we want is for the check command to print at least one metric in the specific output-metric-format

First let’s add the system-profile-linux asset to our system by making use of sensuctl’s Bonsai integration (introduced in Sensu Go 5.14).

sensuctl asset add sensu/system-profile-linux  

We’ll be referencing that asset definition to ensure system-profile-linux asset is downloaded by the Sensu agent running the metrics collection check.

sensuctl check create collect-metrics --command system-profile-linux \

--interval 10 --subscriptions entity:sensu-go-sandbox \

--output-metric-format graphite_plaintext \

--runtime-assets sensu/system-profile-linux

After the check executes, enter the following to make sure that the check passed with a 0 status. Since the metrics are not stored in Sensu, you can validate that the metrics have been extracted properly by using a debug handler  — check out this guide for an example.

sensuctl event info sensu-go-sandbox collect-metrics --format json

Transforming Metrics

Now it’s time to handle the events we’ve received from our checks and metrics! I wrote the sensu-influxdb-handler to transform any metrics in a Sensu event to send to InfluxDB and it’s available in the Bonsai asset index here. Instead of downloading it manually and installing it into the sandbox, you can add it to our Sensu assets with sensuctl:

sensuctl asset add sensu/sensu-influxdb-handler  

And then reference that new asset in an InfluxDB handler definition:

sensuctl handler create sensu-influxdb-handler --command \

"sensu-influxdb-handler --addr http://localhost:8086 --username sensu \

--password sandbox --db-name sensu --type pipe \
--runtime-assets sensu/sensu-influxdb-handler"

Now assign the handler to the check we created earlier:

sensuctl check set-output-metric-handlers \

collect-metrics sensu-influxdb-handler

Recording Metrics

In order to record all these metrics, you’ll want to have the InfluxDB daemon running on the configured address for the database and credentials recorded in your handler command (above).

Note: the handler above is using the addr, username, password, and db-name configuration appropriate for the InfluxDB setup and running locally in the Sensu sandbox. If you want to route the metrics to a different InfluxDB database, just edit the handler command definition accordingly. The sandbox also comes with the influxd tool, so that you can easily query InfluxDB to make sure that the metrics were handled and recorded.

Visualizing Metrics

It’s time to visualize the data you’ve collected. If you are running Grafana outside of the sandbox, make sure to check the Grafana configuration file you are using has no port collisions with Sensu (such as port 3000), then start your Grafana server. Sensu sandbox users should have access to a running Grafana service all ready, accessible from the sandbox host at http://localhost:4002 (if you have enabled port forwarding when creating the sandbox).

Don’t forget to customize your dashboard based on the output from your check. You can also use this dashboard configuration I created. You’ll also need to connect the InfluxDB data source in your Grafana dashboard — check out this guide to learn how. If all goes to plan, you should be able to see the metrics being collected, like in the example dashboards below.

I hope this was a helpful guide to getting started building your own open-source monitoring pipeline. Questions, comments, or feedback? Find me on Twitter or in the Sensu Community. Thanks for reading, and happy monitoring! 


PostgreSQL Database Monitoring: Tips for What to Monitor

$
0
0

Once you have your database infrastructure up-and-running, you’ll need to keep tabs on what’s happening. Monitoring is a must if you want to be sure everything is going fine or if you might need to change something.

For each database technology there are several things to monitor. Some of these are specific to the database engine or the vendor or even the specific version that you’re using.

In this blog, we’ll take a look at what you need to monitor in a PostgreSQL environment.

What to Monitor in PostgreSQL

When monitoring a database cluster or node, there are two main things to take into account: the operating system and the database itself. You will need to define which metrics you are going to monitor from both sides and how you are going to do it. You need to monitor the metric always in the context of your system, and you should look for alterations on the behavior pattern.

In most cases, you will need to use several tools (as it is nearly impossible to find one to cover all the desired metrics.) 

Keep in mind that when one of your metrics is affected, it can also affect others, making troubleshooting of the issue more complex. Having a good monitoring and alerting system is important to making this task as simple as possible.

Operating System Monitoring

One important thing (which is common to all database engines and even to all systems) is to monitor the Operating System behavior. Here are some points to check here.

CPU Usage

Excessive percentage of CPU usage could be a problem if it’s not usual behavior. In this case, is important to identify the process/processes that are generating this issue. If the problem is the database process, you will need to check what is happening inside the database.

RAM Memory or SWAP Usage

If you’re seeing a high value for this metric and nothing had changed in your system, you probably need to check your database configuration. Parameters like shared_buffers and work_mem can affect this directly as they define the amount of memory to be able to use for the PostgreSQL database.

Disk Usage

An abnormal increase in the use of disk space or an excessive disk access consumption are important things to monitor as you could have a high number of errors logged in the PostgreSQL log file or a bad cache configuration that could generate an important disk access consumption instead of using memory to process the queries.

Load Average

It’s related to the three points mentioned above. A high load average could be generated by an excessive CPU, RAM or disk usage.

Network

A network issue can affect all the systems as the application can’t connect (or connect losing packages) to the database, so this is an important metric to monitor indeed. You can monitor latency or packet loss, and the main issue could be a network saturation, a hardware issue or just a bad network configuration.

PostgreSQL Database Monitoring

Monitoring your PostgreSQL database is not only important to see if you’re having an issue, but also to know if you need to change something to improve your database performance, that is probably one of the most important things to monitor in a database. Let’s see some metrics that are important for this.

Query Monitoring

By default, PostgreSQL is configured with compatibility and stability in mind, so you need to know your queries and his pattern, and configure your databases depending on the traffic that you have. Here, you can use the EXPLAIN command to check the query plan for a specific query, and you can also monitor the amount of SELECT, INSERT, UPDATE or DELETEs on each node. If you have a long query or a high number of queries running at the same time, that could be a problem for all the systems.

Monitoring Active Sessions

You should also monitor the number of active sessions. If you are near the limit, you need to check if something is wrong or if you just need to increment the max_connections value. The difference in the number can be an increase or decrease of connections. Bad usage of connection pooling, locking or network issue are the most common problems related to the number of connections.

Database Locks

If you have a query waiting for another query, you need to check if that another query is a normal process or something new. In some cases, if somebody is making an update on a big table, for example, this action can be affecting the normal behavior of your database, generating a high number of locks.

Monitoring Replication

The key metrics to monitor for replication are the lag and the replication state. The most common issues are networking issues, hardware resource issues, or under dimensioning issues. If you are facing a replication issue you will need to know this asap as you will need to fix it to ensure the high availability environment.

Monitoring Backups

Avoiding data loss is one of the basic DBA tasks, so you don’t only need to take the backup, you should know if the backup was completed, and if it’s usable. Usually, this last point is not taken into account, but it’s probably the most important check in a backup process.

Monitoring Database Logs

You should monitor your database log for errors like FATAL or deadlock, or even for common errors like authentication issues or long-running queries. Most of the errors are written in the log file with detailed useful information to fix it.

Impact of Monitoring on PostgreSQL Database Performance

While monitoring is a must, it’s not typically free. There is always a cost on the database performance, depending on how much you are monitoring, so you should avoid monitoring things that you won’t use.

In general, there are two ways to monitor your databases, from the logs or from the database side by querying.

In the case of logs, to be able to use them, you need to have a high logging level, which generates high disk access and it can affect the performance of your database.

For the querying mode, each connection to the database uses resources, so depending on the activity of your database and the assigned resources, it may affect the performance too.

PostgreSQL Monitoring Tools

There are several tool options for monitoring your database. It can be a built-in PostgreSQL tool, like extensions, or some external tool. Let’s see some examples of these tools.

Extensions

  • Pg_stat_statements: This extension will help you know the query profile of your database. It tracks all the queries that are executed and stores a lot of useful information in a table called pg_stat_statements. By querying this table you can get what queries are run in the system, how many times they have run, and how much time they have consumed, among other information.
  • Pgbadger: It’s a software that performs an analysis of PostgreSQL logs and displays them in an HTML file. It helps you to understand the behavior of your database and identify which queries need to be optimized. 
  • Pgstattuple: It can generate statistics for tables and indexes, showing how much space used by each table and index, is consumed by live tuples, deleted tuples or how much-unused space is available in each relation.
  • Pg_buffercache: With this, you can check what's happening in the shared buffer cache in real-time, showing how many pages are currently held in the cache.

External Monitoring Tools

  • ClusterControl: It’s a management and monitoring system that helps to deploy, manage, monitor and scale your databases from a friendly interface. ClusterControl has support for the top open-source database technologies and you can automate many of the database tasks you have to perform regularly like adding and scaling new nodes, running backups and restores, and more.
  • Nagios: It’s an Open Source system and network monitoring application. It monitors hosts or services, and manage alerts for different states. With this tool, you can monitor network services, host resources, and more. For monitoring PostgreSQL, you can use some plugin or you can create your own script to check your database.
  • Zabbix: It’s a software that can monitor both networks and servers. It uses a flexible notification mechanism that allows users to configure alerts by email. It also offers reports and data visualization based on the stored data. All Zabbix reports and statistics, as well as configuration parameters, are accessed through a web interface.

Dashboards

Visibility is useful for fast issue detection. It’s definitely a more time-consuming task to read a command output than just watch a graph. So, the usage of a dashboard could be the difference between detecting a problem now or in the next 15 minutes, most sure that time could be really important for the company. For this task, tools like PMM or Vividcortex, among others, could be the key to add visibility to your database monitoring system.

Percona Monitoring and Management (PMM): It’s an open-source platform for managing and monitoring your database performance. It provides thorough time-based analysis for MySQL, MariaDB, MongoDB, and PostgreSQL servers to ensure that your data works as efficiently as possible.

VividCortex: It’s a cloud-hosted platform that provides deep database performance monitoring. It offers complete visibility into leading open source databases including MySQL, PostgreSQL, AWS Aurora, MongoDB, and Redis.

Alerting

Just monitoring a system doesn’t make sense if you don’t receive a notification about each issue. Without an alerting system, you should go to the monitoring tool to see if everything is fine, and it could be possible that you’re having a big issue since many hours ago. This alerting job could be done by using email alerts, text alerts or other tool integrations like slack.

It's really difficult to find some tools to monitor all the necessary metrics for PostgreSQL, in general, you will need to use more than one and even some scripting will need to be made. One way to centralize the monitoring and alerting task is by using ClusterControl, which provides you with features like backup management, monitoring and alerting, deployment and scaling, automatic recovery and more important features to help you manage your databases. All these features on the same system.

Monitoring Your PostgreSQL Database with ClusterControl

ClusterControl allows you to monitor your servers in real-time. It has a predefined set of dashboards for you, to analyze some of the most common metrics. 

It allows you to customize the graphs available in the cluster, and you can enable the agent-based monitoring to generate more detailed dashboards. 

You can also create alerts, which inform you of events in your cluster, or integrate with different services such as PagerDuty or Slack.

Also, you can check the query monitor section, where you can find the top queries, the running queries, queries outliers, and the queries statistics. 

With these features, you can see how your PostgreSQL database is going.

For backup management, ClusterControl centralizes it to protect, secure and recover your data, and with the verification backup feature, you can confirm if the backup is good to go.

This verification backup job will restore the backup in a separate standalone host, so you can make sure that the backup is working.

Monitoring with the ClusterControl Command Line

For scripting and automating tasks, or even if you just prefer the command line, ClusterControl has the s9s tool. It's a command-line tool for managing your database cluster.

Cluster List

Node List

You can perform all the tasks (and even more) from the ClusterControl UI, and you can integrate this feature with some external tools like slack, to manage it from there.

Conclusion

In this blog, we mentioned some important metrics to monitor in your PostgreSQL environment, and some tools to make your life easier by having your systems under control. You could also see how to use ClusterControl for this task.

As you can see, monitoring is absolutely necessary, and the best way on how to do it depends on the infrastructure and the system itself. You should reach a balance between what do you need to monitor and how it affects your database performance.


ClusterControl CMON HA for Distributed Database High Availability - Part One (Installation)

$
0
0

High Availability is a paramount nowadays and there’s no better way to introduce high availability than to build it on top of the quorum-based cluster. Such cluster is able to easily handle failures of individual nodes and ensure that all nodes, which have disconnected from the cluster, will not continue to operate. There are several protocols that allow you to solve consensus issues, examples being Paxos or RAFT. You can always introduce your own code. 

With this in mind, we would like to introduce you to CMON HA, a solution we created which allows to build highly available clusters of cmon daemons to achieve ClusterControl high availability. Please keep in mind this is a beta feature - it works but we are adding better debugging and more usability features. Having said that, let’s take a look at how it can be deployed, configured and accessed.

Prerequisites

CMON, the daemon that executes tasks in ClusterControl, works with a MySQL database to store some of the data - configuration settings, metrics, backup schedules and many others. In the typical setup this is a standalone MySQL instance. As we want to build highly available solution, we have to consider highly available database backend as well. One of the common solutions for that is MySQL Galera Cluster. As the installation scripts for ClusterControl sets up the standalone database, we have to deploy our Galera Cluster first, before we attempt to install highly available ClusterControl. What is the better way of deploying a Galera cluster than using ClusterControl? We will use temporary ClusterControl to deploy Galera on top of which we will deploy highly available version of ClusterControl.

Deploying a MySQL Galera Cluster

We won’t cover here the installation of the standalone ClusterControl. It’s as easy as downloading it for free and then following the steps you are provided with. Once it is ready, you can use the deployment wizard to deploy 3 nodes of Galera Cluster in couple of minutes.

Pick the deployment option, you will be then presented with a deployment wizard.

Define SSH connectivity details. You can use either root or password or passwordless sudo user. Make sure you correctly set SSH port and path to the SSH key.

Then you should pick a vendor, version and few of the configuration details including server port and root password. Finally, define the nodes you want to deploy your cluster on. Once this is done, ClusterControl will deploy a Galera cluster on the nodes you picked. From now on you can as well remove this ClusterControl instance, it won’t be needed anymore.

Deploying a Highly Available ClusterControl Installation

We are going to start with one node, configure it to start the cluster and then we will proceed with adding additional nodes.

Enabling Clustered Mode on the First Node

What we want to do is to deploy a normal ClusterControl instance therefore we are going to proceed with typical installation steps. We can download the installation script and then run it. The main difference, compared to the steps we took when we installed a temporary ClusterControl to deploy Galera Cluster, is that in this case there is already existing MySQL database. Thus the script will detect it, ask if we want to use it and if so, request password for the superuser. Other than that, installation is basically the same.

Next step would be to reconfigure cmon to listen not only on the localhost but also to bind to IP’s that can be accessed from outside. Communication between nodes in the cluster will happen on that IP on port (by default) 9501. We can accomplish this by editing file: /etc/default/cmon and adding IP to the RPC_BIND_ADDRESSES variable:

RPC_BIND_ADDRESSES="127.0.0.1,10.0.0.101"

Afterwards we have to restart cmon service:

service cmon restart

Following step will be to configure s9s CLI tools, which we will use to create and monitor cmon HA cluster. As per the documentation, those are the steps to take:

wget http://repo.severalnines.com/s9s-tools/install-s9s-tools.sh

chmod 755 install-s9s-tools.sh

./install-s9s-tools.sh

Once we have s9s tools installed, we can enable the clustered mode for cmon:

s9s controller --enable-cmon-ha

We can then verify the state of the cluster:

s9s controller --list --long

S VERSION    OWNER GROUP NAME            IP PORT COMMENT

l 1.7.4.3565 system admins 10.0.0.101      10.0.0.101 9501 Acting as leader.

Total: 1 controller(s)

As you can see, we have one node up and it is acting as a leader. Obviously, we need at least three nodes to be fault-tolerant therefore the next step will be to set up the remaining nodes.

Enabling Clustered Mode on Remaining Nodes

There are a couple of things we have to keep in mind while setting up additional nodes. First of all, ClusterControl creates tokens that “links” cmon daemon with clusters. That information is stored in several locations, including in the cmon database therefore we have to ensure every place contains the same token. Otherwise cmon nodes won’t be able to collect information about clusters and execute RPC calls. To do that we should copy existing configuration files from the first node to the other nodes. In this example we’ll use node with IP of 10.0.0.103 but you should do that for every node you plan to include in the cluster.

We’ll start by copying the cmon configuration files to new node:

scp -r /etc/cmon* 10.0.0.103:/etc/

We may need to edit /etc/cmon.cnf and set the proper hostname:

hostname=10.0.0.103

Then we’ll proceed with regular installation of the cmon, just like we did on the first node. There is one main difference though. Script will detect configuration files and ask if we want to install the controller:

=> An existing Controller installation detected!

=> A re-installation of the Controller will overwrite the /etc/cmon.cnf file

=> Install the Controller? (y/N):

We don’t want to do it for now. As on the first node we will be asked if we want to use existing MySQL database. We do want that. Then we’ll be asked to provide passwords:

=> Enter your MySQL root user's password:

=> Set a password for ClusterControl's MySQL user (cmon) [cmon]

=> Supported special characters: ~!@#$%^&*()_+{}<>?

=> Enter a CMON user password:

=> Enter the CMON user password again: => Creating the MySQL cmon user ...

Please make sure you use exactly the same password for cmon user as you did on the first node.

As the next step, we want to install s9s tools on new nodes:

wget http://repo.severalnines.com/s9s-tools/install-s9s-tools.sh

chmod 755 install-s9s-tools.sh

./install-s9s-tools.sh

We want to have them configured exactly as on the first node thus we’ll copy the config:

scp -r ~/.s9s/ 10.0.0.103:/root/

scp /etc/s9s.conf 10.0.0.103:/etc/

There’s one more place where we ClusterControl stores token: /var/www/clustercontrol/bootstrap.php. We want to copy that file as well:

scp /var/www/clustercontrol/bootstrap.php 10.0.0.103:/var/www/clustercontrol/

Finally, we want to install the controller (as we skipped this when we ran the installation script):

apt install clustercontrol-controller

Make sure you do not overwrite existing configuration files. Default options should be safe and leave correct configuration files in place.

There is one more piece of configuration you may want to copy: /etc/default/cmon. You want to copy it to other nodes:

scp /etc/default/cmon 10.0.0.103:/etc/default

Then you want to edit RPC_BIND_ADDRESSES to point to a correct IP of the node.

RPC_BIND_ADDRESSES="127.0.0.1,10.0.0.103"

Then we can start the cmon service on the nodes, one by one, and see if they managed to join the cluster. If everything went well, you should see something like this:

s9s controller --list --long

S VERSION    OWNER GROUP NAME            IP PORT COMMENT

l 1.7.4.3565 system admins 10.0.0.101      10.0.0.101 9501 Acting as leader.

f 1.7.4.3565 system admins 10.0.0.102      10.0.0.102 9501 Accepting heartbeats.

f 1.7.4.3565 system admins 10.0.0.103      10.0.0.103 9501 Accepting heartbeats.

Total: 3 controller(s)

In case of any issues, please check if all the cmon services are bound to the correct IP addresses. If not, kill them and start again, to re-read the proper configuration:

root      8016 0.4 2.2 658616 17124 ?        Ssl 09:16 0:00 /usr/sbin/cmon --rpc-port=9500 --bind-addr='127.0.0.1,10.0.0.103' --events-client='http://127.0.0.1:9510' --cloud-service='http://127.0.0.1:9518'

If you manage to see the output from ‘s9s controller --list --long’ as above, this means that, technically, we have a running cmon HA cluster of three nodes. We can end here but it’s not over yet. The main problem that remains is the UI access. Only leader node can execute jobs. Some of the s9s commands support this but as of now UI does not. This means that the UI will work only on the leader node, in our current situation it is the UI accessible via https://10.0.0.101/clustercontrol

In the second part we will show you one of the ways in which you could solve this problem.


ClusterControl CMON HA for Distributed Database High Availability - Part Two (GUI Access Setup)

$
0
0

In the first part, we ended up with a working cmon HA cluster:

root@vagrant:~# s9s controller --list --long

S VERSION    OWNER GROUP NAME            IP PORT COMMENT

l 1.7.4.3565 system admins 10.0.0.101      10.0.0.101 9501 Acting as leader.

f 1.7.4.3565 system admins 10.0.0.102      10.0.0.102 9501 Accepting heartbeats.

f 1.7.4.3565 system admins 10.0.0.103      10.0.0.103 9501 Accepting heartbeats.

Total: 3 controller(s)

We have three nodes up and running, one is acting as a leader and remaining are followers, which are accessible (they do receive heartbeats and reply to them). The remaining challenge is to configure UI access in a way that will allow us to always access the UI on the leader node. In this blog post we will present one of the possible solutions which will allow you to accomplish just that.

Setting up HAProxy

This problem is not new to us. With every replication cluster, MySQL or PostgreSQL, it doesn’t matter,  there’s a single node where we should send our writes to. One way of accomplishing that would be to use HAProxy and add some external checks that test the state of the node, and based on that, return proper values. This is basically what we are going to use to solve our problem. We will use HAProxy as a well-tested layer 4 proxy and we will combine it with layer 7 HTTP checks that we will write precisely for our use case. First things first, let’s install HAProxy. We will collocate it with ClusterControl, but it can as well be installed on a separate node (ideally, nodes - to remove HAProxy as the single point of failure).

apt install haproxy

This sets up HAProxy. Once it’s done, we have to introduce our configuration:

global

        pidfile /var/run/haproxy.pid

        daemon

        user haproxy

        group haproxy

        stats socket /var/run/haproxy.socket user haproxy group haproxy mode 600 level admin

        node haproxy_10.0.0.101

        description haproxy server


        #* Performance Tuning

        maxconn 8192

        spread-checks 3

        quiet

defaults

        #log    global

        mode    tcp

        option  dontlognull

        option tcp-smart-accept

        option tcp-smart-connect

        #option dontlog-normal

        retries 3

        option redispatch

        maxconn 8192

        timeout check   10s

        timeout queue   3500ms

        timeout connect 3500ms

        timeout client  10800s

        timeout server  10800s


userlist STATSUSERS

        group admin users admin

        user admin insecure-password admin

        user stats insecure-password admin


listen admin_page

        bind *:9600

        mode http

        stats enable

        stats refresh 60s

        stats uri /

        acl AuthOkay_ReadOnly http_auth(STATSUSERS)

        acl AuthOkay_Admin http_auth_group(STATSUSERS) admin

        stats http-request auth realm admin_page unless AuthOkay_ReadOnly

        #stats admin if AuthOkay_Admin


listen  haproxy_10.0.0.101_81

        bind *:81

        mode tcp

        tcp-check connect port 80

        timeout client  10800s

        timeout server  10800s

        balance leastconn

        option httpchk

#        option allbackups

        default-server port 9201 inter 20s downinter 30s rise 2 fall 2 slowstart 60s maxconn 64 maxqueue 128 weight 100

        server 10.0.0.101 10.0.0.101:443 check

        server 10.0.0.102 10.0.0.102:443 check

        server 10.0.0.103 10.0.0.103:443 check

You may want to change some of the things here like the node or backend names which include here the IP of our node. You will definitely want to change servers that you are going to have included in your HAProxy.

The most important bits are:

        bind *:81

HAProxy will listen on port 81.

        option httpchk

We have enabled layer 7 check on the backend nodes.

        default-server port 9201 inter 20s downinter 30s rise 2 fall 2 slowstart 60s maxconn 64 maxqueue 128 weight 100

The layer 7 check will be executed on port 9201.

Once this is done, start HAProxy.

Setting up xinetd and Check Script

We are going to use xinetd to execute the check and return correct responses to HAProxy. Steps described in this paragraph should be executed on all cmon HA cluster nodes.

First, install xinetd:

root@vagrant:~# apt install xinetd

Once this is done, we have to add the following line:

cmonhachk       9201/tcp

to /etc/services - this will allow xinetd to open a service that will listen on port 9201. Then we have to add the service file itself. It should be located in /etc/xinetd.d/cmonhachk:

# default: on

# description: cmonhachk

service cmonhachk

{

        flags           = REUSE

        socket_type     = stream

        port            = 9201

        wait            = no

        user            = root

        server          = /usr/local/sbin/cmonhachk.py

        log_on_failure  += USERID

        disable         = no

        #only_from       = 0.0.0.0/0

        only_from       = 0.0.0.0/0

        per_source      = UNLIMITED

}

Finally, we need the check script that’s called by the xinetd. As defined in the service file it is located in /usr/local/sbin/cmonhachk.py.

#!/usr/bin/python3.5


import subprocess

import re

import sys

from pathlib import Path

import os


def ret_leader():

    leader_str = """HTTP/1.1 200 OK\r\n

Content-Type: text/html\r\n

Content-Length: 48\r\n

\r\n

<html><body>This node is a leader.</body></html>\r\n

\r\n"""

    print(leader_str)


def ret_follower():

    follower_str = """

HTTP/1.1 503 Service Unavailable\r\n

Content-Type: text/html\r\n

Content-Length: 50\r\n

\r\n

<html><body>This node is a follower.</body></html>\r\n

\r\n"""

    print(follower_str)


def ret_unknown():

    unknown_str = """

HTTP/1.1 503 Service Unavailable\r\n

Content-Type: text/html\r\n

Content-Length: 59\r\n

\r\n

<html><body>This node is in an unknown state.</body></html>\r\n

\r\n"""

    print(unknown_str)


lockfile = "/tmp/cmonhachk_lockfile"


if os.path.exists(lockfile):

    print("Lock file {} exists, exiting...".format(lockfile))

    sys.exit(1)


Path(lockfile).touch()

try:

    with open("/etc/default/cmon", 'r') as f:

        lines  = f.readlines()


    pattern1 = "RPC_BIND_ADDRESSES"

    pattern2 = "[0-9]{1,3}\.[0-9]{1,3}\.[0-9]{1,3}\.[0-9]{1,3}"

    m1 = re.compile(pattern1)

    m2 = re.compile(pattern2)


    for line in lines:

        res1 = m1.match(line)

        if res1 is not None:

            res2 = m2.findall(line)

            i = 0

            for r in res2:

                if r != "127.0.0.1" and i == 0:

                    i += 1

                    hostname = r


    command = "s9s controller --list --long | grep {}".format(hostname)

    output = subprocess.check_output(command.split())

    state = output.splitlines()[1].decode('UTF-8')[0]

    if state == "l":

        ret_leader()

    if state == "f":

        ret_follower()

    else:

        ret_unknown()

finally:

    os.remove(lockfile)

Once you create the file, make sure it is executable:

chmod u+x /usr/local/sbin/cmonhachk.py

The idea behind this script is that it tests the status of the nodes using “s9s controller --list --long” command and then it checks the output relevant to the IP that it can find on the local node. This allows the script to determine if the host on which it is executed is a leader or not. If the node is the leader, script returns “HTTP/1.1 200 OK” code, which HAProxy interprets as the node is available and routes the traffic to it.. Otherwise it returns “HTTP/1.1 503 Service Unavailable”, which is treated as a node, which is not healthy and the traffic will not be routed there. As a result, no matter which node will become a leader, HAProxy will detect it and mark it as available in the backend:

You may need to restart HAProxy and xinetd to apply configuration changes before all the parts will start working correctly.

Having more than one HAProxy ensures we have a way to access ClusterControl UI even if one of HAProxy nodes would fail but we still have two (or more) different hostnames or IP to connect to the ClusterControl UI. To make it more comfortable, we will deploy Keepalived on top of HAProxy. It will monitor the state of HAProxy services and assign Virtual IP to one of them. If that HAProxy would become unavailable, VIP will be moved to another available HAProxy. As a result, we’ll have a single point of entry (VIP or a hostname associated to it). The steps we’ll take here have to be executed on all of the nodes where HAProxy has been installed.

First, let’s install keepalived:

apt install keepalived

Then we have to configure it. We’ll use following config file:

vrrp_script chk_haproxy {

   script "killall -0 haproxy"   # verify the pid existance

   interval 2                    # check every 2 seconds

   weight 2                      # add 2 points of prio if OK

}

vrrp_instance VI_HAPROXY {

   interface eth1                # interface to monitor

   state MASTER

   virtual_router_id 51          # Assign one ID for this route

   priority 102                   

   unicast_src_ip 10.0.0.101

   unicast_peer {

      10.0.0.102

10.0.0.103


   }

   virtual_ipaddress {

       10.0.0.130                        # the virtual IP

   } 

   track_script {

       chk_haproxy

   }

#    notify /usr/local/bin/notify_keepalived.sh

}

You should modify this file on different nodes. IP addresses have to be configured properly and priority should be different on all of the nodes. Please also configure VIP that makes sense in your network. You may also want to change the interface - we used eth1, which is where the IP is assigned on virtual machines created by Vagrant.

Start the keepalived with this configuration file and you should be good to go. As long as VIP is up on one HAProxy node, you should be able to use it to connect to the proper ClusterControl UI:

This completes our two-part introduction to ClusterControl highly available clusters. As we stated at the beginning, this is still in beta state but we are looking forward for feedback from your tests.

Maximizing Database Query Efficiency for MySQL - Part One

$
0
0

Slow queries, inefficient queries, or long running queries are problems that regularly plague DBA's. They are always ubiquitous, yet are an inevitable part of life for anyone responsible for managing a database. 

Poor database design can affect the efficiency of the query and its performance. Lack of knowledge or improper use of function calls, stored procedures, or routines can also cause database performance degradation and can even harm the entire MySQL database cluster

For a master-slave replication, a very common cause of these issues are tables which lack primary or secondary indexes. This causes slave lag which can last for a very long time (in a worse case scenario).

In this two-part series blog, we'll give you a refresher course on how to tackle the maximizing of your database queries in MySQL to driver better efficiency and performance.

Always Add a Unique Index To Your Table

Tables that do not have primary or unique keys typically create huge problems when data gets bigger. When this happens a simple data modification can stall the database. Lack of proper indices and an UPDATE or DELETE statement has been applied to the particular table, a full table scan will be chosen as the query plan by MySQL. That can cause high disk I/O for reads and writes and degrades the performance of your database. See an example below:

root[test]> show create table sbtest2\G

*************************** 1. row ***************************

       Table: sbtest2

Create Table: CREATE TABLE `sbtest2` (

  `id` int(10) unsigned NOT NULL,

  `k` int(10) unsigned NOT NULL DEFAULT '0',

  `c` char(120) NOT NULL DEFAULT '',

  `pad` char(60) NOT NULL DEFAULT ''

) ENGINE=InnoDB DEFAULT CHARSET=latin1

1 row in set (0.00 sec)


root[test]> explain extended update sbtest2 set k=52, pad="xx234xh1jdkHdj234" where id=57;

+----+-------------+---------+------------+------+---------------+------+---------+------+---------+----------+-------------+

| id | select_type | table   | partitions | type | possible_keys | key  | key_len | ref | rows | filtered | Extra       |

+----+-------------+---------+------------+------+---------------+------+---------+------+---------+----------+-------------+

|  1 | UPDATE      | sbtest2 | NULL       | ALL | NULL | NULL | NULL    | NULL | 1923216 | 100.00 | Using where |

+----+-------------+---------+------------+------+---------------+------+---------+------+---------+----------+-------------+

1 row in set, 1 warning (0.06 sec)

Whereas a table with primary key has a very good query plan,

root[test]> show create table sbtest3\G

*************************** 1. row ***************************

       Table: sbtest3

Create Table: CREATE TABLE `sbtest3` (

  `id` int(10) unsigned NOT NULL AUTO_INCREMENT,

  `k` int(10) unsigned NOT NULL DEFAULT '0',

  `c` char(120) NOT NULL DEFAULT '',

  `pad` char(60) NOT NULL DEFAULT '',

  PRIMARY KEY (`id`),

  KEY `k` (`k`)

) ENGINE=InnoDB AUTO_INCREMENT=2097121 DEFAULT CHARSET=latin1

1 row in set (0.00 sec)


root[test]> explain extended update sbtest3 set k=52, pad="xx234xh1jdkHdj234" where id=57;

+----+-------------+---------+------------+-------+---------------+---------+---------+-------+------+----------+-------------+

| id | select_type | table   | partitions | type | possible_keys | key     | key_len | ref | rows | filtered | Extra   |

+----+-------------+---------+------------+-------+---------------+---------+---------+-------+------+----------+-------------+

|  1 | UPDATE      | sbtest3 | NULL       | range | PRIMARY | PRIMARY | 4       | const | 1 | 100.00 | Using where |

+----+-------------+---------+------------+-------+---------------+---------+---------+-------+------+----------+-------------+

1 row in set, 1 warning (0.00 sec)

Primary or unique keys provides vital component for a table structure because this is very important especially when performing maintenance on a table. For example, using tools from the Percona Toolkit (such as pt-online-schema-change or pt-table-sync) recommends that you must have unique keys. Keep in mind that the PRIMARY KEY is already a unique key and a primary key cannot hold NULL values but unique key. Assigning a NULL value to a Primary Key can cause an error like,

ERROR 1171 (42000): All parts of a PRIMARY KEY must be NOT NULL; if you need NULL in a key, use UNIQUE instead

For slave nodes, it is also common that in certain occasions, the primary/unique key is not present on the table which therefore are discrepancy of the table structure. You can use mysqldiff to achieve this or you can mysqldump --no-data … params and and run a diff to compare its table structure and check if there's any discrepancy. 

Scan Tables With Duplicate Indexes, Then Dropped It

Duplicate indices can also cause performance degradation, especially when the table contains a huge number of records. MySQL has to perform multiple attempts to optimize the query and performs more query plans to check. It includes scanning large index distribution or statistics and that adds performance overhead as it can cause memory contention or high I/O memory utilization.

Degradation for queries when duplicate indices are observed on a table also attributes on saturating the buffer pool. This can also affect the performance of MySQL when the checkpointing flushes the transaction logs into the disk. This is due to the processing and storing of an unwanted index (which is in fact a waste of space in the particular tablespace of that table). Take note that duplicate indices are also stored in the tablespace which also has to be stored in the buffer pool. 

Take a look at the table below which contains multiple duplicate keys:

root[test]#> show create table sbtest3\G

*************************** 1. row ***************************

       Table: sbtest3

Create Table: CREATE TABLE `sbtest3` (

  `id` int(10) unsigned NOT NULL AUTO_INCREMENT,

  `k` int(10) unsigned NOT NULL DEFAULT '0',

  `c` char(120) NOT NULL DEFAULT '',

  `pad` char(60) NOT NULL DEFAULT '',

  PRIMARY KEY (`id`),

  KEY `k` (`k`,`pad`,`c`),

  KEY `kcp2` (`id`,`k`,`c`,`pad`),

  KEY `kcp` (`k`,`c`,`pad`),

  KEY `pck` (`pad`,`c`,`id`,`k`)

) ENGINE=InnoDB AUTO_INCREMENT=2048561 DEFAULT CHARSET=latin1

1 row in set (0.00 sec)

and has a size of 2.3GiB

root[test]#> \! du -hs /var/lib/mysql/test/sbtest3.ibd

2.3G    /var/lib/mysql/test/sbtest3.ibd

Let's drop the duplicate indices and rebuild the table with a no-op alter,

root[test]#> drop index kcp2 on sbtest3; drop index kcp on sbtest3 drop index pck on sbtest3;

Query OK, 0 rows affected (0.01 sec)

Records: 0  Duplicates: 0  Warnings: 0

Query OK, 0 rows affected (0.01 sec)

Records: 0  Duplicates: 0  Warnings: 0

Query OK, 0 rows affected (0.01 sec)

Records: 0  Duplicates: 0  Warnings: 0


root[test]#> alter table sbtest3 engine=innodb;

Query OK, 0 rows affected (28.23 sec)

Records: 0  Duplicates: 0  Warnings: 0


root[test]#> \! du -hs /var/lib/mysql/test/sbtest3.ibd

945M    /var/lib/mysql/test/sbtest3.ibd

It has been able to save up to ~59% of the old size of the table space which is really huge.

To determine duplicate indexes, you can use pt-duplicate-checker to handle the job for you. 

Tune Up your Buffer Pool

For this section I’m referring only to the InnoDB storage engine. 

Buffer pool is an important component within the InnoDB kernel space. This is where InnoDB caches table and index data when accessed. It speeds up processing because frequently used data are being stored in the memory efficiently using BTREE. For instance, If you have multiple tables consisting of >= 100GiB and are accessed heavily, then we suggest that you delegate a fast volatile memory starting from a size of 128GiB and start assigning the buffer pool with 80% of the physical memory. The 80% has to be monitored efficiently. You can use SHOW ENGINE INNODB STATUS \G or you can leverage monitoring software such as ClusterControl which offers a fine-grained monitoring which includes buffer pool and its relevant health metrics. Also set the innodb_buffer_pool_instances variable accordingly. You might set this larger than 8 (default if innodb_buffer_pool_size >= 1GiB), such as 16, 24, 32, or 64 or higher if necessary.  

When monitoring the buffer pool, you need to check global status variable Innodb_buffer_pool_pages_free which provides you thoughts if there's a need to adjust the buffer pool, or maybe consider if there are also unwanted or duplicate indexes that consumes the buffer. The SHOW ENGINE INNODB STATUS \G also offers a more detailed aspect of the buffer pool information including its individual buffer pool based on the number of innodb_buffer_pool_instances you have set.

Use FULLTEXT Indexes (But Only If Applicable)

Using queries like,

SELECT bookid, page, context FROM books WHERE context like '%for dummies%';

wherein context is a string-type (char, varchar, text) column, is an example of a super bad query! Pulling large content of records with a filter that has to be greedy ends up with a full table scan, and that is just crazy. Consider using FULLTEXT index. A FULLTEXT indexes have an inverted index design. Inverted indexes store a list of words, and for each word, a list of documents that the word appears in. To support proximity search, position information for each word is also stored, as a byte offset.

In order to use FULLTEXT for searching or filtering data, you need to use the combination of MATCH() ...AGAINST syntax and not like the query above. Of course, you need to specify the field to be your FULLTEXT index field. 

To create a FULLTEXT index, just specify with FULLTEXT as your index. See the example below:

root[minime]#> CREATE FULLTEXT INDEX aboutme_fts ON users_info(aboutme);

Query OK, 0 rows affected, 1 warning (0.49 sec)

Records: 0  Duplicates: 0  Warnings: 1


root[jbmrcd_date]#> show warnings;

+---------+------+--------------------------------------------------+

| Level   | Code | Message                                          |

+---------+------+--------------------------------------------------+

| Warning |  124 | InnoDB rebuilding table to add column FTS_DOC_ID |

+---------+------+--------------------------------------------------+

1 row in set (0.00 sec)

Although using FULLTEXT indexes can offer benefits when searching words within a very large context inside a column, it also creates issues when used incorrectly. 

When doing a FULLTEXT search for a large table that is constantly accessed (where a number of client requests are searching for different,  unique keywords) it could be very CPU intensive. 

There are certain occasions as well that FULLTEXT is not applicable. See this external blog post. Although I haven't tried this with 8.0, I don't see any changes relevant to this. We suggest that do not use FULLTEXT for searching a big data environment, especially for high-traffic tables. Otherwise, try to leverage other technologies such as Apache Lucene, Apache Solr, tsearch2, or Sphinx.

Avoid Using NULL in Columns

Columns that contain null values are totally fine in MySQL. But if you are using columns with null values into an index, it can affect query performance as the optimizer cannot provide the right query plan due to poor index distribution. However, there are certain ways to optimize queries that involves null values but of course, if this suits the requirements. Please check the documentation of MySQL about Null Optimization. You may also check this external post which is helpful as well.

Design Your Schema Topology and Tables Structure Efficiently

To some extent, normalizing your database tables from 1NF (First Normal Form) to 3NF (Third Normal Form) provides you some benefit for query efficiency because normalized tables tend to avoid redundant records. A proper planning and design for your tables is very important because this is how you retrieved or pull data and in every one of these actions has a cost. With normalized tables, the goal of the database is to ensure that every non-key column in every table is directly dependent on the key; the whole key and nothing but the key. If this goal is reached, it pays of the benefits in the form of reduced redundancies, fewer anomalies and improved efficiencies.

While normalizing your tables has many benefits, it doesn't mean you need to normalize all your tables in this way. You can implement a design for your database using Star Schema. Designing your tables using Star Schema has the benefit of simpler queries (avoid complex cross joins), easy to retrieve data for reporting, offers performance gains because there's no need to use unions or complex joins, or fast aggregations. A Star Schema is simple to implement, but you need to carefully plan because it can create big problems and disadvantages when your table gets bigger and requires maintenance. Star Schema (and its underlying tables) are prone to data integrity issues, so you may have a high probability that bunch of your data is redundant. If you think this table has to be constant (structure and design) and is designed to utilize query efficiency, then it's an ideal case for this approach.

Mixing your database designs (as long as you are able to determine and identify what kind of data has to be pulled on your tables) is very important since you can benefit with more efficient queries and as well as help the DBA with backups, maintenance, and recovery.

Get Rid of Constant and Old Data

We recently wrote some Best Practices for Archiving Your Database in the Cloud. It covers about how you can take advantage of data archiving before it goes to the cloud. So how does getting rid of old data or archiving your constant and old data help query efficiency? As stated in my previous blog, there are benefits for larger tables that are constantly modified and inserted with new data, the tablespace can grow quickly. MySQL and InnoDB performs efficiently when records or data are contiguous to each other and has significance to its next row in the table. Meaning, if you have no old records that are no longer need to be used, then the optimizer does not need to include that in the statistics offering much more efficient result. Make sense, right? And also, query efficiency is not only on the application side, it has also need to consider its efficiency when performing a backup and when on maintenance or failover. For example, if you have a bad and long query that can affect your maintenance period or a failover, that can be a problem.

Enable Query Logging As Needed

Always set your MySQL's slow query log in accordance to your custom needs. If you are using Percona Server, you can take advantage of their extended slow query logging. It allows you to customarily define certain variables. You can filter types of queries in combination such as full_scan, full_join, tmp_table, etc. You can also dictate the rate of slow query logging through variable log_slow_rate_type, and many others.

The importance of enabling query logging in MySQL (such as slow query) is beneficial for inspecting your queries so that you can optimize or tune your MySQL by adjusting certain variables that suits to your requirements. To enable slow query log, ensure that these variables are setup:

  • long_query_time - assign the right value for how long the queries can take. If the queries take more than 10 seconds (default), it will fall down to the slow query log file you assigned.
  • slow_query_log - to enable it, set it to 1.
  • slow_query_log_file - this is the destination path for your slow query log file.

The slow query log is very helpful for query analysis and diagnosing bad queries that cause stalls, slave delays, long running queries, memory or CPU intensive, or even cause the server to crash. If you use pt-query-digest or pt-index-usage, use the slow query log file as your source target for reporting these queries alike.

Conclusion

We have discussed some ways you can use to maximize database query efficiency in this blog. In this next part we'll discuss even more factors which can help you maximize performance. Stay tuned!


Maximizing Database Query Efficiency for MySQL - Part Two

$
0
0

This is the second part of a two-part series blog for Maximizing Database Query Efficiency In MySQL. You can read part one here.

Using Single-Column, Composite, Prefix, and Covering Index

Tables that are frequently receiving high traffic must be properly indexed. It's not only important to index your table, but you also need to determine and analyze what are the types of queries or types of retrieval that you need for the specific table. It is strongly recommended that you analyze what type of queries or retrieval of data you need on a specific table before you decide what indexes are required for the table. Let's go over these types of indexes and how you can use them to maximize your query performance.

Single-Column Index

InnoD table can contain a maximum of 64 secondary indexes. A single-column index (or full-column index) is an index assigned only to a particular column. Creating an index to a particular column that contains distinct values is a good candidate. A good index must have a high cardinality and statistics so the optimizer can choose the right query plan. To view the distribution of indexes, you can check with SHOW INDEXES syntax just like below:

root[test]#> SHOW INDEXES FROM users_account\G

*************************** 1. row ***************************

        Table: users_account

   Non_unique: 0

     Key_name: PRIMARY

 Seq_in_index: 1

  Column_name: id

    Collation: A

  Cardinality: 131232

     Sub_part: NULL

       Packed: NULL

         Null: 

   Index_type: BTREE

      Comment: 

Index_comment: 

*************************** 2. row ***************************

        Table: users_account

   Non_unique: 1

     Key_name: name

 Seq_in_index: 1

  Column_name: last_name

    Collation: A

  Cardinality: 8995

     Sub_part: NULL

       Packed: NULL

         Null: 

   Index_type: BTREE

      Comment: 

Index_comment: 

*************************** 3. row ***************************

        Table: users_account

   Non_unique: 1

     Key_name: name

 Seq_in_index: 2

  Column_name: first_name

    Collation: A

  Cardinality: 131232

     Sub_part: NULL

       Packed: NULL

         Null: 

   Index_type: BTREE

      Comment: 

Index_comment: 

3 rows in set (0.00 sec)

You can inspect as well with tablesinformation_schema.index_statistics or mysql.innodb_index_stats.

Compound (Composite) or Multi-Part Indexes

A compound index (commonly called a composite index) is a multi-part index composed of multiple columns. MySQL allows up to 16 columns bounded for a specific composite index. Exceeding the limit returns an error like below:

ERROR 1070 (42000): Too many key parts specified; max 16 parts allowed

A composite index provides a boost to your queries, but it requires that you must have a pure understanding on how you are retrieving the data. For example, a table with a DDL of...

CREATE TABLE `user_account` (

  `id` int(11) NOT NULL AUTO_INCREMENT,

  `last_name` char(30) NOT NULL,

  `first_name` char(30) NOT NULL,

  `dob` date DEFAULT NULL,

  `zip` varchar(10) DEFAULT NULL,

  `city` varchar(100) DEFAULT NULL,

  `state` varchar(100) DEFAULT NULL,

  `country` varchar(50) NOT NULL,

  `tel` varchar(16) DEFAULT NULL

  PRIMARY KEY (`id`),

  KEY `name` (`last_name`,`first_name`)

) ENGINE=InnoDB DEFAULT CHARSET=latin1

...which consists of composite index `name`. The composite index improves query performance once these keys are reference as used key parts. For example, see the following:

root[test]#> explain format=json select * from users_account where last_name='Namuag' and first_name='Maximus'\G

*************************** 1. row ***************************

EXPLAIN: {

  "query_block": {

    "select_id": 1,

    "cost_info": {

      "query_cost": "1.20"

    },

    "table": {

      "table_name": "users_account",

      "access_type": "ref",

      "possible_keys": [

        "name"

      ],

      "key": "name",

      "used_key_parts": [

        "last_name",

        "first_name"

      ],

      "key_length": "60",

      "ref": [

        "const",

        "const"

      ],

      "rows_examined_per_scan": 1,

      "rows_produced_per_join": 1,

      "filtered": "100.00",

      "cost_info": {

        "read_cost": "1.00",

        "eval_cost": "0.20",

        "prefix_cost": "1.20",

        "data_read_per_join": "352"

      },

      "used_columns": [

        "id",

        "last_name",

        "first_name",

        "dob",

        "zip",

        "city",

        "state",

        "country",

        "tel"

      ]

    }

  }

}

1 row in set, 1 warning (0.00 sec

The used_key_parts show that the query plan has perfectly selected our desired columns covered in our composite index.

Composite indexing has its limitations as well. Certain conditions in the query cannot take all columns part of the key.

The documentation says, "The optimizer attempts to use additional key parts to determine the interval as long as the comparison operator is =, <=>, or IS NULL. If the operator is >, <, >=, <=, !=, <>, BETWEEN, or LIKE, the optimizer uses it but considers no more key parts. For the following expression, the optimizer uses = from the first comparison. It also uses >= from the second comparison but considers no further key parts and does not use the third comparison for interval construction…". Basically, this means that regardless you have composite index for two columns, a sample query below does not cover both fields:

root[test]#> explain format=json select * from users_account where last_name>='Zu' and first_name='Maximus'\G

*************************** 1. row ***************************

EXPLAIN: {

  "query_block": {

    "select_id": 1,

    "cost_info": {

      "query_cost": "34.61"

    },

    "table": {

      "table_name": "users_account",

      "access_type": "range",

      "possible_keys": [

        "name"

      ],

      "key": "name",

      "used_key_parts": [

        "last_name"

      ],

      "key_length": "60",

      "rows_examined_per_scan": 24,

      "rows_produced_per_join": 2,

      "filtered": "10.00",

      "index_condition": "((`test`.`users_account`.`first_name` = 'Maximus') and (`test`.`users_account`.`last_name` >= 'Zu'))",

      "cost_info": {

        "read_cost": "34.13",

        "eval_cost": "0.48",

        "prefix_cost": "34.61",

        "data_read_per_join": "844"

      },

      "used_columns": [

        "id",

        "last_name",

        "first_name",

        "dob",

        "zip",

        "city",

        "state",

        "country",

        "tel"

      ]

    }

  }

}

1 row in set, 1 warning (0.00 sec)

In this case (and if your query is more of ranges instead of constant or reference types) then avoid using composite indexes. It just wastes your memory and buffer and it increases the performance degradation of your queries.

Prefix Indexes

Prefix indexes are indexes which contain columns referenced as an index, but only takes the starting length defined to that column, and that portion (or prefix data) are the only part stored in the buffer. Prefix indexes can help lessen your buffer pool resources and also your disk space as it does not need to take the full-length of the column.What does this mean? Let's take an example. Let's compare the impact between full-length index versus the prefix index.

root[test]#> create index name on users_account(last_name, first_name);

Query OK, 0 rows affected (0.42 sec)

Records: 0  Duplicates: 0  Warnings: 0


root[test]#> \! du -hs /var/lib/mysql/test/users_account.*

12K     /var/lib/mysql/test/users_account.frm

36M     /var/lib/mysql/test/users_account.ibd

We created a full-length composite index which consumes a total of 36MiB tablespace for users_account table. Let's drop it and then add a prefix index.

root[test]#> drop index name on users_account;

Query OK, 0 rows affected (0.01 sec)

Records: 0  Duplicates: 0  Warnings: 0


root[test]#> alter table users_account engine=innodb;

Query OK, 0 rows affected (0.63 sec)

Records: 0  Duplicates: 0  Warnings: 0


root[test]#> \! du -hs /var/lib/mysql/test/users_account.*

12K     /var/lib/mysql/test/users_account.frm

24M     /var/lib/mysql/test/users_account.ibd


root[test]#> create index name on users_account(last_name(5), first_name(5));

Query OK, 0 rows affected (0.42 sec)

Records: 0  Duplicates: 0  Warnings: 0


root[test]#> \! du -hs /var/lib/mysql/test/users_account.*

12K     /var/lib/mysql/test/users_account.frm

28M     /var/lib/mysql/test/users_account.ibd

Using the prefix index, it holds up only to 28MiB and that's less than 8MiB than using full-length index. That's great to hear, but it doesn't mean that is performant and serves what you need. 

If you decide to add a prefix index, you must identify first what type of query for data retrieval you need. Creating a prefix index helps you utilize more efficiency with the buffer pool and so it does help with your query performance but you also need to know its limitation. For example, let's compare the performance when using a full-length index and a prefix index.

Let's create a full-length index using a composite index,

root[test]#> create index name on users_account(last_name, first_name);

Query OK, 0 rows affected (0.45 sec)

Records: 0  Duplicates: 0  Warnings: 0


root[test]#>  EXPLAIN format=json select last_name from users_account where last_name='Namuag' and first_name='Maximus Aleksandre' \G

*************************** 1. row ***************************

EXPLAIN: {

  "query_block": {

    "select_id": 1,

    "cost_info": {

      "query_cost": "1.61"

    },

    "table": {

      "table_name": "users_account",

      "access_type": "ref",

      "possible_keys": [

        "name"

      ],

      "key": "name",

      "used_key_parts": [

        "last_name",

        "first_name"

      ],

      "key_length": "60",

      "ref": [

        "const",

        "const"

      ],

      "rows_examined_per_scan": 3,

      "rows_produced_per_join": 3,

      "filtered": "100.00",

      "using_index": true,

      "cost_info": {

        "read_cost": "1.02",

        "eval_cost": "0.60",

        "prefix_cost": "1.62",

        "data_read_per_join": "1K"

      },

      "used_columns": [

        "last_name",

        "first_name"

      ]

    }

  }

}

1 row in set, 1 warning (0.00 sec)


root[test]#> flush status;

Query OK, 0 rows affected (0.02 sec)


root[test]#> pager cat -> /dev/null; select last_name from users_account where last_name='Namuag' and first_name='Maximus Aleksandre' \G

PAGER set to 'cat -> /dev/null'

3 rows in set (0.00 sec)


root[test]#> nopager; show status like 'Handler_read%';

PAGER set to stdout

+-----------------------+-------+

| Variable_name         | Value |

+-----------------------+-------+

| Handler_read_first    | 0 |

| Handler_read_key      | 1 |

| Handler_read_last     | 0 |

| Handler_read_next     | 3 |

| Handler_read_prev     | 0 |

| Handler_read_rnd      | 0 |

| Handler_read_rnd_next | 0     |

+-----------------------+-------+

7 rows in set (0.00 sec)

The result reveals that it's, in fact, using a covering index i.e "using_index": true and uses indexes properly, i.e. Handler_read_key is incremented and does an index scan as Handler_read_next is incremented.

Now, let's try using prefix index of the same approach,

root[test]#> create index name on users_account(last_name(5), first_name(5));

Query OK, 0 rows affected (0.22 sec)

Records: 0  Duplicates: 0  Warnings: 0


root[test]#>  EXPLAIN format=json select last_name from users_account where last_name='Namuag' and first_name='Maximus Aleksandre' \G

*************************** 1. row ***************************

EXPLAIN: {

  "query_block": {

    "select_id": 1,

    "cost_info": {

      "query_cost": "3.60"

    },

    "table": {

      "table_name": "users_account",

      "access_type": "ref",

      "possible_keys": [

        "name"

      ],

      "key": "name",

      "used_key_parts": [

        "last_name",

        "first_name"

      ],

      "key_length": "10",

      "ref": [

        "const",

        "const"

      ],

      "rows_examined_per_scan": 3,

      "rows_produced_per_join": 3,

      "filtered": "100.00",

      "cost_info": {

        "read_cost": "3.00",

        "eval_cost": "0.60",

        "prefix_cost": "3.60",

        "data_read_per_join": "1K"

      },

      "used_columns": [

        "last_name",

        "first_name"

      ],

      "attached_condition": "((`test`.`users_account`.`first_name` = 'Maximus Aleksandre') and (`test`.`users_account`.`last_name` = 'Namuag'))"

    }

  }

}

1 row in set, 1 warning (0.00 sec)


root[test]#> flush status;

Query OK, 0 rows affected (0.01 sec)


root[test]#> pager cat -> /dev/null; select last_name from users_account where last_name='Namuag' and first_name='Maximus Aleksandre' \G

PAGER set to 'cat -> /dev/null'

3 rows in set (0.00 sec)


root[test]#> nopager; show status like 'Handler_read%';

PAGER set to stdout

+-----------------------+-------+

| Variable_name         | Value |

+-----------------------+-------+

| Handler_read_first    | 0 |

| Handler_read_key      | 1 |

| Handler_read_last     | 0 |

| Handler_read_next     | 3 |

| Handler_read_prev     | 0 |

| Handler_read_rnd      | 0 |

| Handler_read_rnd_next | 0     |

+-----------------------+-------+

7 rows in set (0.00 sec)

MySQL reveals that it does use index properly but noticeably, there's a cost overhead compared to a full-length index. That's obvious and explainable, since the prefix index does not cover the whole length of the field values. Using a prefix index is not a replacement, nor an alternative, of full-length indexing. It can also create poor results when using the prefix index inappropriately. So you need to determine what type of query and data you need to retrieve.

Covering Indexes

Covering Indexes doesn't require any special syntax in MySQL. A covering index in InnoDB refers to the case when all fields selected in a query are covered by an index. It does not need to do a sequential read over the disk to read the data in the table but only use the data in the index, significantly speeding up the query. For example, our query earlier i.e. 

select last_name from users_account where last_name='Namuag' and first_name='Maximus Aleksandre' \G

As mentioned earlier, is a covering index. When you have a very well-planned tables upon storing your data and created index properly, try to make as possible that your queries are designed to leverage covering index so that you'll benefit the result. This can help you maximize the efficiency of your queries and result to a great performance.

Leverage Tools That Offer Advisors or Query Performance Monitoring

Organizations often initially tend to go first on github and find open-source software that can offer great benefits. For simple advisories that helps you optimize your queries, you can leverage the Percona Toolkit. For a MySQL DBA, the Percona Toolkit is like a swiss army knife. 

For operations, you need to analyze how you are using your indexes, you can use pt-index-usage

Pt-query-digest is also available and it can analyze MySQL queries from logs, processlist, and tcpdump. In fact, the most important tool that you have to use for analyzing and inspecting bad queries is pt-query-digest. Use this tool to aggregate similar queries together and report on those that consume the most execution time.

For archiving old records, you can use pt-archiver. Inspecting your database for duplicate indexes, take leverage on pt-duplicate-key-checker. You might also take advantage of pt-deadlock-logger. Although deadlocks is not a cause of an underperforming and inefficient query but a poor implementation, yet it impacts query inefficiency. If you need table maintenance and requires you to add indexes online without affecting the database traffic going to a particular table, then you can use pt-online-schema-change. Alternatively, you can use gh-ost, which is also very useful for schema migrations.

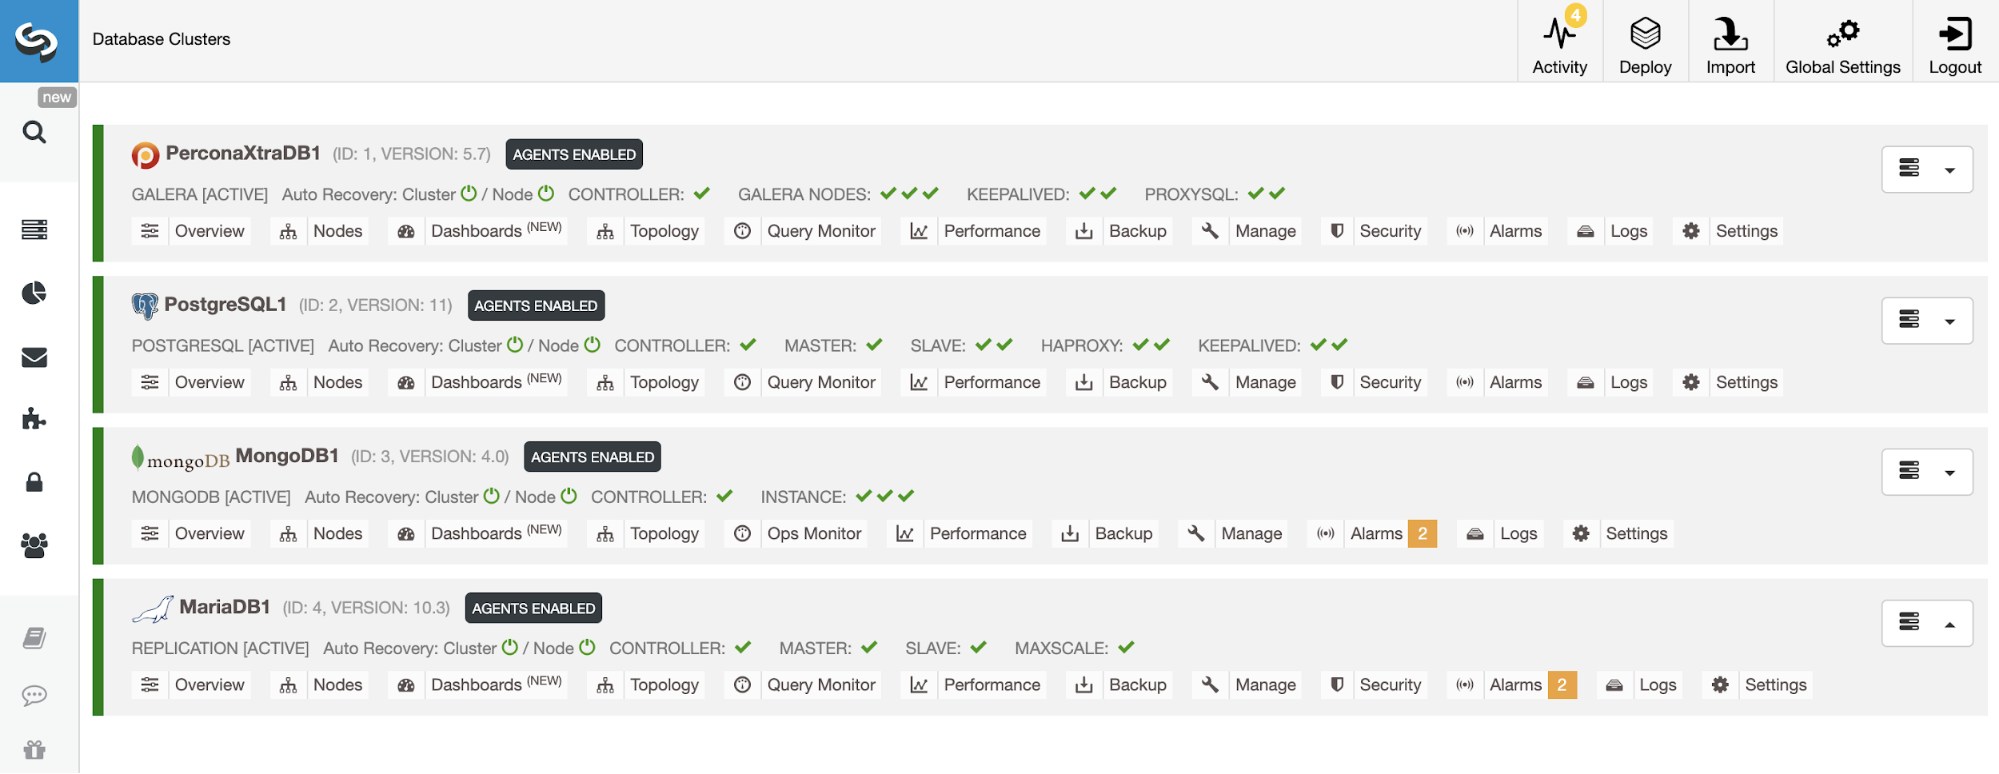
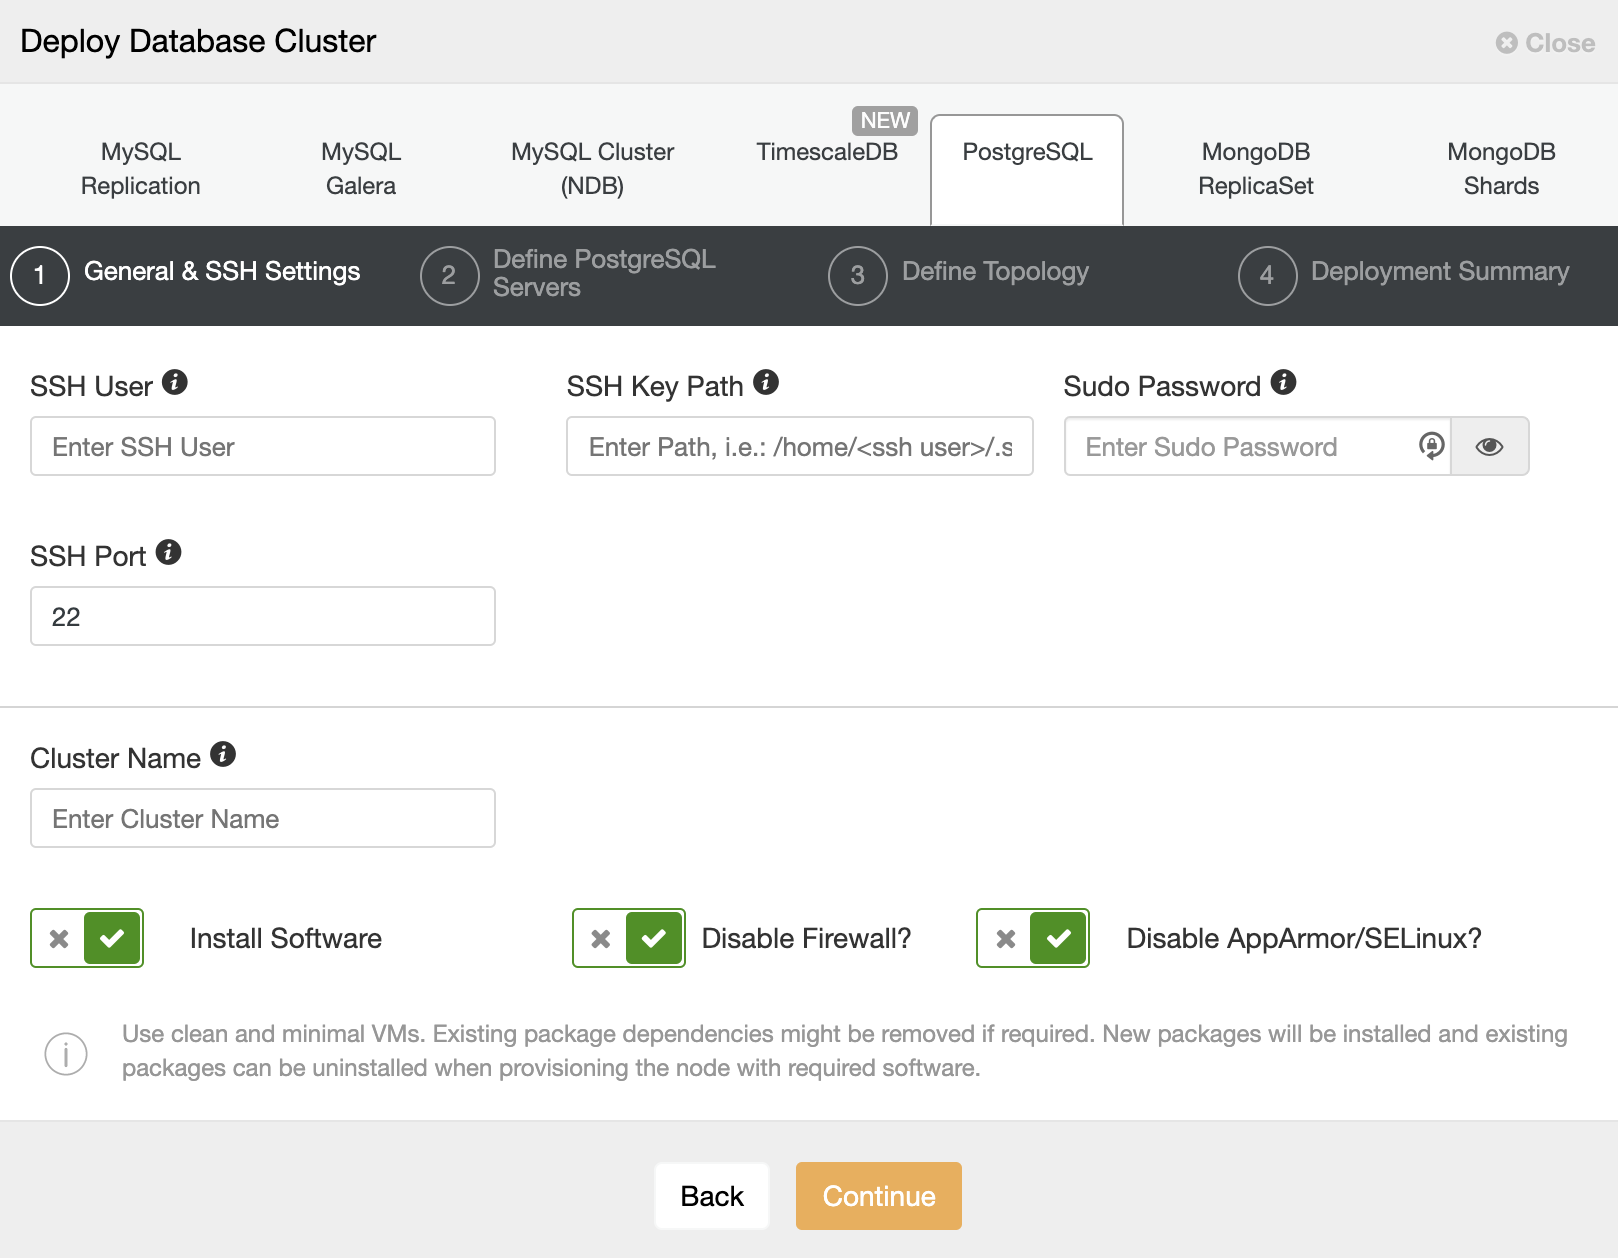
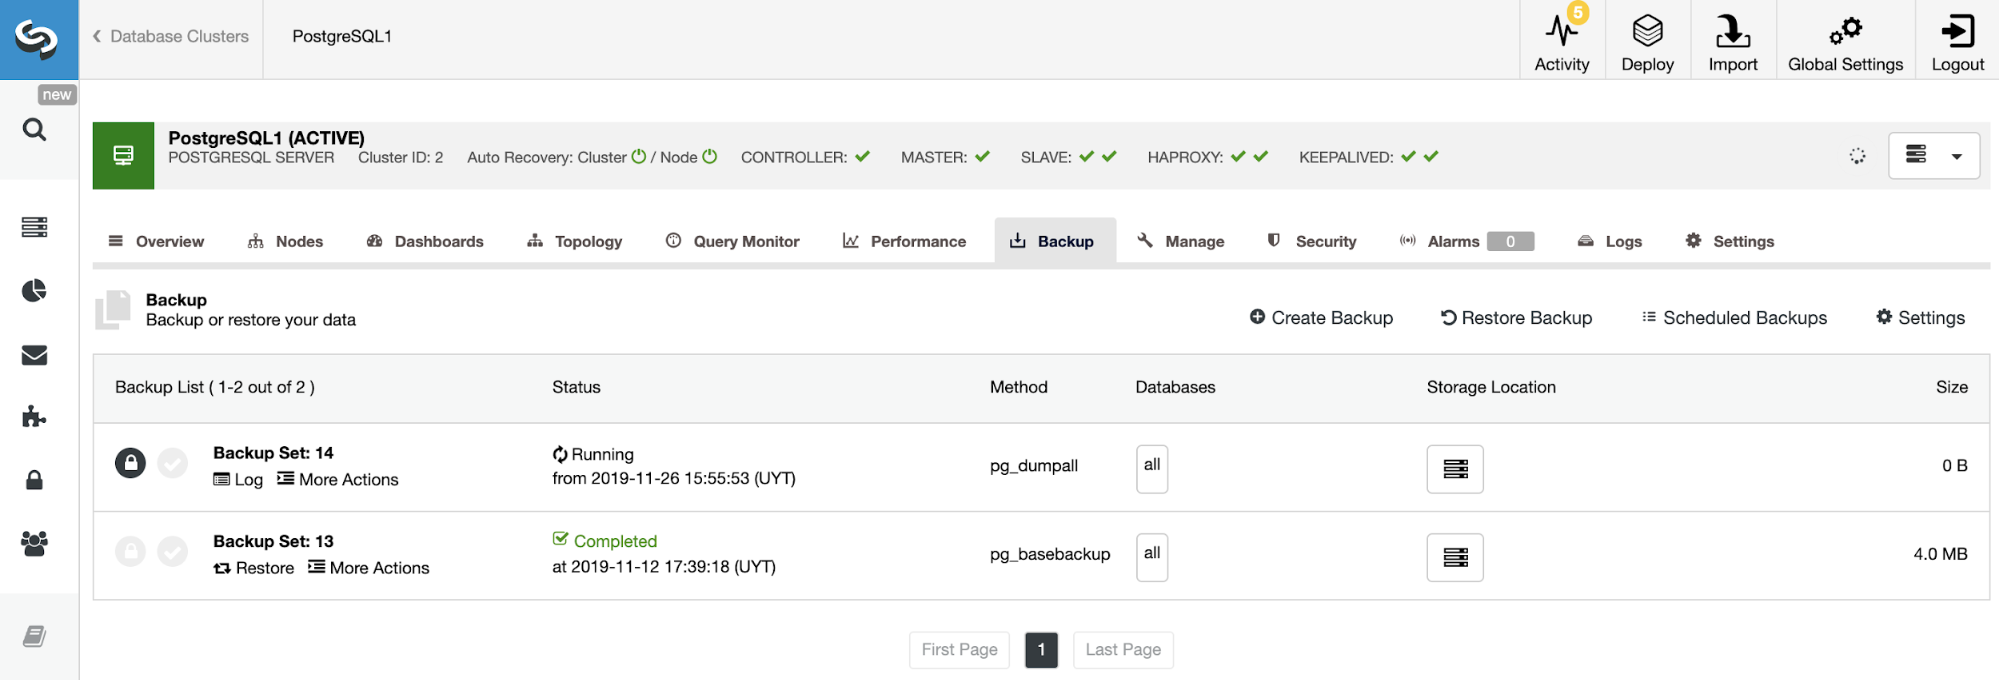
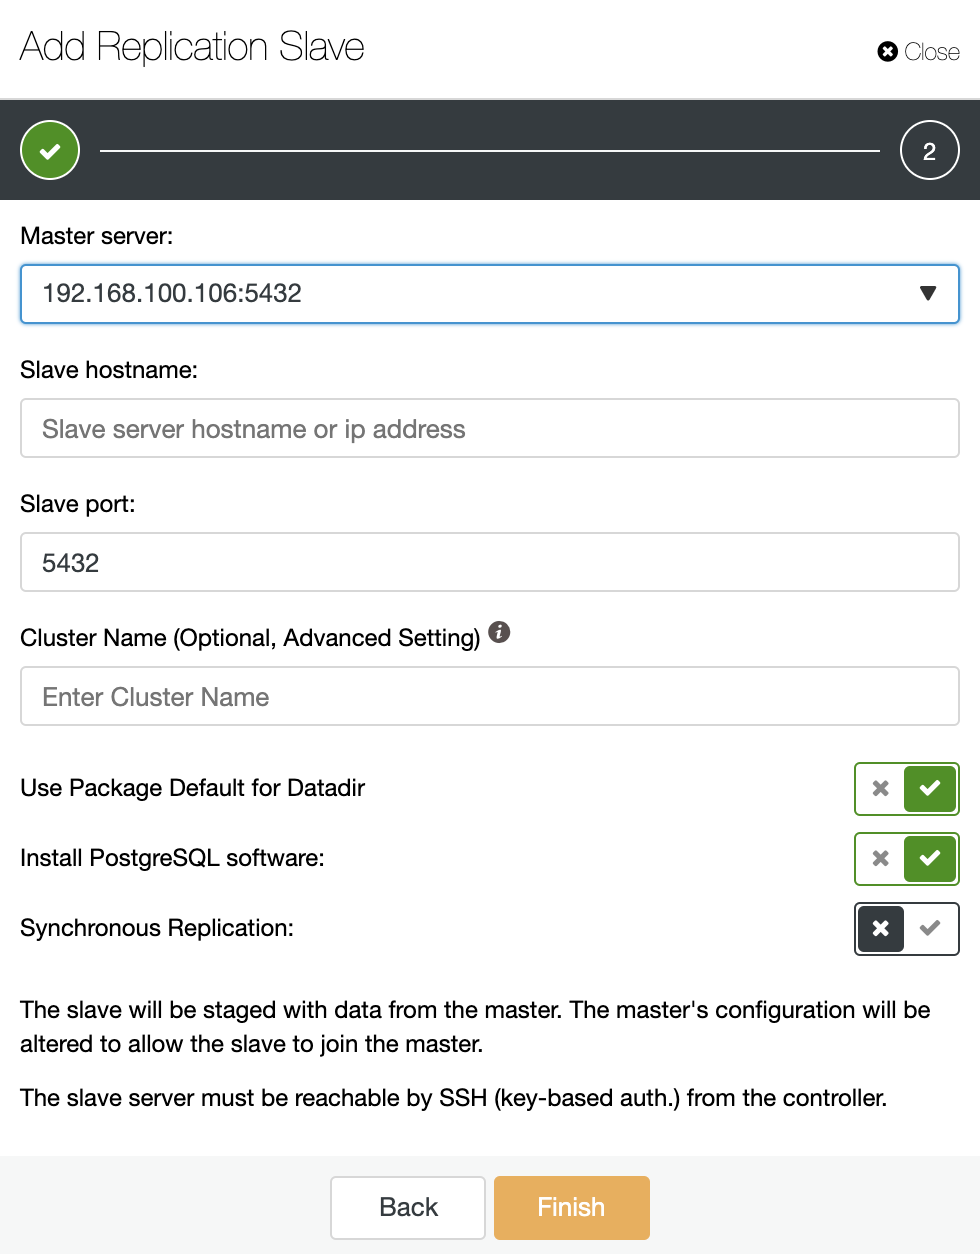
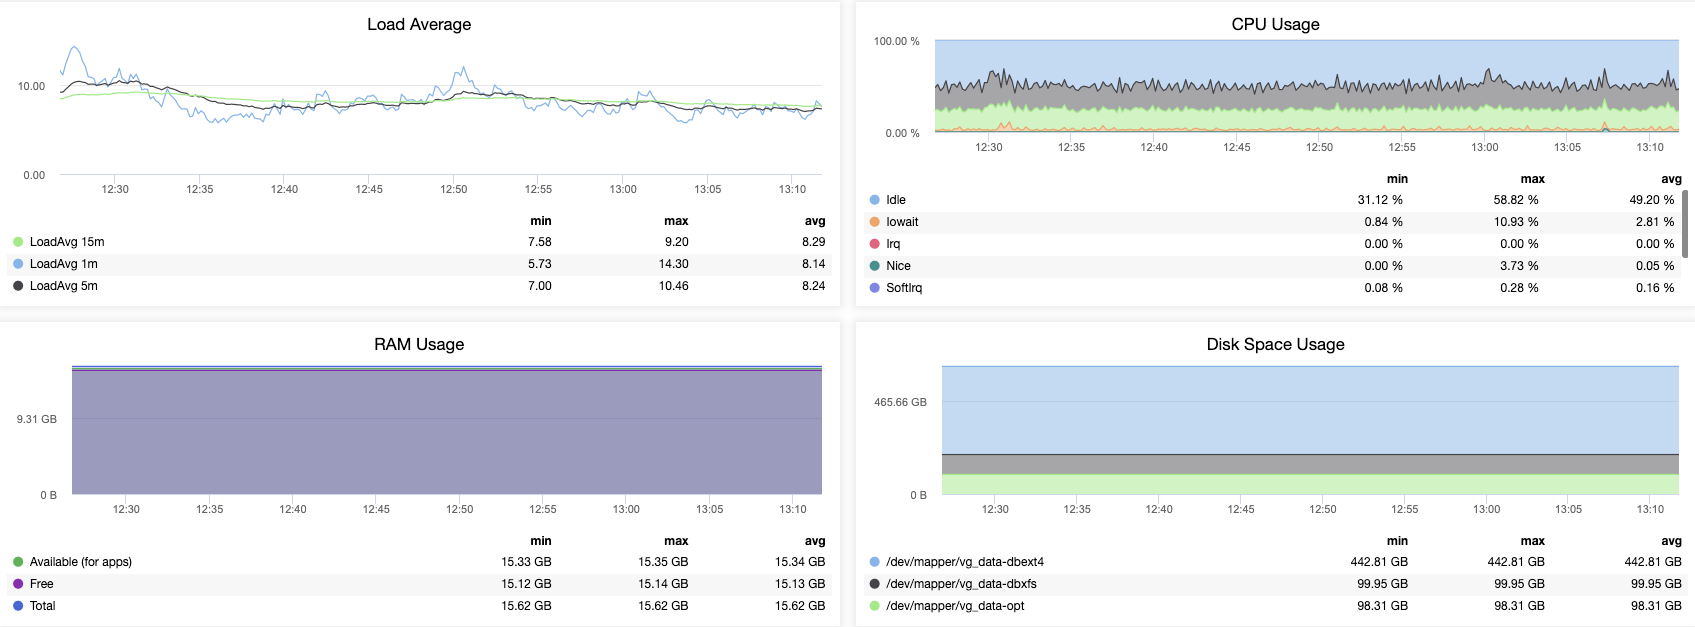
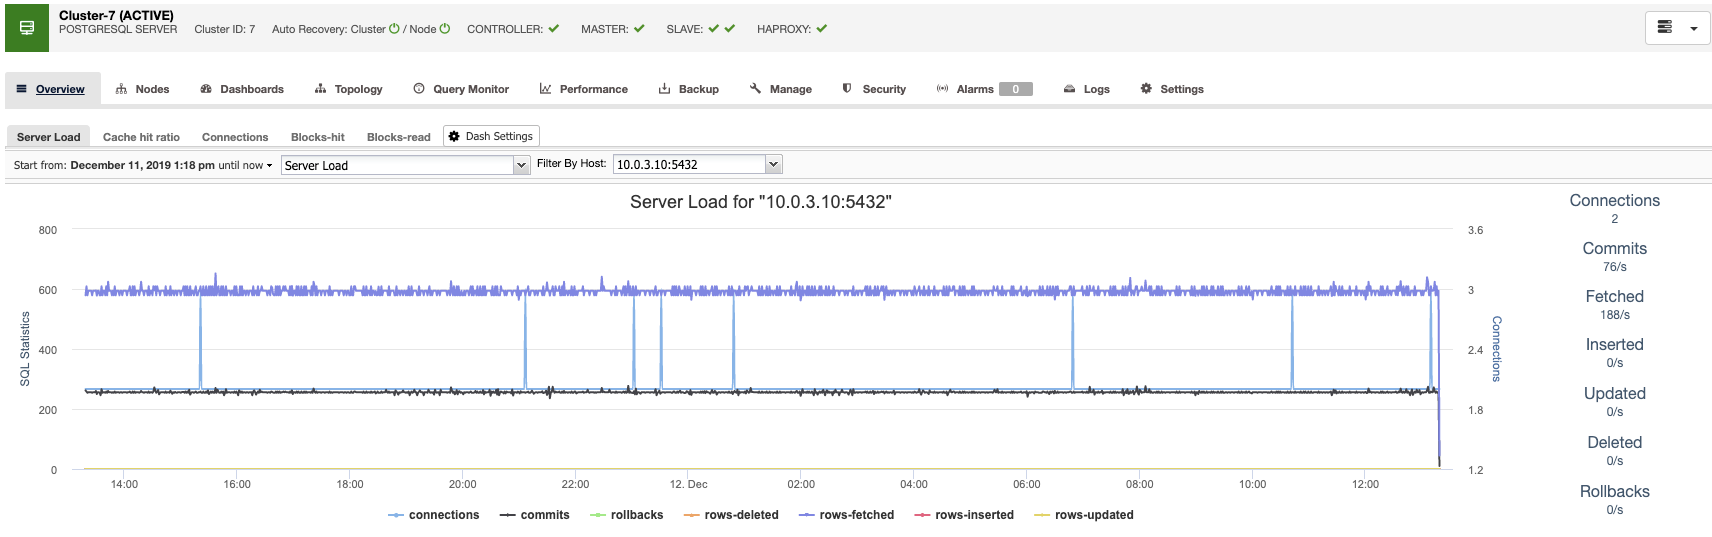
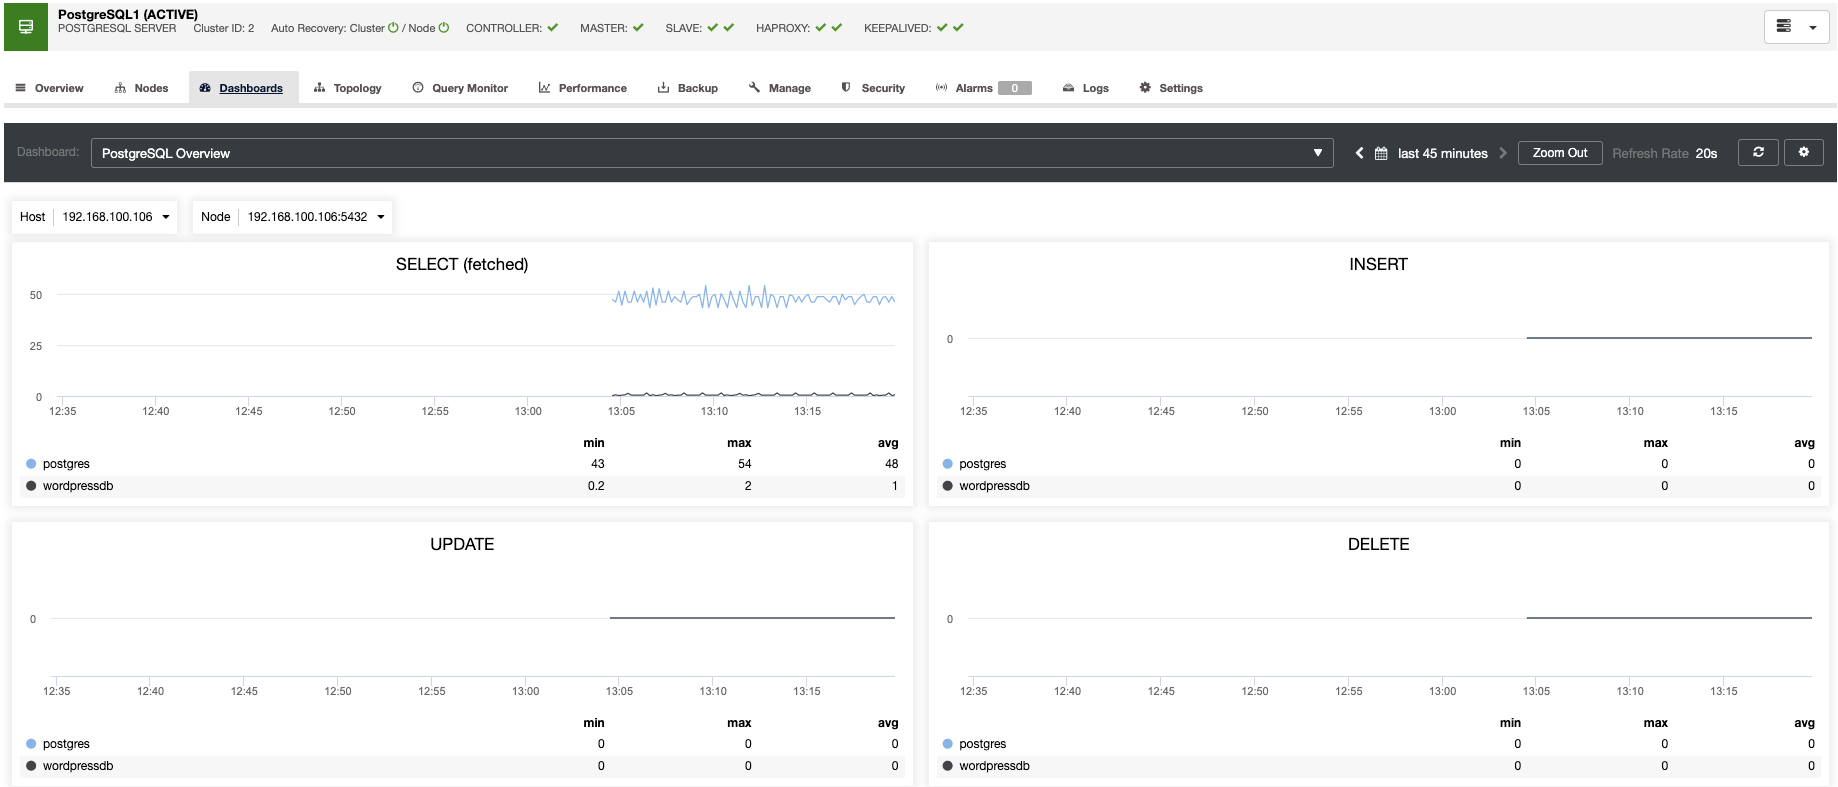
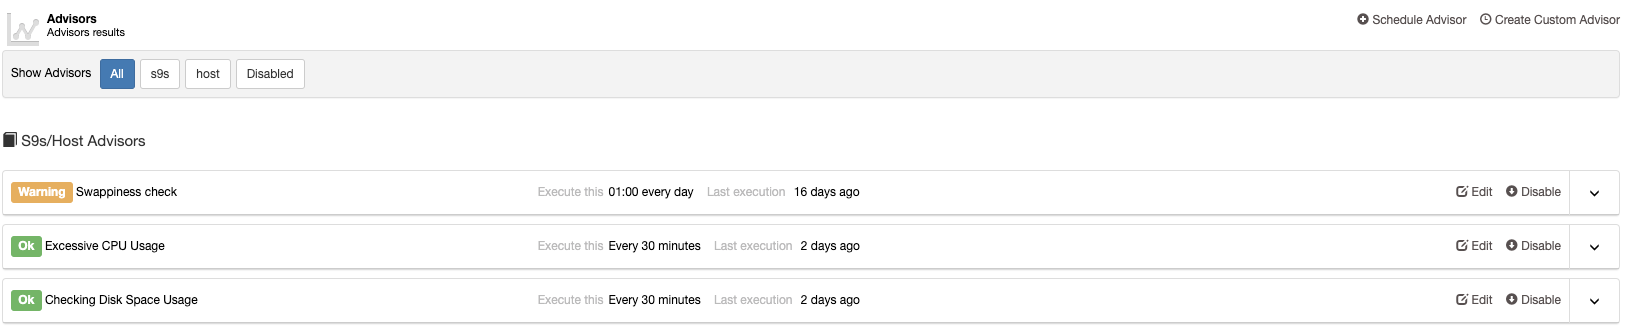
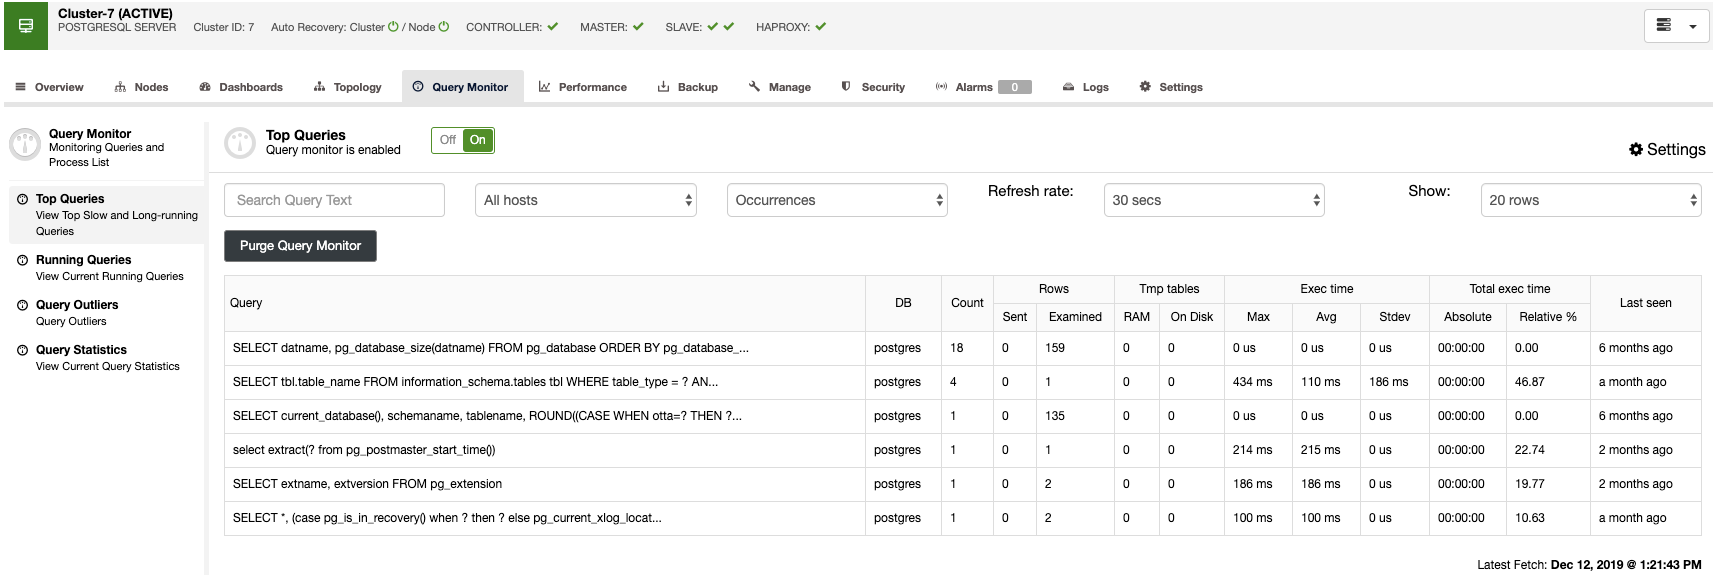
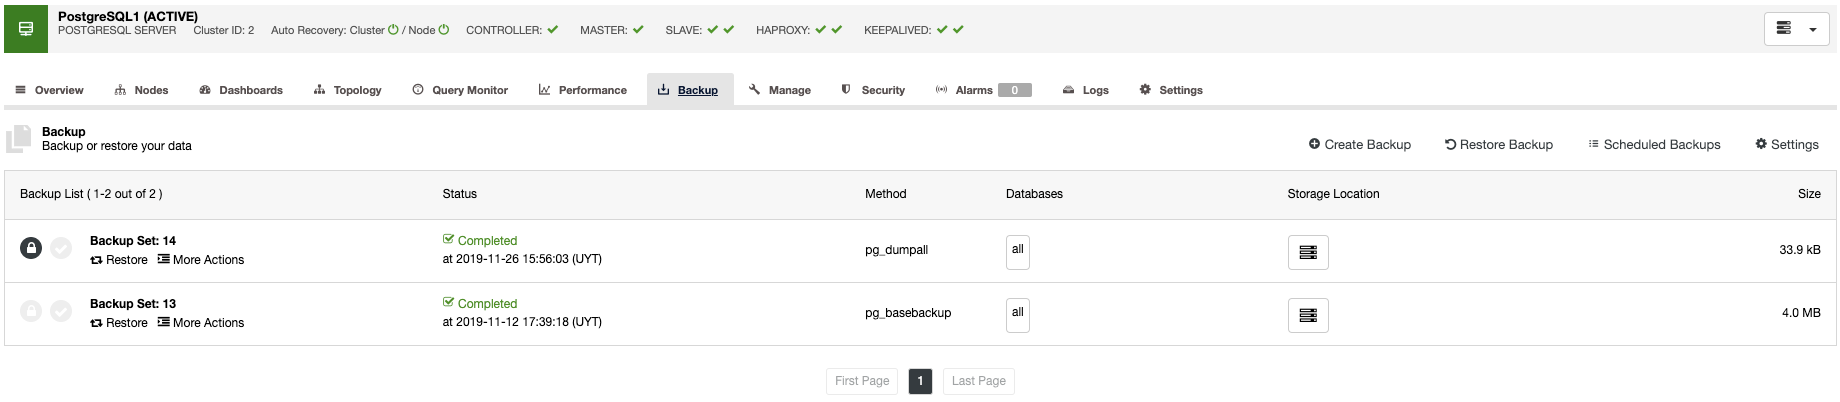
If you are looking for enterprise features, bundled with lots of features from query performance and monitoring, alarms and alerts, dashboards or metrics that helps you optimize your queries, and advisors, ClusterControl may be the tool for you. ClusterControl offers many features that show you Top Queries, Running Queries, and Query Outliers. Checkout this blog MySQL Query Performance Tuning which guides you how to be on par for monitoring your queries with ClusterControl.

Conclusion

As you've arrived at the ending part of our two-series blog. We covered here the factors that cause query degradation and how to resolve it in order to maximize your database queries. We also shared some tools that can benefit you and help solve your problems.


Cloud Vendor Deep-Dive: PostgreSQL on DigitalOcean

$
0
0

DigitalOcean is a cloud service provider, more of an IaaS (Infrastructure-as-a-Service) provider which is more suitable for small to medium scale businesses. You can get to know more about DigitalOcean here. What it does is a bit different to other cloud vendors like AWS or Azure and is not heavily global yet, take a look at this video which compares DigitalOcean with AWS. 

They provide a geographically distributed computing platform in the form of virtual machines where-in businesses can deploy their applications on cloud infrastructure in an easy, fast and flexible manner. Their core focus is to provide cloud environments which are highly flexible, easy-to-set-up and can scale for various types of workloads. 

What attracted me in DigitalOcean is the “droplets” service. Droplets are Linux based VMs which can be created as a standalone or can be part of a large cloud infrastructure with a chosen Linux flavoured operating systems like CentOS, Ubuntu, etc. 

PostgreSQL on DigitalOcean

With DigitalOcean, building PostgreSQL environments can be done in two ways, one way is to build manually from scratch using droplets (only Linux based VMs) or the other way is to use managed services.

DigitalOcean started managed services for PostgreSQL with an intention to speed up the provisioning of database servers in the form of VMs on a large cloud infrastructure. Otherwise, the only way is to build PostgreSQL environments is manually by using droplets. The supported capabilities with managed services are high-availability, automatic failover, logging, and monitoring. Alerting capability does not exist yet. 

The managed services more-or-less are similar to AWS RDS. The PostgreSQL instances can be only accessed using UI, there is no access to host running the database instance. Managing, Monitoring, parameter configuration, everything must be done from a UI.

PostgreSQL Compatibility with DigitalOcean

You can build PostgreSQL environments on Digital Ocean with the droplets or go for managed services (similar to AWS RDS) which can really save your time. The only supported versions on managed services are 10 and 11. This means, businesses willing to leverage DigitalOcean’s PostgreSQL managed services will need to use/upgrade-to either version 10 or 11. Also, note that there is no support for Windows operating system. 

This blog will focus on managed services.

Managed PostgreSQL Services

DigitalOcean started providing managed PostgreSQL database services since February 2019. The intention was to introduce a faster way to provisioning infrastructure with PostgreSQL instances which can save valuable time for infrastructure database professionals. Provisioning a PostgreSQL instance is rather simple.

This can be done by logging to the DO account → go to a create database cluster page → choose the PostgreSQL version → choose the specs based on pricing → choose the location → click create. You are all good. Watch this video here for a better understanding.

High Availability

High Availability is one of the critical requirements for databases to ensure business continuity. It is imperative to ensure that high-availability meets the SLAs defined for RTO and RPO. DigitalOcean provides high-availability services in a faster and reliable manner.

Pricing

The pricing model in DigitalOcean is not complex. The price of the instance is directly proportional to the capacity and architecture of the instance. Below is an example of pricing for a standalone instance -

The capacity and pricing which suites the requirement can be chosen from the available options. Minimum is $15 per month for 10GB of disk and 1vCPU. If high-availability is a requirement, standby node can be configured as well. The limitation is that, a standby node can be added only if the primary database size is of minimum 25 GB. And, only a maximum of 5 standby nodes can be added. Below are the standby options available

If you can observe above, standby pricing is pretty simple and does not depend on the capacity. Adding one standby node will cost $20 irrespective of any size.

Access

PostgreSQL instances build using managed services can be accessed using GUIs and remotely via CLI in SSL mode only. However, PostgreSQL instances manually installed on droplets can be accessed via ssh.

Data Centres

DigitalOcean is not heavily global yet. The data centres are located in a few countries as shown below. Which means, it is not possible to deploy/run services for businesses running their services in countries other than the ones shown below.

Advantages of PostgreSQL Managed Services

Managed services for PostgreSQL is advantageous for various reasons. In my experience as a DBA, the requirement often arises to build environments for developers in a faster manner possible to perform functional, regression, and performance testing for releases. Generally, the approach would be to use tools like chef or puppet to build automation modules for applications and database environments and then use those templates to build cloud VMs. DigitalOcean’s managed services can be a great, efficient, and cost-effective option for such requirements as it is bound to be time saving. Let us take a look at the advantageous in detail -

  • Opting for managed services can save a lot of time for DBAs and Developers in building PostgreSQL environments from scratch. This means, there is no database administration and maintenance overhead.
  • PostgreSQL environments can be equipped with High-availability with automatic failover capability. 
  • Managed instances are designed to sustain disaster. Daily backups can be configured with the PITR (point-in-time-recovery) capability. Importantly, backups are free.
  • Managed PostgreSQL instances are designed to be highly scalable. DigitalOcean’s customers were able to achieve higher scalability with PostgreSQL instances and TimescaleDB extensions.
  • Dashboard can be configured to monitor log files and query performance.
  • Cost model of DigitalOcean is pretty simple.
  • As it is a cloud infrastructure, vertical scaling can be seamless.
  • Managed database instances are highly secured and optimized. A big part of the data retrieval is only possible via SSL based connections.
  • Documentation is available in good detail.

Limitations of Running PostgreSQL on DigitalOcean

  • PostgreSQL versions 10 and 11 are supported, no other versions can be used.
  • Data centres of DigitalOcean are only available at limited geographical locations.
  • The number of standby nodes cannot exceed 5.
  • PITR cannot go beyond 7 days.
  • Not all extensions for PostgreSQL are supported, only selected extensions can be used.
  • The instances can only be up-sized. They cannot be downsized.
  • Superuser access is not allowed.
  • Alerting on certain thresholds is not available yet.
  • Managed database instances can only be restored to a new node when restoring from backups.

Conclusion

Managed PostgreSQL services offered by DigitalOcean is a great option for businesses looking for devops type solutions for PostgreSQL environments which can really help reduce time, planning, administration, and maintenance overhead involved in building high-scale and secured PostgreSQL environments for various workloads. Their pricing model is very simple and it can be a cost-effective option. It cannot, however, really be compared to the massive cloud service providers like AWS or Azure. DigitalOcean can surely benefit businesses with its innovative cloud solutions.

Viewing all 1476 articles
Browse latest View live