Quantcast
Channel: Severalnines
Viewing all 1476 articles
Browse latest View live

An Overview of Multi-Document ACID Transactions in MongoDB and How to Use Them

$
0
0

Database systems have a mandate to guarantee data consistency and integrity especially when critical data is involved. These aspects are enforced through ACID transactions in MongoDB. An ACID transaction should meet some defined rules for data validity before making any updates to the database otherwise it should be aborted and no changes shall be made to the database. All database transactions are considered as a single logical operation and during the execution time the database is put in an inconsistent state until the changes have been committed. Operations that successfully change the state of the database are termed as write transactions whereas those that do not update the database but only retrieve data are referred to as read-only transactions. ACID is an acronym for Atomicity, Consistency, Isolation, and Durability. 

A database is a shared resource that can be accessed by different users at different or at the same time. For this reason, concurrent transactions may happen and if not well managed, they may result in system crashes, hardware failure, deadlock, slow database performance or repetition in the execution of the same transaction.

What Are ACID Rules?

All database systems must meet the ACID properties in order to guarantee data integrity.

Atomicity

A transaction is considered as a single unit of operation which can either succeed completely or fail completely. A transaction cannot be executed partially. If any condition consulting a transaction fails, the entire transaction will fail completely and the database will remain unchanged. For example, if you want to transfer funds from account X to Y, here there are two transactions, the first one is to remove funds from X and the second one is to record the funds in Y. If the first transaction fails, the whole transaction will be aborted

Consistency

When an operation is issued, before execution, the database is in a consistent state and it should remain so after every transaction. Even if there is an update, the transaction should always bring the database to a valid state, maintaining the database invariants. For instance, you cannot delete a primary key which has been referenced as a foreign key in another collection.  All data must meet the defined constraints to prevent data corruption from an illegal transaction.

Isolation

Multiple transactions running concurrently are executed without affecting each other and their result should be the same if they were to be executed sequentially. When two or more transactions modify the same documents in MongoDB, there may be a conflict. The database will detect a conflict immediately before it is committed. The first operation to acquire a lock on the document will continue whereas the other will fail and a conflict error message will be presented.

Durability

This dictates that, once the transaction has been committed, the changes should be upheld at all times even at an event of a system failure for example due to power outages or internet disconnection. 

MongoDB ACID Transactions

MongoDB is a document based  NoSQL database with a flexible schema. Transactions are not operations that should be executed for every write operation  since they incur a greater performance cost over a single document writes. With a document based structure and denormalized data model, there will be a minimized need for transactions. Since MongoDB allows document embedding, you don’t necessarily need to use a transaction to meet a write operation.

MongoDB version 4.0 provides multi-document transaction support for replica set deployments only and probably the version 4.2 will extend support for sharded deployments (per their release notes). 

Example of a transaction:

Ensure you have a replica set in place first. Assuming you have a database called app and a collection users in the Mongo Shell run the following commands:

$mongos and you should see something like username:PRIMARY>

$use app

$db.users.insert([{_id:1, name: ‘Brian’}, {_id:2, name: ‘Sheila’}, {_id:3, name: ‘James’}])

We need to start a session for our transaction:

$db.getMongo().startSession() and you should see something like 

session { "id" : UUID("dcfa8de5-627d-3b1c-a890-63c9a355520c") }

Using this session we can add more users using a transaction with the following commands 

$session.startTransaction()

session.getDatabase(‘app’).users.insert({_id:4, name:  ‘Hitler’})

You will be presented with WriteResult({“nInsterted”: 2})

The transaction has not yet been committed and the normal $db.users.find({}) will give us the previously saved users only. But if we run the 

$session.getDatabase(“app”).users.find()

the last added record will be available in the returned results. To commit this transaction, we run the command below

$session.commitTransaction()

The transaction modification is stored in memory that is why even after failure, the data will be available on recovery.

Multi-Document ACID Transactions in MongoDB

These are multi-statement operations that need to be executed sequentially without affecting each other. For the sample above we can create two transactions, one to add a user and another to update a user with a field of age. I.e.

$session.startTransaction()

   db.users.insert({_id:6, name “Ibrahim”})

   db.users.updateOne({_id:3 , {$set:{age:50}}})

session.commit_transaction()

Transactions can be applied to operations against multiple documents contained in one or many collection/database. Any changes due to document transaction do not impact performance for workloads not related or do not require them. Until the transaction is committed, uncommitted writes are neither replicated to the secondary nodes nor are they readable outside the transactions.

Best Practices for MongoDB Transactions

The multi-document transactions are only supported in the WiredTiger storage engine. As mentioned before, very few applications would require transactions and if so, we should try to make them short. Otherwise, for a single ACID transaction, if you try performing an excessive number of operations, it can result in high pressure on the WiredTiger cache. The cache is always dictated to maintain state for all subsequent writes since the oldest snapshot was created. This means new writes will accumulate in the cache throughout the duration of the transaction and will be flushed only after transactions currently running on old snapshots are committed or aborted. For the best database performance on the transaction, developers should consider:

  1. Always modify a small number of documents in a transaction. Otherwise, you will need to break the transaction into different parts and process the documents in different batches. At most, process 1000 documents at a time.
  2. Temporary exceptions such as awaiting to elect primary and transient network hiccups may result in abortion of the transaction. Developers should establish a logic to retry the transaction if the defined errors are presented.
  3. Configure optimal duration for the execution of the transaction from the default 60 seconds provided by MongoDB. Besides, employ indexing so that it can allow fast data access within the transaction.  You also have the flexibility to fine-tune the transaction in addressing timeouts by breaking it into batches that allow its execution within the time limits.
  4. Decompose your transaction into a small set of operation so that it fits the 16MB size constraints. Otherwise, if the operation together with oplog description exceed this limit, the transaction will be aborted.
  5. All data relating to an entity should be stored in a single, rich document structure. This is to reduce the number of documents that are to be cached when different fields are going to be changed.

Limitations of Transactions

  1. You cannot create or drop a collection inside a transaction.
  2. Transactions cannot make writes to a capped collection
  3. Transactions take plenty of time to execute and somehow they can slow the performance of the database.
  4. Transaction size is limited to 16MB requiring one to split any that tends to exceed this size into smaller transactions.
  5. Subjecting a large number of documents to a transaction may exert excessive pressure on the WiredTiger engine and since it relies on the snapshot capability, there will be a retention of large unflushed operations in memory. This renders some performance cost on the database.

Conclusion

MongoDB version 4.0 introduced the multi-document transaction support for replica sets as a feature of improving data integrity and consistency. However, there are very few applications that would require transactions when using MongoDB. There are limitations against this feature that make it considerably little bit immature as far as the transactions concept is concerned. For instance, transactions for a sharded cluster are not supported and they cannot be larger than 16MB size limit. Data modeling provides a better structure for reducing transactions in your database. Unless you are dealing with special cases, it will be a better practice to avoid transactions in MongoDB.


Full MariaDB Encryption At-Rest and In-Transit for Maximum Data Protection - Part One

$
0
0

In this blog series, we are going to give you a complete walkthrough on how to configure a fully encrypted MariaDB server for at-rest and in-transit encryption, to ensure maximum protection of the data from being stolen physically or while transferring and communicating with other hosts. The basic idea is we are going to turn our "plain" deployment into a fully encrypted MariaDB replication, as simplified in the following diagram:

We are going to configure a number of encryption components:

  • In-transit encryption, which consists of:
    • Client-server encryption
    • Replication encryption
  • At-rest encryption, which consists of:
    • Data file encryption
    • Binary/relay log encryption.

Note that this blog post only covers in-transit encryption. We are going to cover at-rest encryption in the second part of this blog series.

This deployment walkthrough assumed that we already have an already running MariaDB replication server. If you don't have one, you can use ClusterControl to deploy a new MariaDB replication within minutes, with fewer than 5 clicks. All servers are running on MariaDB 10.4.11 on CentOS 7 system.

In-Transit Encryption

Data can be exposed to risks both in transit and at rest and requires protection in both states. In-transit encryption protects your data if communications are intercepted while data moves between hosts through network, either from your site and the cloud provider, between services or between clients and the server.

For MySQL/MariaDB, data is in motion when a client connects to a database server, or when a slave node replicates data from a master node. MariaDB supports encrypted connections between clients and the server using the TLS (Transport Layer Security) protocol. TLS is sometimes referred to as SSL (Secure Sockets Layer) but MariaDB does not actually use the SSL protocol for encrypted connections because its encryption is weak. More details on this at MariaDB documentation page.

Client-Server Encryption

In this setup we are going to use self-signed certificates, which means we do not use external parties like Google, Comodo or any popular Certificate Authority provider out there to verify our identity. In SSL/TLS, identity verification is the first step that must be passed before the server and client exchange their certificates and keys.

MySQL provides a very handy tool called mysql_ssl_rsa_setup which takes care of the key and certificate generation automatically. Unfortunately, there is no such tool for MariaDB server yet. Therefore, we have to manually prepare and generate the SSL-related files for our MariaDB TLS needs.

The following is a list of the files that we will generate using OpenSSL tool:

  • CA key - RSA private key in PEM format. Must be kept secret.
  • CA certificate - X.509 certificate in PEM format. Contains public key and certificate metadata.
  • Server CSR - Certificate signing request. The Common Name (CN) when filling the form is important, for example CN=mariadb-server
  • Server key - RSA private key. Must be kept secret.
  • Server cert - X.509 certificate signed by CA key. Contains public key and certificate metadata.
  • Client CSR - Certificate signing request. Must use a different Common Name (CN) than Server's CSR, for example CN=client1 
  • Client key - RSA private key. Must be kept secret.
  • Client cert - X.509 certificate signed by CA key. Contains public key and certificate metadata.

First and foremost, create a directory to store our certs and keys for in-transit encryption:

$ mkdir -p /etc/mysql/transit/

$ cd /etc/mysql/transit/

Just to give you an idea why we name the directory as mentioned is because in the next part of this blog series, we will create another directory for at-rest encryption at /etc/mysql/rest.

Certificate Authority

Generate a key file for our own Certificate Authority (CA):

$ openssl genrsa 2048 > ca-key.pem

Generating RSA private key, 2048 bit long modulus

.......................+++

...............................................................................................................................................................................................................................................+++

e is 65537 (0x10001)

Generate a certificate for our own Certificate Authority (CA) based on the ca-key.pem generated before with expiration of 3650 days:

$ openssl req -new -x509 -nodes -days 3650 -key ca-key.pem -out ca.pem

You are about to be asked to enter information that will be incorporated

into your certificate request.

What you are about to enter is what is called a Distinguished Name or a DN.

There are quite a few fields but you can leave some blank

For some fields there will be a default value,

If you enter '.', the field will be left blank.

-----

Country Name (2 letter code) [XX]:SE

State or Province Name (full name) []:Stockholm

Locality Name (eg, city) [Default City]:Stockholm

Organization Name (eg, company) [Default Company Ltd]:Severalnines

Organizational Unit Name (eg, section) []:

Common Name (eg, your name or your server's hostname) []:CA

Email Address []:info@severalnines.com

Now we should have ca-key.pem and ca.pem under this working directory.

Key and Certificate for Server

Next, generate private key for the MariaDB server:

$ openssl genrsa 2048 > server-key.pem

Generating RSA private key, 2048 bit long modulus

.............................................................................................................+++

..................................................................................................................+++

e is 65537 (0x10001)

A trusted certificate must be a certificate signed by a Certificate Authority whereby here, we are going to use our own CA because we trust the hosts in the network. Before we can create a signed certificate, we need to generate a request certificate called Certificate Signing Request (CSR).

Create a CSR for MariaDB server. We are going to call the certificate as server-req.pem. This is not the certificate that we are going to use for MariaDB server. The final certificate is the one that will be signed by our own CA private key (as shown in the next step):

$ openssl req -new -key server-key.pem -out server-cert.pem

You are about to be asked to enter information that will be incorporated

into your certificate request.

What you are about to enter is what is called a Distinguished Name or a DN.

There are quite a few fields but you can leave some blank

For some fields there will be a default value,

If you enter '.', the field will be left blank.

-----

Country Name (2 letter code) [XX]:SE

State or Province Name (full name) []:Stockholm

Locality Name (eg, city) [Default City]:Stockholm

Organization Name (eg, company) [Default Company Ltd]:Severalnines

Organizational Unit Name (eg, section) []:

Common Name (eg, your name or your server's hostname) []:MariaDBServer

Email Address []:info@severalnines.com


Please enter the following 'extra' attributes

to be sent with your certificate request

A challenge password []:

An optional company name []:

Take note on the Common Name where we specified "MariaDBServer". This can be any name but the value must not be the same as the client certificate. Commonly, if the applications connect to the MariaDB server via FQDN or hostname (skip-name-resolve=OFF), you probably want to specify the MariaDB server's FQDN as the Common Name. Doing so allows you to connect with 

We can then generate the final X.509 certificate (server-cert.pem) and sign the CSR (server-req.pem) with CA's certificate (ca.pem) and CA's private key (ca-key.pem):

$ openssl x509 -req -in server-req.pem -CA ca.pem -CAkey ca-key.pem -CAcreateserial -out server-cert.pem -days 3650 -sha256

Signature ok

subject=/C=SE/ST=Stockholm/L=Stockholm/O=Severalnines/CN=MariaDBServer/emailAddress=info@severalnines.com

Getting CA Private Key

At this point, this is what we have now:

$ ls -1 /etc/mysql/transite

ca-key.pem

ca.pem

server-cert.pem

server-key.pem

server-req.pem

We only need the signed certificate (server-cert.pem) and the private key (server-key.pem) for the MariaDB server. The CSR (server-req.pem) is no longer required.

Key and Certificate for the Client

Next, we need to generate key and certificate files for the MariaDB client. The MariaDB server will only accept remote connection from the client who has these certificate files. 

Start by generating a 2048-bit key for the client:

$ openssl genrsa 2048 > client-key.pem

Generating RSA private key, 2048 bit long modulus

.............................................................................................................+++

..................................................................................................................+++

e is 65537 (0x10001)

Create CSR for the client called client-req.pem:

$ openssl req -new -key client-key.pem -out client-req.pem

You are about to be asked to enter information that will be incorporated

into your certificate request.

What you are about to enter is what is called a Distinguished Name or a DN.

There are quite a few fields but you can leave some blank

For some fields there will be a default value,

If you enter '.', the field will be left blank.

-----

Country Name (2 letter code) [XX]:SE

State or Province Name (full name) []:Stockholm

Locality Name (eg, city) [Default City]:Stockholm

Organization Name (eg, company) [Default Company Ltd]:Severalnines

Organizational Unit Name (eg, section) []:

Common Name (eg, your name or your server's hostname) []:Client1

Email Address []:info@severalnines.com


Please enter the following 'extra' attributes

to be sent with your certificate request

A challenge password []:

An optional company name []:

Pay attention to the Common Name where we specify "Client1". Specify any name that represents the client. This value must be different from the server's Common Name. For advanced usage, you can use this Common Name to allow certain user with certificate matching this value, for example:

MariaDB> GRANT SELECT ON schema1.* TO 'client1'@'192.168.0.93' IDENTIFIED BY 's' REQUIRE SUBJECT '/CN=Client2';

We can then generate the final X.509 certificate (client-cert.pem) and sign the CSR (client-req.pem) with CA's certificate (ca.pem) and CA's private key (ca-key.pem):

$ openssl x509 -req -in client-req.pem -CA ca.pem -CAkey ca-key.pem -CAcreateserial -out client-cert.pem -days 3650 -sha256

Signature ok

subject=/C=SE/ST=Stockholm/L=Stockholm/O=Severalnines/CN=Client1/emailAddress=info@severalnines.com

Getting CA Private Key

All certificates that we need for in-transit encryption setup are generated. Verify both certificates are correctly signed by the CA:

$ openssl verify -CAfile ca.pem server-cert.pem client-cert.pem

server-cert.pem: OK

client-cert.pem: OK

Configuring SSL for MariaDB

Create a new directory on the every slave:

(slave1)$ mkdir -p /etc/mysql/transit/

(slave2)$ mkdir -p /etc/mysql/transit/

Copy the encryption files to all slaves:

$ scp -r /etc/mysql/transit/* root@slave1:/etc/mysql/transit/

$ scp -r /etc/mysql/transit/* root@slave2:/etc/mysql/transit/

Make sure the owner of the certs directory to the "mysql" user and change the permissions of all key files so it won't be readable globally:

$ cd /etc/mysql/transit

$ chown -R mysql:mysql *

$ chmod 600 client-key.pem server-key.pem ca-key.pem

Here is what you should see when listing out files under "transit" directory:

$ ls -al /etc/mysql/transit

total 32

drwxr-xr-x. 2 root  root 172 Dec 14 04:42 .

drwxr-xr-x. 3 root  root 24 Dec 14 04:18 ..

-rw-------. 1 mysql mysql 1675 Dec 14 04:19 ca-key.pem

-rw-r--r--. 1 mysql mysql 1383 Dec 14 04:22 ca.pem

-rw-r--r--. 1 mysql mysql 1383 Dec 14 04:42 client-cert.pem

-rw-------. 1 mysql mysql 1675 Dec 14 04:42 client-key.pem

-rw-r--r--. 1 mysql mysql 1399 Dec 14 04:42 client-req.pem

-rw-r--r--. 1 mysql mysql 1391 Dec 14 04:34 server-cert.pem

-rw-------. 1 mysql mysql 1679 Dec 14 04:28 server-key.pem

-rw-r--r--. 1 mysql mysql 1415 Dec 14 04:31 server-req.pem

Next, we will enable the SSL connection for MariaDB. On every MariaDB host (master and slaves) edit the configuration file and add the following lines under [mysqld] section:

ssl-ca=/etc/mysql/transit/ca.pem

ssl-cert=/etc/mysql/transit/server-cert.pem

ssl-key=/etc/mysql/transit/server-key.pem

Restart MariaDB server one node at a time, starting from slaves and finally on the master:

(slave1)$ systemctl restart mariadb

(slave2)$ systemctl restart mariadb

(master)$ systemctl restart mariadb

After restarted, MariaDB is now capable of accepting plain connections by connecting to it without any SSL-related parameters or with encrypted connections, when you specify SSL-related parameter in the connection string.

For ClusterControl users, you can enable client-server encryption a matter of clicks. Just go to ClusterControl -> Security -> SSL Encryption -> Enable -> Create Certificate -> Certificate Expiration -> Enable SSL:

ClusterControl will generate the required keys, X.509 certificate and CA certificate and set up SSL encryption for client-server connections for all the nodes in the cluster. For MySQL/MariaDB replication, the SSL files will be located under /etc/ssl/replication/cluster_X, where X is the cluster ID on every database node. The same certificates will be used on all nodes and the existing ones might be overwritten. The nodes must be restarted individually after this job completes. We recommend that you first restart a replication slave and verify that the SSL settings work.

To restart every node, go to ClusterControl -> Nodes -> Node Actions -> Restart Node. Do restart one node at a time, starting with the slaves. The last node should be the master node with force stop flag enabled:

You can tell if a node is able to handle client-server encryption by looking at the green lock icon right next to the database node in the Overview grid:

At this point, our cluster is now ready to accept SSL connection from MySQL users.

Connecting via Encrypted Connection

The MariaDB client requires all client-related SSL files that we have generated inside the server. Copy the generated client certificate, CA certificate and client key to the client host:

$ cd /etc/mysql/transit

$ scp client-cert.pem client-key.pem ca.pem root@client-host:~

**ClusterControl generates the client SSL files under /etc/ssl/replication/cluster_X/on every database node, where X is the cluster ID.

Create a database user that requires SSL on the master:

MariaDB> CREATE SCHEMA sbtest;

MariaDB> CREATE USER sbtest@'%' IDENTIFIED BY 'mysecr3t' REQUIRE SSL;

MariaDB> GRANT ALL PRIVILEGES ON sbtest.* to sbtest@'%';

From the client host, connect to the MariaDB server with SSL-related parameters. We can verify the connection status by using "STATUS" statement:

(client)$ mysql -usbtest -p -h192.168.0.91 -P3306 --ssl-cert client-cert.pem --ssl-key client-key.pem --ssl-ca ca.pem -e 'status'

...

Current user: sbtest@192.168.0.19

SSL: Cipher in use is DHE-RSA-AES256-GCM-SHA384

...

Pay attention to the SSL line where the cipher is used for the encryption. This means the client is successfully connected to the MariaDB server via encrypted connection. 

At this point, we have encrypted the client-server connection to the MariaDB server, as represented by the green two-headed arrow in the following diagram:

In the next part, we are going to encrypt replication connections between nodes.

Replication Encryption

Setting up encrypted connections for replication is similar to doing so for client/server connections. We can use the same client certificates, key and CA certificate to let the replication user access the master's server via encryption channel. This will indirectly enable encryption between nodes when slave IO thread pulls replication events from the master. 

Let's configure this on one slave at a time. For the first slave, 192.168.0.92, add the following line under [client] section inside MariaDB configuration file:

[client]

ssl-ca=/etc/mysql/transit/ca.pem

ssl-cert=/etc/mysql/transit/client-cert.pem

ssl-key=/etc/mysql/transit/client-key.pem

Stop the replication thread on the slave:

(slave)MariaDB> STOP SLAVE;

On the master, alter the existing replication user to force it to connect using SSL:

(master)MariaDB> ALTER USER rpl_user@192.168.0.92 REQUIRE SSL;

On the slave, test the connectivity to the master, 192.168.0.91 via mysql command line with --ssl flag:

(slave)MariaDB> mysql -urpl_user -p -h192.168.0.91 -P 3306 --ssl -e 'status'

...

Current user: rpl_user@192.168.0.92

SSL: Cipher in use is DHE-RSA-AES256-GCM-SHA384

...

Make sure you can get connected to the master host without error. Then, on the slave, specify the CHANGE MASTER statement with SSL parameters as below:

(slave)MariaDB> CHANGE MASTER TO MASTER_SSL = 1, MASTER_SSL_CA = '/etc/mysql/transit/ca.pem', MASTER_SSL_CERT = '/etc/mysql/transit/client-cert.pem', MASTER_SSL_KEY = '/etc/mysql/transit/client-key.pem';

Start the replication slave:

(slave)MariaDB> START SLAVE;

Verify that the replication is running okay with related SSL parameters:

MariaDB> SHOW SLAVE STATUS\G

...

              Slave_IO_Running: Yes

             Slave_SQL_Running: Yes

            Master_SSL_Allowed: Yes

            Master_SSL_CA_File: /etc/mysql/transit/ca.pem

               Master_SSL_Cert: /etc/mysql/transit/client-cert.pem

                Master_SSL_Key: /etc/mysql/transit/client-key.pem

...

The slave is now replicating from the master securely via TLS encryption.

Repeat all of the above steps on the remaining slave, 192.168.0.93. The only difference is the alter user statement to be executed on the master where we have to change to its respective host:

(master)MariaDB> ALTER USER rpl_user@192.168.0.93 REQUIRE SSL;

At this point we have completed in-transit encryption as illustrated by the green lines from master to slaves in the following diagram:

You can verify the encryption connection by looking at the tcpdump output for interface eth1 on the slave. The following is an example of standard replication without encryption:

(plain-slave)$ tcpdump -i eth1 -s 0 -l -w - 'src port 3306 or dst port 3306' | strings

tcpdump: listening on eth1, link-type EN10MB (Ethernet), capture size 262144 bytes

H"-'

binlog.000008Ulw

binlog.000008Ulw

sbtest

sbtest

create table t1 (id INT AUTO_INCREMENT PRIMARY KEY, data VARCHAR(255))

binlog.000008

sbtest

BEGIN3

sbtest

test data3

Ok*Z

binlog.000008*Z

^C11 packets captured

11 packets received by filter

0 packets dropped by kernel

We can clearly see the text as read by the slave from the master. While on an encrypted connection, you should see gibberish characters like below:

(encrypted-slave)$ tcpdump -i eth1 -s 0 -l -w - 'src port 3306 or dst port 3306' | strings

tcpdump: listening on eth1, link-type EN10MB (Ethernet), capture size 262144 bytes

:|f^yb#

O5~_

@#PFh

k)]O

jtk3c

@NjN9_a

!\-@

NrF

?7&Y

^C6 packets captured

6 packets received by filter

0 packets dropped by kernel

Conclusion

In the next part of this blog series we are going to look into completing our fully encrypted setup with MariaDB at-rest encryption. Stay tuned!

Full MariaDB Encryption At-Rest and In-Transit for Maximum Data Protection - Part Two

$
0
0

In the first part of this series, we have covered in-transit encryption configuration for MariaDB replication servers, where we configured client-server and replication encryptions. Taken from the first post, where we had partially configured our full encryption (as indicated by the green arrows on the left in the diagram) and in this blog post, we are going to complete the encryption setup with at-rest encryption to create a fully encrypted MariaDB replication setup.

The following diagram illustrates our current setup and the final setup that we are going to achieve:

At-Rest Encryption

At-rest encryption means the data-at-rest like data files and logs are encrypted on the disk, makes it almost impossible for someone to access or steal a hard disk and get access to the original data (provided that the key is secured and not stored locally). Data-at-Rest Encryption, also known as Transparent Data Encryption (TDE), is supported in MariaDB 10.1 and later. Note that using encryption has an overhead of roughly 5-10%, depending on the workload and cluster type.

For MariaDB, the following MariaDB components can be encrypted at-rest:

  • InnoDB data file (shared tablespace or individual tablespace, e.g, *.ibd and ibdata1)
  • Aria data and index files.
  • Undo/redo logs (InnoDB log files, e.g, ib_logfile0 and ib_logfile1).
  • Binary/relay logs.
  • Temporary files and tables.

The following files can not be encrypted at the moment:

  • Metadata file (for example .frm files).
  • File-based general log/slow query log. Table-based general log/slow query log can be encrypted.
  • Error log.

MariaDB's data-at-rest encryption requires the use of a key management and encryption plugins. In this blog post, we are going to use File Key Management Encryption Plugin, which is provided by default since MariaDB 10.1.3. Note that there are a number of drawbacks using this plugin, e.g, the key can still be read by root and MySQL user, as explained in the MariaDB Data-at-Rest Encryption page.

Generating Key File

Let's create a dedicated directory to store our at-rest encryption stuff:

$ mkdir -p /etc/mysql/rest

$ cd /etc/mysql/rest

Create a keyfile. This is the core of encryption:

$ openssl rand -hex 32 > /etc/mysql/rest/keyfile

Append a string "1;" as the key identifier into the keyfile:

$ echo '1;' 

sed -i '1s/^/1;/' /etc/mysql/rest/keyfile

Thus, when reading the keyfile, it should look something like this:

$ cat /etc/mysql/rest/keyfile

1;4eb5770dcfa691bc634cbcd3c6bed9ed4ccd0111f3d3b1dae2c51a90fbf16ed7

The above simply means for key identifier 1, the key is 4eb... The key file needs to contain two pieces of information for each encryption key. First, each encryption key needs to be identified with a 32-bit integer as the key identifier. Second, the encryption key itself needs to be provided in hex-encoded form. These two pieces of information need to be separated by a semicolon.

Create a password to encrypt the above key. Here we are going to store the password inside a file called "keyfile.passwd":

$ echo -n 'mySuperStrongPassword'> /etc/mysql/rest/keyfile.passwd

You could skip the above step if you would like to specify the password directly in the configuration file using file_key_management_filekey option. For example: file_key_management_filekey=mySuperStrongPassword

But in this example, we are going to read the password that is stored in a file, thus we have to define the following line in the configuration file later on: 

file_key_management_filekey=FILE:/etc/mysql/encryption/keyfile.passwd

We are going to encrypt the clear text keyfile into another file called keyfile.enc, using password inside the password file:

$  openssl enc -aes-256-cbc -md sha1 -pass file:/etc/mysql/rest/keyfile.passwd -in /etc/mysql/rest/keyfile -out /etc/mysql/rest/keyfile.enc

When listing out the directory, we should see these 3 files:

$ ls -1 /etc/mysql/rest/

keyfile

keyfile.enc

keyfile.passwd

The content of the keyfile.enc is simply an encrypted version of keyfile:

To test out, we can decrypt the encrypted file using OpenSSL by providing the password file (keyfile.passwd):

$ openssl aes-256-cbc -d -md sha1 -pass file:/etc/mysql/rest/keyfile.passwd -in /etc/mysql/rest/keyfile.enc

1;4eb5770dcfa691bc634cbcd3c6bed9ed4ccd0111f3d3b1dae2c51a90fbf16ed7

We can then remove the plain key because we are going to use the encrypted one (.enc) together with the password file:

$ rm -f /etc/mysql/encryption/keyfile

We can now proceed to configure MariaDB at-rest encryption.

Configuring At-Rest Encryption

We have to move the encrypted key file and password to the slaves to be used by MariaDB to encrypt/decrypt the data. Otherwise, an encrypted table being backed up from the master using physical backup like MariaDB Backup would be having a problem to read by the slaves (due to different key/password combination). Logical backup like mysqldump should work with different keys and passwords.

On the slaves, create a directory to store at-rest encryption stuff:

(slave1)$ mkdir -p /etc/mysql/rest

(slave2)$ mkdir -p /etc/mysql/rest

On the master, copy the encrypted keyfile and password file to the other slaves:

(master)$ cd /etc/mysql/rest

(master)$ scp keyfile.enc keyfile.passwd root@slave1:/etc/mysql/rest/

(master)$ scp keyfile.enc keyfile.passwd root@slave2:/etc/mysql/rest/

Protect the files from global access and assign "mysql" user as the ownership:

$ chown mysql:mysql /etc/mysql/rest/*

$ chmod 600 /etc/mysql/rest/*

Add the following into MariaDB configuration file under [mysqld] or [mariadb] section:

# at-rest encryption

plugin_load_add              = file_key_management

file_key_management_filename = /etc/mysql/rest/keyfile.enc

file_key_management_filekey  = FILE:/etc/mysql/rest/keyfile.passwd

file_key_management_encryption_algorithm = AES_CBC


innodb_encrypt_tables            = ON

innodb_encrypt_temporary_tables  = ON

innodb_encrypt_log               = ON

innodb_encryption_threads        = 4

innodb_encryption_rotate_key_age = 1

encrypt-tmp-disk-tables          = 1

encrypt-tmp-files                = 1

encrypt-binlog                   = 1

aria_encrypt_tables              = ON

Take note on the file_key_management_filekey variable, if the password is in a file, you have to prefix the path with "FILE:". Alternatively, you could also specify the password string directly (not recommended due to its verbosity): 

file_key_management_filekey=mySuperStrongPassword

Restart MariaDB server one node at a time, starting with the slaves:

(slave1)$ systemctl restart mariadb

(slave2)$ systemctl restart mariadb

(master)$ systemctl restart mariadb

Observe the error log and make sure MariaDB encryption is activated during start up:

$ tail -f /var/log/mysql/mysqld.log

...

2019-12-17  6:44:47 0 [Note] InnoDB: Encrypting redo log: 2*67108864 bytes; LSN=143311

2019-12-17  6:44:48 0 [Note] InnoDB: Starting to delete and rewrite log files.

2019-12-17  6:44:48 0 [Note] InnoDB: Setting log file ./ib_logfile101 size to 67108864 bytes

2019-12-17  6:44:48 0 [Note] InnoDB: Setting log file ./ib_logfile1 size to 67108864 bytes

2019-12-17  6:44:48 0 [Note] InnoDB: Renaming log file ./ib_logfile101 to ./ib_logfile0

2019-12-17  6:44:48 0 [Note] InnoDB: New log files created, LSN=143311

2019-12-17  6:44:48 0 [Note] InnoDB: 128 out of 128 rollback segments are active.

2019-12-17  6:44:48 0 [Note] InnoDB: Creating shared tablespace for temporary tables

2019-12-17  6:44:48 0 [Note] InnoDB: Setting file './ibtmp1' size to 12 MB. Physically writing the file full; Please wait ...

2019-12-17  6:44:48 0 [Note] InnoDB: File './ibtmp1' size is now 12 MB.

2019-12-17  6:44:48 0 [Note] InnoDB: Waiting for purge to start

2019-12-17  6:44:48 0 [Note] InnoDB: 10.4.11 started; log sequence number 143311; transaction id 222

2019-12-17  6:44:48 0 [Note] InnoDB: Creating #1 encryption thread id 139790011840256 total threads 4.

2019-12-17  6:44:48 0 [Note] InnoDB: Creating #2 encryption thread id 139790003447552 total threads 4.

2019-12-17  6:44:48 0 [Note] InnoDB: Creating #3 encryption thread id 139789995054848 total threads 4.

2019-12-17  6:44:48 0 [Note] InnoDB: Creating #4 encryption thread id 139789709866752 total threads 4.

2019-12-17  6:44:48 0 [Note] InnoDB: Loading buffer pool(s) from /var/lib/mysql/ib_buffer_pool

2019-12-17  6:44:48 0 [Note] Plugin 'FEEDBACK' is disabled.

2019-12-17  6:44:48 0 [Note] Using encryption key id 1 for temporary files

...

You should see lines indicating encryption initialization in the error log. At this point, the majority of the encryption configuration is now complete.

Testing Your Encryption

Create a test database to test on the master:

(master)MariaDB> CREATE SCHEMA sbtest;

(master)MariaDB> USE sbtest;

Create a standard table without encryption and insert a row:

MariaDB> CREATE TABLE tbl_plain (id INT AUTO_INCREMENT PRIMARY KEY, data VARCHAR(255));

MariaDB> INSERT INTO tbl_plain SET data = 'test data';

We can see the stored data in clear text when browsing the InnoDB data file using a hexdump tool:

$ xxd /var/lib/mysql/sbtest/tbl_plain.ibd | less

000c060: 0200 1c69 6e66 696d 756d 0002 000b 0000  ...infimum......

000c070: 7375 7072 656d 756d 0900 0000 10ff f180  supremum........

000c080: 0000 0100 0000 0000 0080 0000 0000 0000  ................

000c090: 7465 7374 2064 6174 6100 0000 0000 0000  test data.......

000c0a0: 0000 0000 0000 0000 0000 0000 0000 0000  ................

Create an encrypted table and insert a row:

MariaDB> CREATE TABLE tbl_enc (id INT AUTO_INCREMENT PRIMARY KEY, data VARCHAR(255)) ENCRYPTED=YES;

MariaDB> INSERT INTO tbl_enc SET data = 'test data';

We can't tell what is stored in InnoDB data file for encrypted tables:

$ xxd /var/lib/mysql/sbtest/tbl_enc.ibd | less

000c060: 0c2c 93e4 652e 9736 e68a 8b69 39cb 6157  .,..e..6...i9.aW

000c070: 3cd1 581c 7eb9 84ca d792 7338 521f 0639  <.X.~.....s8R..9

000c080: d279 9eb3 d3f5 f9b0 eccb ed05 de16 f3ac  .y..............

000c090: 6d58 5519 f776 8577 03a4 fa88 c507 1b31  mXU..v.w.......1

000c0a0: a06f 086f 28d9 ac17 8923 9412 d8a5 1215  .o.o(....#......

Note that the metadata file tbl_enc.frm is not encrypted at-rest. Only the InnoDB data file (.ibd) is encrypted.

When comparing the "plain" binary or relay logs, we can clearly see the content of it using hexdump tool:

$ xxd binlog.000002 | less

0000560: 0800 0800 0800 0b04 726f 6f74 096c 6f63  ........root.loc

0000570: 616c 686f 7374 0047 5241 4e54 2052 454c  alhost.GRANT REL

0000580: 4f41 442c 4c4f 434b 2054 4142 4c45 532c  OAD,LOCK TABLES,

0000590: 5245 504c 4943 4154 494f 4e20 434c 4945  REPLICATION CLIE

00005a0: 4e54 2c45 5645 4e54 2c43 5245 4154 4520  NT,EVENT,CREATE

00005b0: 5441 424c 4553 5041 4345 2c50 524f 4345  TABLESPACE,PROCE

00005c0: 5353 2c43 5245 4154 452c 494e 5345 5254  SS,CREATE,INSERT

00005d0: 2c53 454c 4543 542c 5355 5045 522c 5348  ,SELECT,SUPER,SH

00005e0: 4f57 2056 4945 5720 4f4e 202a 2e2a 2054  OW VIEW ON *.* T

While for an encrypted binary log, the content looks gibberish:

$ xxd binlog.000004 | less

0000280: 4a1d 1ced 2f1b db50 016a e1e9 1351 84ba  J.../..P.j...Q..

0000290: 38b6 72e7 8743 7713 afc3 eecb c36c 1b19  8.r..Cw......l..

00002a0: 7b3f 6176 208f 0000 00dc 85bf 6768 e7c6  {?av .......gh..

00002b0: 6107 5bea 241c db12 d50c 3573 48e5 3c3d  a.[.$.....5sH.<=

00002c0: 3179 1653 2449 d408 1113 3e25 d165 c95b  1y.S$I....>%.e.[

00002d0: afb0 6778 4b26 f672 1bc7 567e da96 13f5  ..gxK&.r..V~....

00002e0: 2ac5 b026 3fb9 4b7a 3ef4 ab47 6c9f a686  *..&?.Kz>..Gl...

Encrypting Aria Tables

For Aria storage engine, it does not support the ENCRYPTED option in CREATE/ALTER statement since it follows the aria_encrypt_tables global option. Therefore, when creating an Aria table, simply create the table with ENGINE=Aria option:

MariaDB> CREATE TABLE tbl_aria_enc (id INT AUTO_INCREMENT PRIMARY KEY, data VARCHAR(255)) ENGINE=Aria;

MariaDB> INSERT INTO tbl_aria_enc(data) VALUES ('test data');

MariaDB> FLUSH TABLE tbl_aria_enc;

We can then verify the content of the table's data file (tbl_aria_enc.MAD) or index file (tbl_aria_enc.MAI) with hexdump tool. To encrypt an existing Aria table, the table needs to be re-built:

MariaDB> ALTER TABLE db.aria_table ENGINE=Aria ROW_FORMAT=PAGE;

This statement causes Aria to rebuild the table using the ROW_FORMAT table option. In the process, with the new default setting, it encrypts the table when it writes to disk.

Encrypting General Log/Slow Query Log

To encrypt general and slow query logs, we can set MariaDB log_output option to 'TABLE' instead of the default 'FILE':

MariaDB> SET GLOBAL log_ouput = 'TABLE';

However, MariaDB will by default create the necessary tables using CSV storage engine, which is not encrypted by MariaDB. No engines other than CSV, MyISAM or Aria are legal for the log tables. The trick is to rebuild the default CSV table with Aria storage engine, provided that aria_encrypt_tables option is set to ON. However, the respective log option must be turned off for the table alteration to succeed.

Thus, the steps to encrypt general log table is:

MariaDB> SET GLOBAL general_log = OFF;

MariaDB> ALTER TABLE mysql.general_log ENGINE=Aria;

MariaDB> SET GLOBAL general_log = ON;

Similarly, for slow query log:

MariaDB> SET GLOBAL slow_query_log = OFF;

MariaDB> ALTER TABLE mysql.slow_log ENGINE=Aria;

MariaDB> SET GLOBAL slow_query_log = ON;

Verify the output of general logs within the server:

MariaDB> SELECT * FROM mysql.general_log;

+----------------------------+---------------------------+-----------+-----------+--------------+------------------------------+

| event_time                 | user_host | thread_id | server_id | command_type | argument                     |

+----------------------------+---------------------------+-----------+-----------+--------------+------------------------------+

| 2019-12-17 07:45:53.109558 | root[root] @ localhost [] |        19 | 28001 | Query | select * from sbtest.tbl_enc |

| 2019-12-17 07:45:55.504710 | root[root] @ localhost [] |        20 | 28001 | Query | select * from general_log |

+----------------------------+---------------------------+-----------+-----------+--------------+------------------------------+

As well as the encrypted content of the Aria data file inside data directory using hexdump tool:

$ xxd /var/lib/mysql/mysql/general_log.MAD | less

0002040: 1d45 820d 7c53 216c 3fc6 98a6 356e 1b9e  .E..|S!l?...5n..

0002050: 6bfc e193 7509 1fa7 31e2 e22a 8f06 3c6f  k...u...1..*..<o

0002060: ae71 bb63 e81b 0b08 7120 0c99 9f82 7c33  .q.c....q ....|3

0002070: 1117 bc02 30c1 d9a7 c732 c75f 32a6 e238  ....0....2._2..8

0002080: d1c8 5d6f 9a08 455a 8363 b4f4 5176 f8a1  ..]o..EZ.c..Qv..

0002090: 1bf8 113c 9762 3504 737e 917b f260 f88c  ...<.b5.s~.{.`..

00020a0: 368e 336f 9055 f645 b636 c5c1 debe fbe7  6.3o.U.E.6......

00020b0: d01e 028f 8b75 b368 0ef0 8889 bb63 e032  .....u.h.....c.2

MariaDB at-rest encryption is now complete. Combine this with in-transit encryption we have done in the first post, our final architecture is now looking like this:

Conclusion

It's now possible to totally secure your MariaDB databases via encryption for protection against physical and virtual breach or theft. ClusterControl can help you maintain this type of security as well and you can download it for free here.


Tips for Delivering MySQL Database Performance - Part One

$
0
0

The database backend affects the application, which can then impact organizational performance. When this happens, those in charge tend to want a quick fix. There are many different roads to improve performance in MySQL. As a very popular choice for many organizations, it's pretty common to find a MySQL installation with the default configuration. This might not, however, be appropriate for your workload and setup needs.

In this blog, we will help you to better understand your database workload and the things that may cause harm to it. Knowledge of how to use limited resources is essential for anyone managing the database, especially if you run your production system on MySQL DB.

To ensure that the database performs as expected, we will start with the free MySQL monitoring tools. We will then look at the related MySQL parameters you can tweak to improve the database instance. We will also take a look at indexing as a factor in database performance management. 

To be able to achieve optimal usage of hardware resources, we’ll take a look into kernel optimization and other crucial OS settings. Finally, we will look into trendy setups based on MySQL Replication and how it can be examined in terms of performance lag. 

Identifying MySQL Performance Issues

This analysis helps you to understand the health and performance of your database better. The tools listed below can help to capture and understand every transaction, letting you stay on top of its performance and resource consumption.

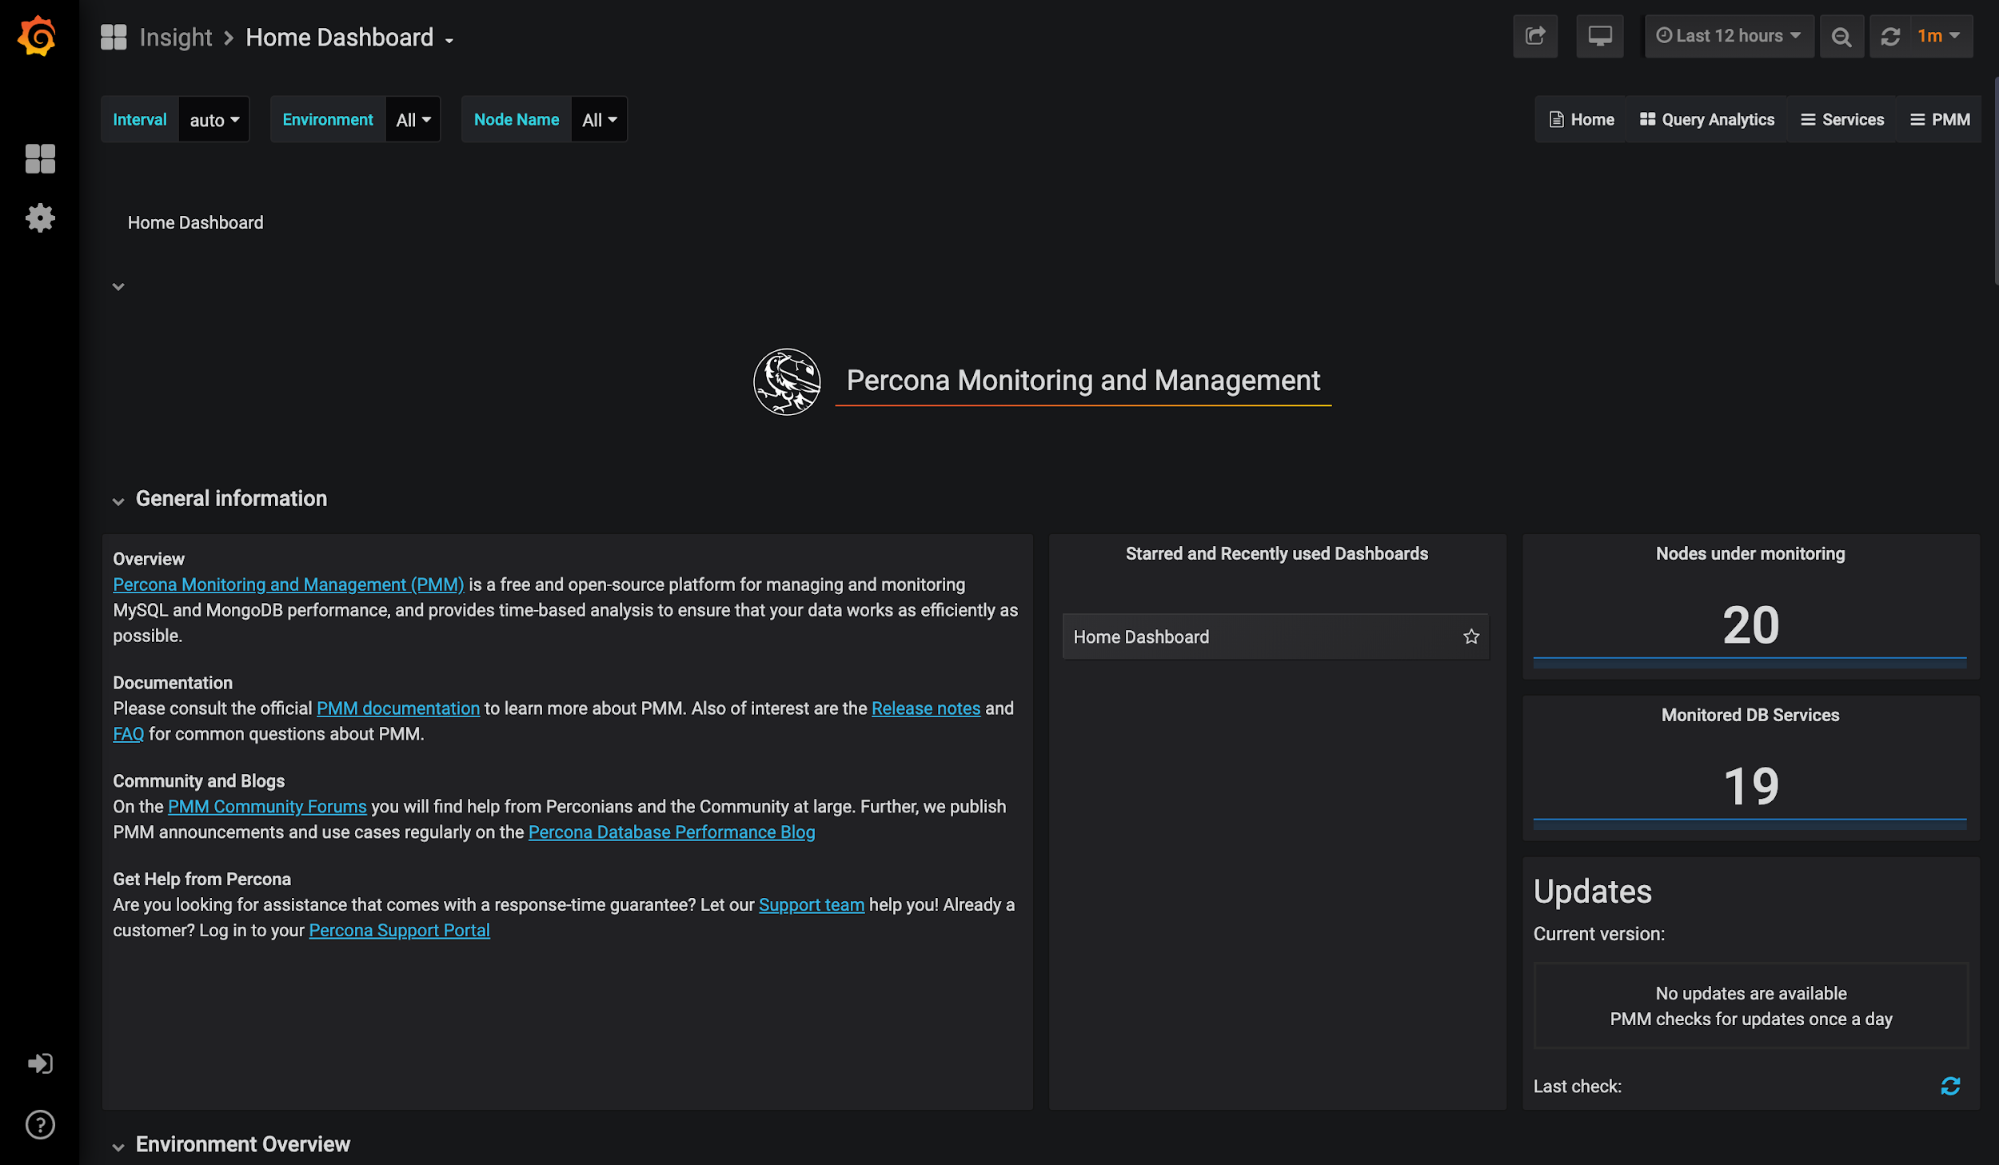
PMM (Percona Monitoring and Management)

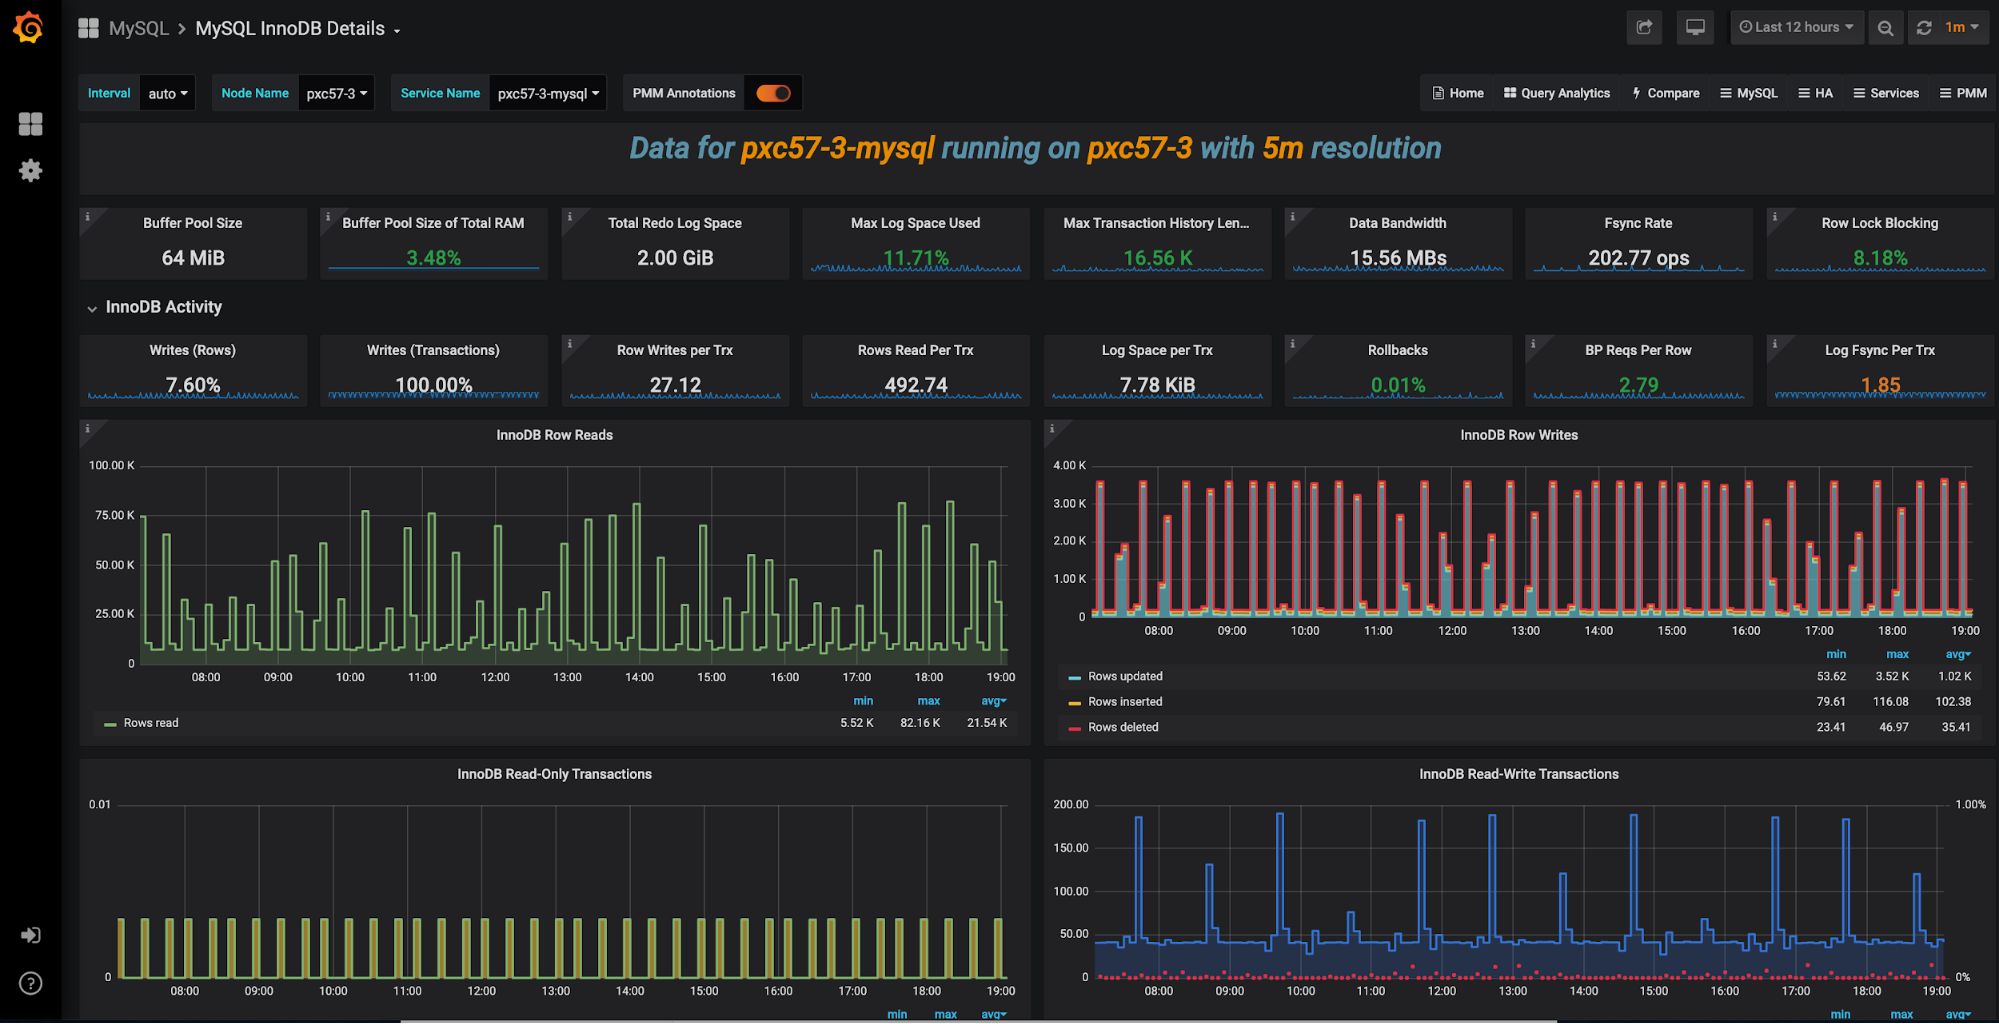
Percona Monitoring and Management tool is an open-source collection of tools dedicated to MySQL, MongoDB, and MariaDB databases (on-premise or in the cloud). PPM is free to use, and it's based on the well known Grafana and Prometheus time series DB. It Provides a thorough time-based analysis for MySQL.  It offers preconfigured dashboards that help to understand your database workload.

PMM uses a client/server model. You'll have to download and install both the client and the server. For the server, you can use Docker Container. It's as easy as pulling the PMM server docker image, creating a container, and launching PMM.

Pull PMM Server Image

docker pull percona/pmm-server:2

2: Pulling from percona/pmm-server

ab5ef0e58194: Downloading  2.141MB/75.78MB

cbbdeab9a179: Downloading  2.668MB/400.5MB

Create PMM Container

docker create \

   -v /srv \

   --name pmm-data \

   percona/pmm-server:2 /bin/true

Run Container

docker run -d \

   -p 80:80 \

   -p 443:443 \

   --volumes-from pmm-data \

   --name pmm-server \

   --restart always \

   percona/pmm-server:2

You can also check how it looks without an installation. A demo of PMM is available here.

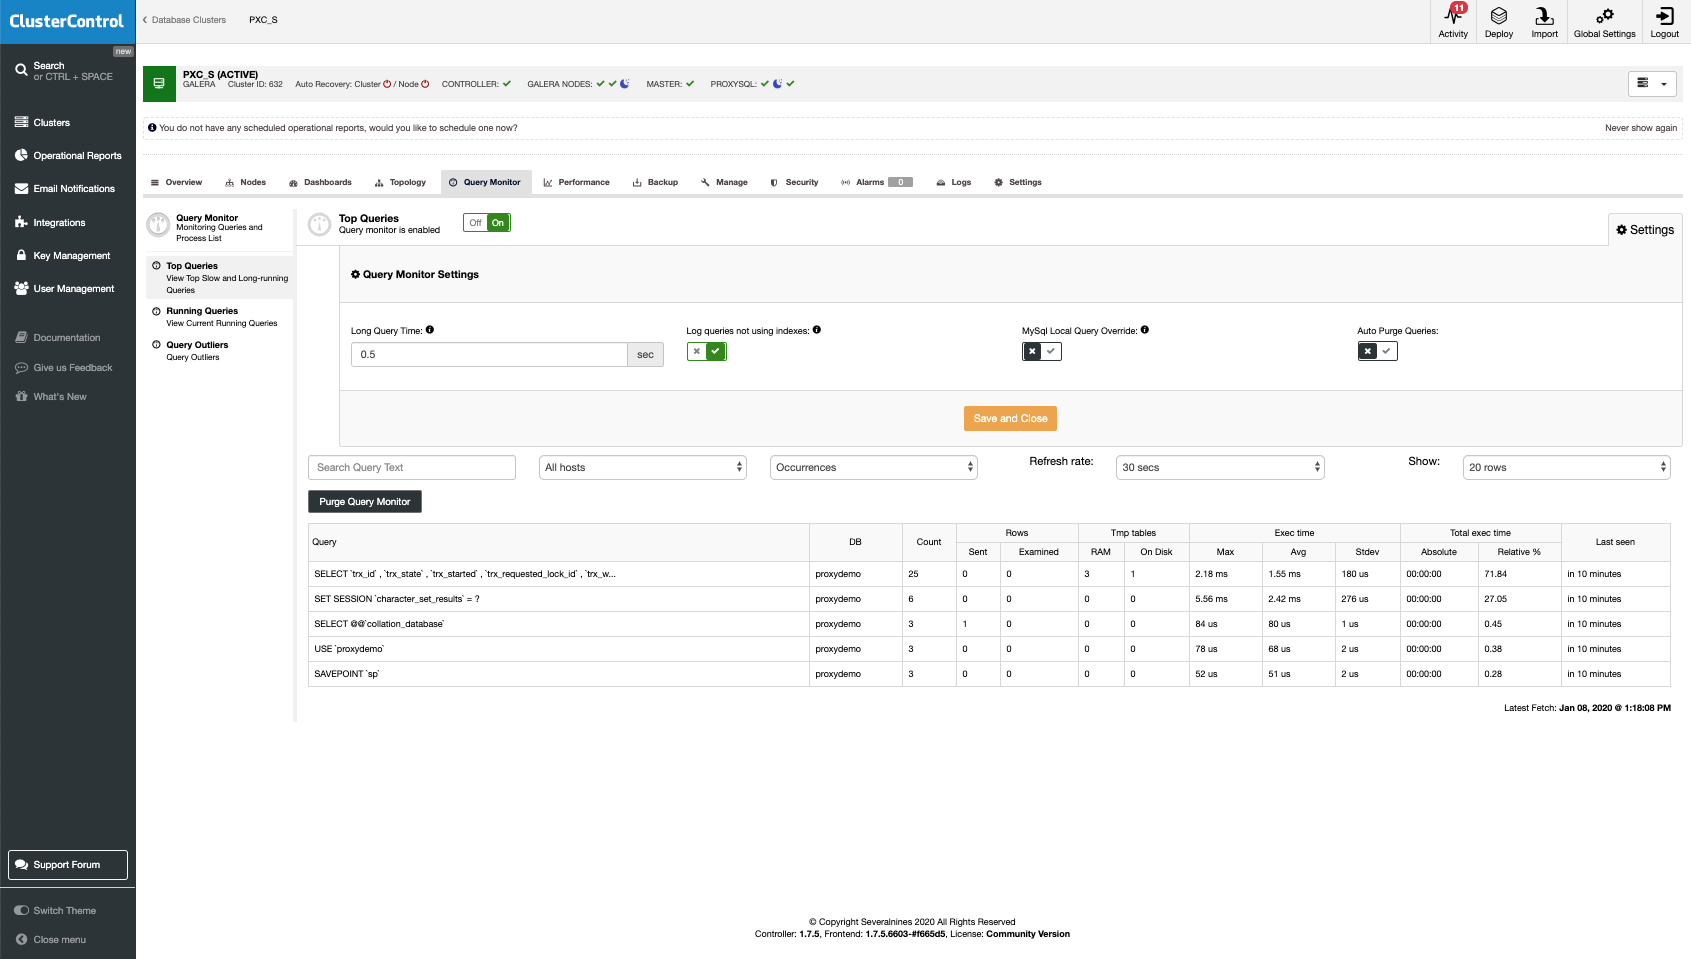
Another tool that is part of PMM tools set is Query Analytics (QAN). QAN tool stays on top of the execution time of queries. You can even get details of SQL queries. It also gives a historical view of the different parameters that are critical for the optimal performance of a MySQL Database Server. This often helps to understand if any changes in the code could harm your performance. For example, a new code was introduced without your knowledge.  A simple use would be to display current SQL queries and highlight issues to help you improve the performance of your database.

PMM offers point-in-time and historical visibility of MySQL database performance. Dashboards can be customized to meet your specific requirements. You can even expand a particular panel to find the information you want about a past event.

Free Database Monitoring with ClusterControl

ClusterControl provides real-time monitoring of the entire database infrastructure. It supports various database systems starting with MySQL, MariaDB, PerconaDB, MySQL NDB Cluster, Galera Cluster (both Percona and MariaDB), MongoDB, PostgreSQL and TimescaleDB. The monitoring and deployment modules are free to use.

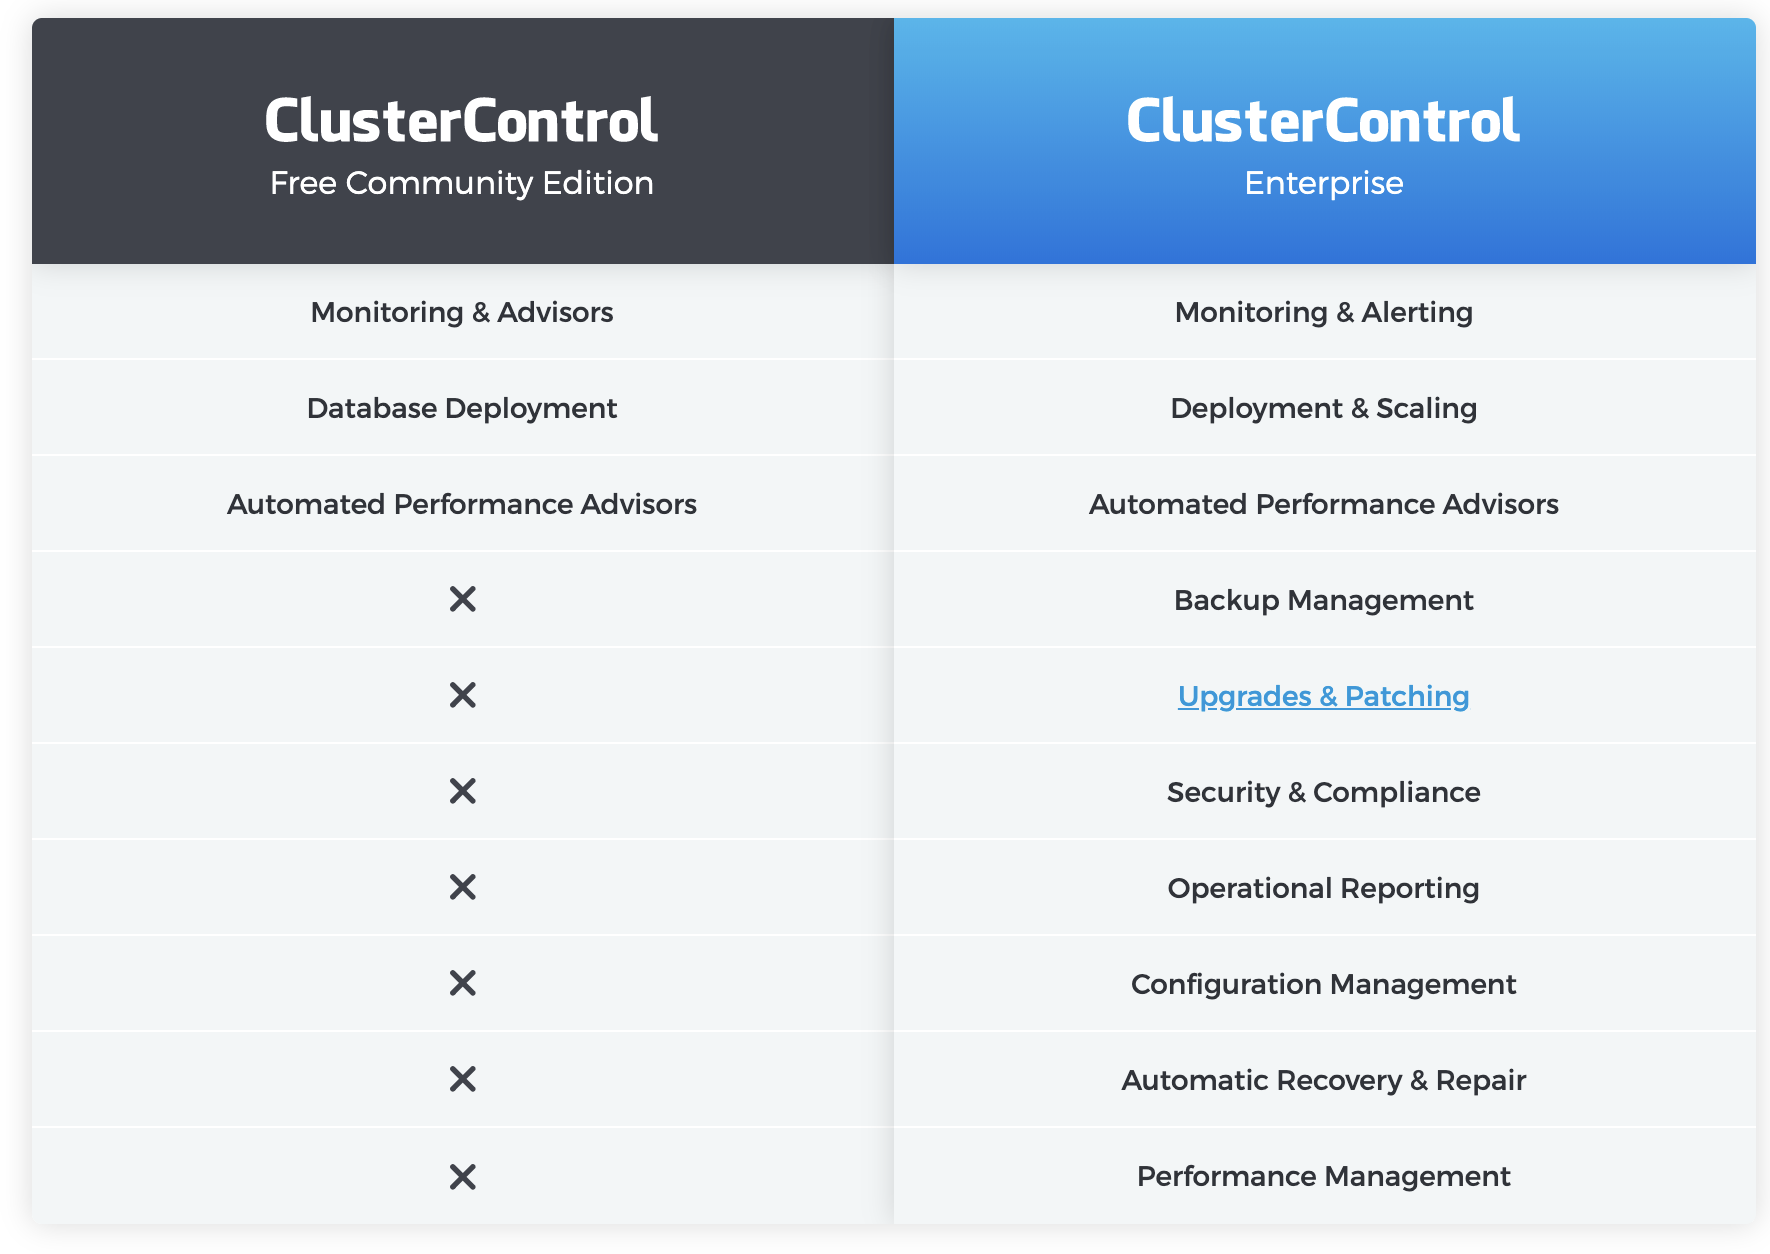
ClusterControl consists of several modules. In the free ClusterControl Community Edition we can use:

Performance advisors offer specific advice on how to address database and server issues, such as performance, security, log management, configuration, and capacity planning. Operational reports can be used to ensure compliance across hundreds of instances. However, monitoring is not management. ClusterControl has features like backup management, automated recovery/failover, deployment/scaling, rolling upgrades, security/encryption, load balancer management, and so on.

Monitoring & Advisors

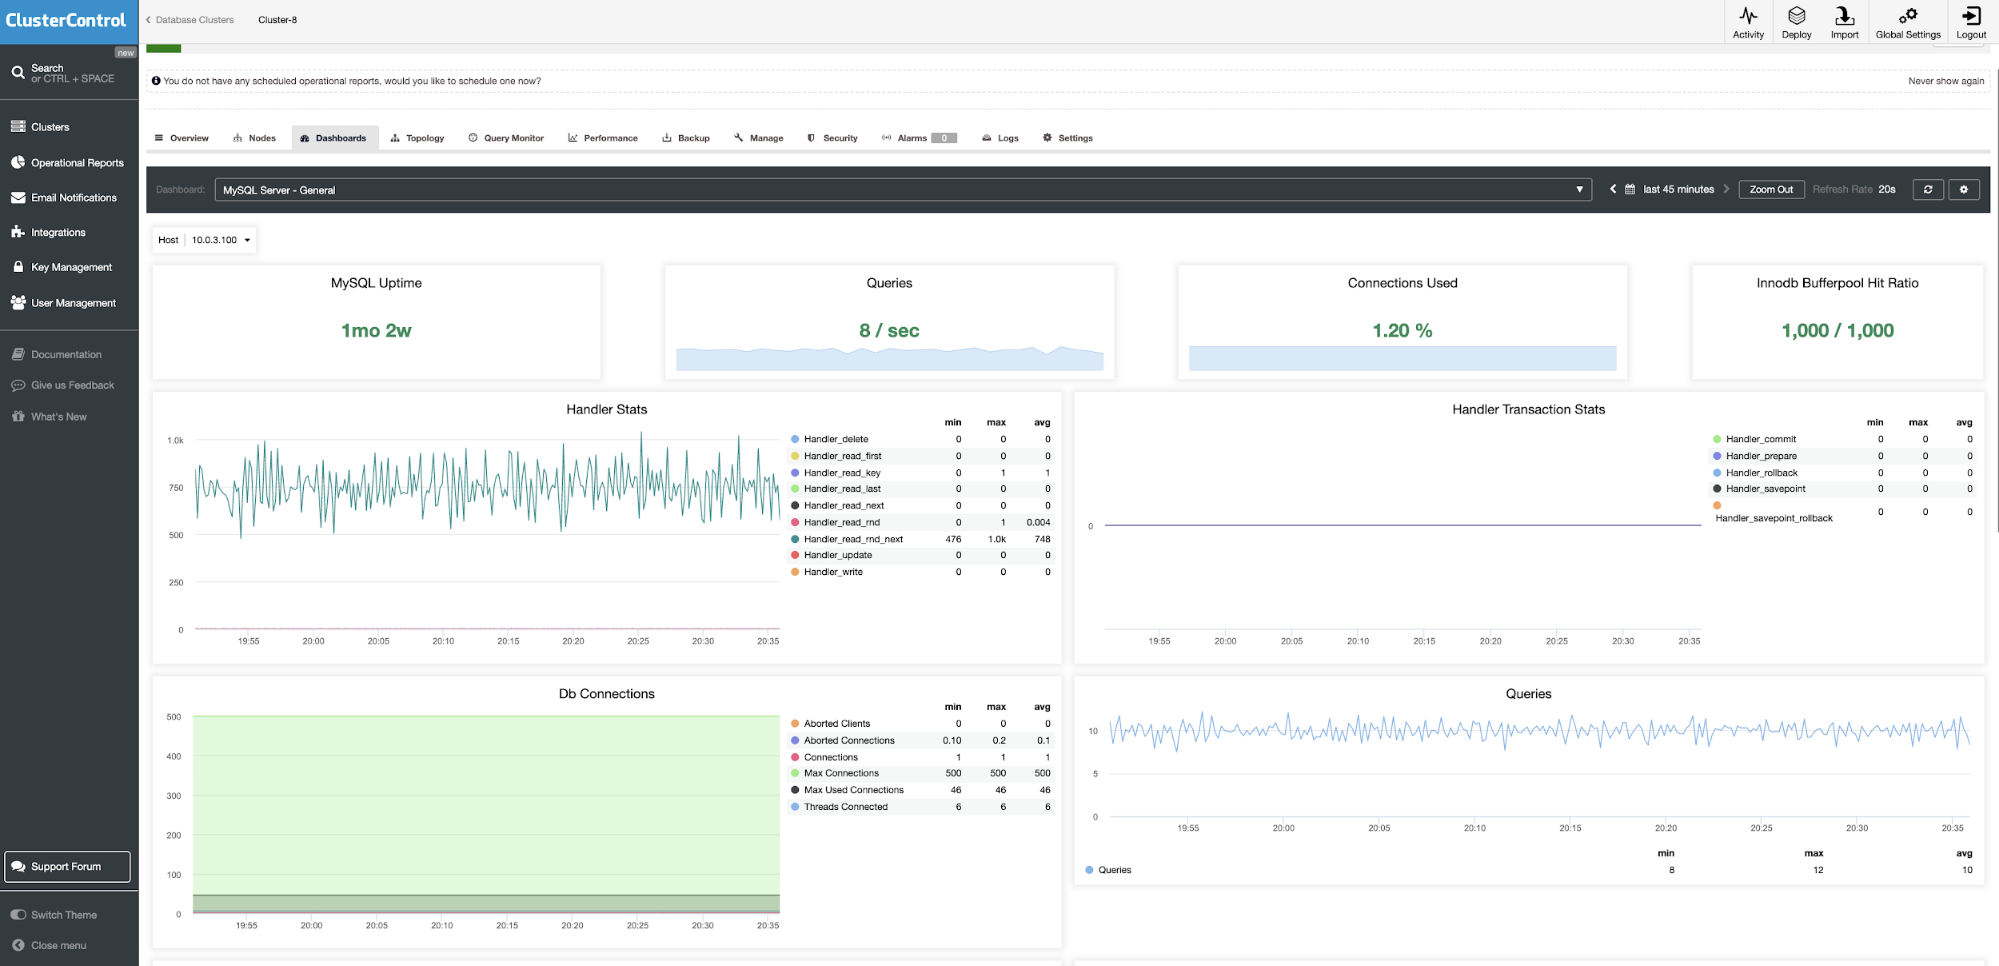
The ClusterControl Community Edition offers free database monitoring which provides a unified view of all of your deployments across data centers and lets you drill down into individual nodes. Similar to PMM we can find dashboards based on real-time data. It’s to know what is happening now, with high-resolution metrics for better accuracy, pre-configured dashboards, and a wide range of third-party notification services for alerting.

On-premises and cloud systems can be monitored and managed from one single point. Intelligent health-checks are implemented for distributed topologies, for instance, detection of network partitioning by leveraging the load balancer’s view of the database nodes.

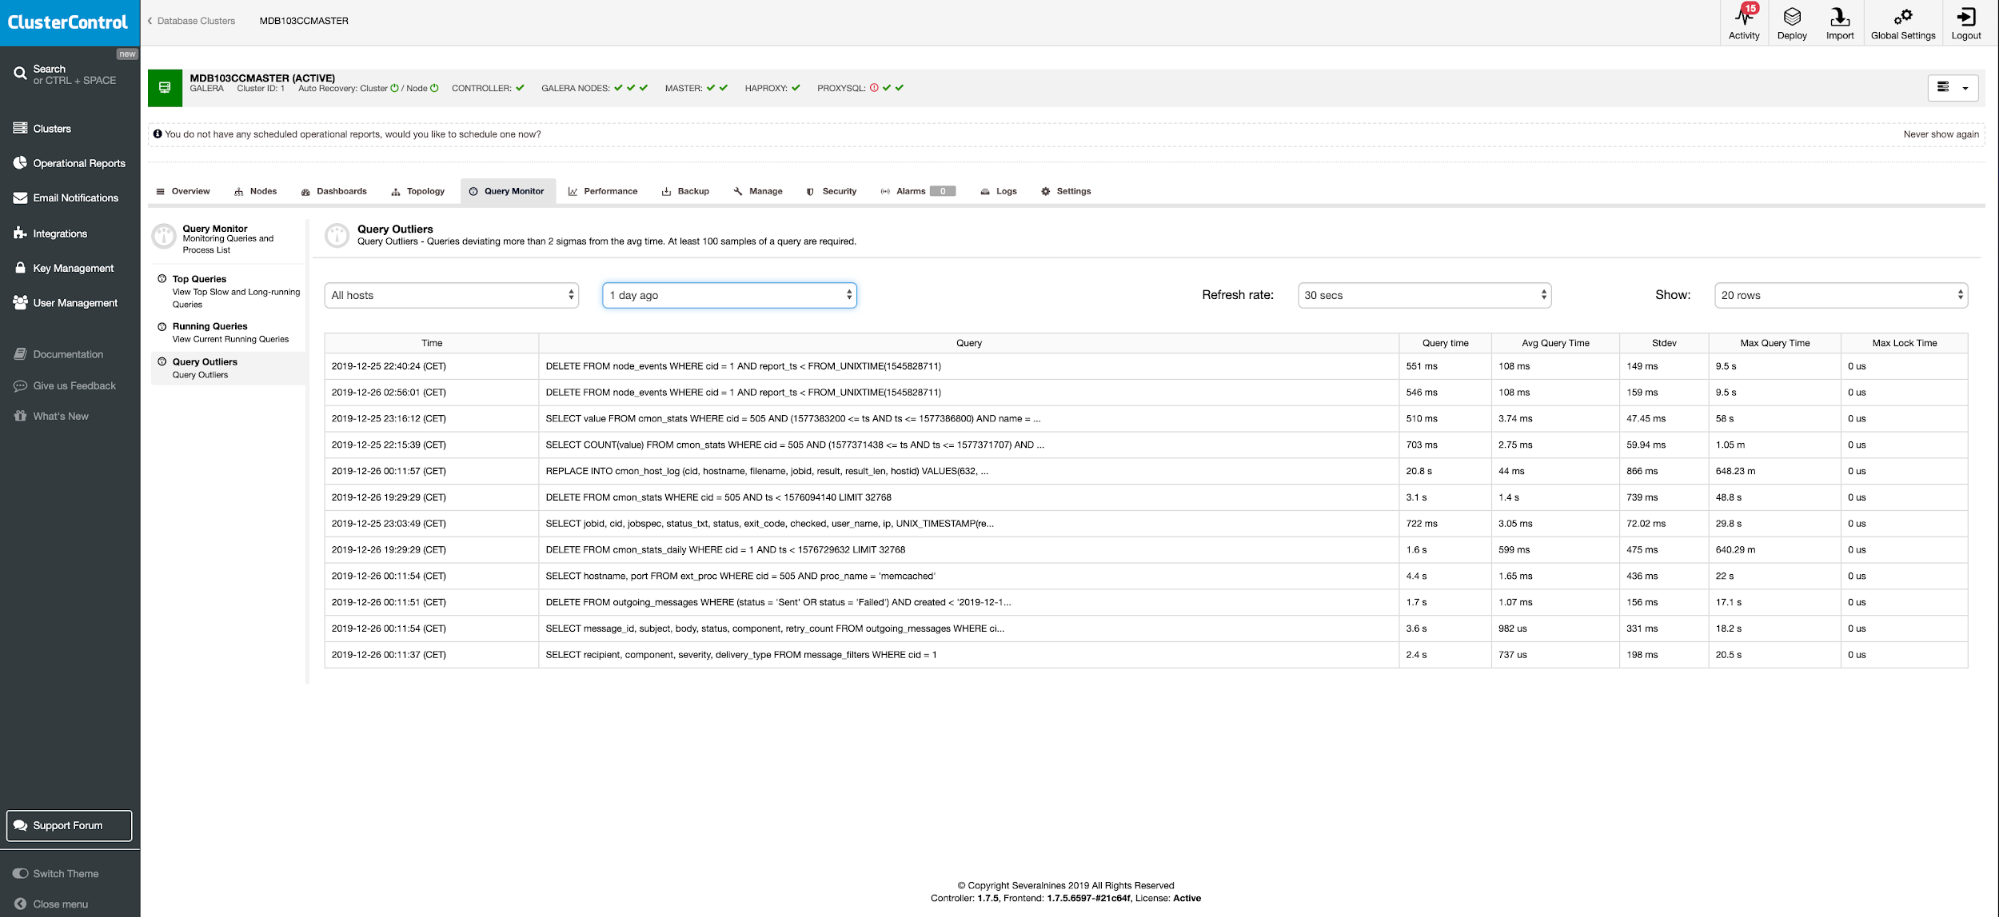
ClusterControl Workload Analytics in one of the monitoring components which can easily help you to track your database activities. It provides clarity into transactions/queries from applications. Performance exceptions are never expected, but they do occur and are easy to miss in a sea of data. Outlier discovery will get any queries that suddenly start to execute much slower than usual. It tracks the moving average and standard deviation for query execution times and detects/alerts when the difference between the value exceeds the mean by two standard deviations. 

As we can see from the below picture, we were able to catch some queries that in between one day tend to change execution time on a specific time. 

To install ClusterControl click here and download the installation script. The install script will take care of the necessary installation steps. 

You should also check out the ClusterControl Demo to see it in action.

You can also get a docker image with ClusterControl.

$ docker pull severalnines/clustercontrol

For more information on this, follow this article.

MySQL Database Indexing

Without an index, running that same query results in a scan of every row for the needed data. Creating an index on a field in a table creates extra data structure, which is the field value, and a pointer to the record it relates to. In other words, indexing produces a shortcut, with much faster query times on expansive tables. Without an index, MySQL must begin with the first row and then read through the entire table to find the relevant rows. 

Generally speaking, indexing works best on those columns that are the subject of the WHERE clauses in your commonly executed queries.

Tables can have multiple indexes. Managing indexes will inevitably require being able to list the existing indexes on a table. The syntax for viewing an index is below.

To check indexes on MySQL table run:

SHOW INDEX FROM table_name;

Since indices are only used to speed up the searching for a matching field within the records, it stands to reason that indexing fields used only for output would be simply a waste of disk space. Another side effect is that indexes may extend insert or delete operations, and thus when not needed, should be avoided.

MySQL Database Swappiness

On servers where MySQL is the only service running, it’s a good practice to set vm.swapiness = 1. The default setting is set to 60 which is not appropriate for a database system.

vi /etc/sysctl.conf
vm.swappiness = 1

Transparent Huge Pages

If you are running your MySQL on RedHat, make sure that Transparent Huge Pages is disabled.

This can be checked by command:

cat /proc/sys/vm/nr_hugepages
0

(0 means that transparent huge pages are disabled.)

MySQL I/O Scheduler 

In most distributions noop or deadline I/O schedulers should be enabled by default. To check it run

cat /sys/block/sdb/queue/scheduler 

MySQL Filesystem Options

It’s recommended to use journaled file systems like xfs, ext4 or btrfs. MySQL works fine with all that of them and the differences more likely will come with supported maximum file size.

  • XFS (maximum filesystem size 8EB, maximum file size 8EB)
  • XT4 (maximum filesystem size 8EB, maximum file size 16TB)
  • BTRFS (maximum filesystem size 16EB, maximum file size 16EB)

The default file system settings should apply fine.

NTP Deamon

It’s a good best practice to install NTP time server demon on database servers. Use one of the following system commands.

#Red Hat
yum install ntp
#Debian
sudo apt-get install ntp

Conclusion

This is all for part one. In the next article, we will continue with MySQL variables operating systems settings and useful queries to gather database performance status. 

Using OpenVPN to Secure Access to Your Database Cluster in the Cloud

$
0
0

The internet is a dangerous place, especially if you’re leaving your data unencrypted or without proper security. There are several ways to secure your data; all at different levels. You should always have a strong firewall policy,  data encryption, and a strong password policy. Another way to secure your data is by accessing it using a VPN connection. 

Virtual Private Network (or VPN) is a connection method used to add security and privacy to private and public networks, protecting your data.

OpenVPN is a fully-featured, open source, SSL VPN solution to secure communications. It can be used for remote access or communication between different servers or data centers. It can be installed on-prem or in the cloud, in different operating systems, and can be configured with many security options.

In this blog, we’ll create a VPN connection to access a database in the cloud. There are different ways to achieve this goal, depending on your infrastructure and how much hardware resources you want to use for this task. 

For example, you can create two VM, one on-prem and another one in the cloud, and they could be a bridge to connect your local network to the database cloud network through a Peer-to-Peer VPN connection.

Another simpler option could be connecting to a VPN server installed in the database node using a VPN client connection configured in your local machine. In this case, we’ll use this second option. You’ll see how to configure an OpenVPN server in the database node running in the cloud, and you’ll be able to access it using a VPN client.

For the database node, we’ll use an Amazon EC2 instance with the following configuration:

  • OS: Ubuntu Server 18.04
  • Public IP Address: 18.224.138.210
  • Private IP Address: 172.31.30.248/20
  • Opened TCP ports: 22, 3306, 1194

How to Install OpenVPN on Ubuntu Server 18.04

The first task is to install the OpenVPN server in your database node. Actually, the database technology used doesn’t matter as we’re working on a networking layer, but for testing purposes after configuring the VPN connection, let’s say we’re running Percona Server 8.0.

So let’s start by installing the OpenVPN packages.

$ apt install openvpn easy-rsa

As OpenVPN uses certificates to encrypt your traffic, you’ll need EasyRSA for this task. It’s a CLI utility to create a root certificate authority, and request and sign certificates, including sub-CAs and certificate revocation lists.

Note: There is a new EasyRSA version available, but to keep the focus on the OpenVPN installation, let’s use the EasyRSA version available in the Ubuntu 18.04 repository atm (EasyRSA version 2.2.2-2).

The previous command will create the directory /etc/openvpn/ for the OpenVPN configuration, and the directory /usr/share/easy-rsa/ with the EasyRSA scripts and configuration.

To make this task easier, let’s create a symbolic link to the EasyRSA path in the OpenVPN directory (or you can just copy it):

$ ln -s /usr/share/easy-rsa /etc/openvpn/

Now, you need to configure EasyRSA and create your certificates. Go to the EasyRSA location and create a backup for the “vars” file:

$ cd /etc/openvpn/easy-rsa

$ cp vars vars.bak

Edit this file, and change the following lines according to your information:

$ vi vars

export KEY_COUNTRY="US"

export KEY_PROVINCE="CA"

export KEY_CITY="SanFrancisco"

export KEY_ORG="Fort-Funston"

export KEY_EMAIL="me@myhost.mydomain"

export KEY_OU="MyOrganizationalUnit"

Then, create a new symbolic link to the openssl file:

$ cd /etc/openvpn/easy-rsa

$ ln -s openssl-1.0.0.cnf openssl.cnf

Now, apply the vars file:

$ cd /etc/openvpn/easy-rsa

$ . vars

NOTE: If you run ./clean-all, I will be doing a rm -rf on /etc/openvpn/easy-rsa/keys

Run the clean-all script:

$ ./clean-all

And create the Diffie-Hellman key (DH):

$ ./build-dh

Generating DH parameters, 2048 bit long safe prime, generator 2

This is going to take a long time

.....................................................................................................................................................................+

This last action could take some seconds, and when it’s finished, you will have a new DH file inside the “keys” directory in the EasyRSA directory.

$ ls /etc/openvpn/easy-rsa/keys

dh2048.pem

Now, let’s create the CA certificates.

$ ./build-ca

Generating a RSA private key

..+++++

...+++++

writing new private key to 'ca.key'

-----

You are about to be asked to enter information that will be incorporated

into your certificate request.

What you are about to enter is what is called a Distinguished Name or a DN.

There are quite a few fields but you can leave some blank

For some fields there will be a default value,

If you enter '.', the field will be left blank.

...

This will create the ca.crt (public certificate) and ca.key (private key). The public certificate will be required in all servers to connect to the VPN.

$ ls /etc/openvpn/easy-rsa/keys

ca.crt  ca.key

Now you have your CA created, let’s create the server certificate. In this case, we’ll call it “openvpn-server”:

$ ./build-key-server openvpn-server

Generating a RSA private key

.......................+++++

........................+++++

writing new private key to 'openvpn-server.key'

-----

You are about to be asked to enter information that will be incorporated

into your certificate request.

What you are about to enter is what is called a Distinguished Name or a DN.

There are quite a few fields but you can leave some blank

For some fields there will be a default value,

If you enter '.', the field will be left blank.

...

Certificate is to be certified until Dec 23 22:44:02 2029 GMT (3650 days)

Sign the certificate? [y/n]:y


1 out of 1 certificate requests certified, commit? [y/n]y


Write out database with 1 new entries

Data Base Updated

This will create the CRT, CSR, and Key files for the OpenVPN server:

$ ls /etc/openvpn/easy-rsa/keys

openvpn-server.crt  openvpn-server.csr openvpn-server.key

Now, you need to create the client certificate, and the process is pretty similar:

$ ./build-key openvpn-client-1

Generating a RSA private key

.........................................................................................+++++

.....................+++++

writing new private key to 'openvpn-client-1.key'

-----

You are about to be asked to enter information that will be incorporated

into your certificate request.

What you are about to enter is what is called a Distinguished Name or a DN.

There are quite a few fields but you can leave some blank

For some fields there will be a default value,

If you enter '.', the field will be left blank.

...

Certificate is to be certified until Dec 24 01:45:39 2029 GMT (3650 days)

Sign the certificate? [y/n]:y


1 out of 1 certificate requests certified, commit? [y/n]y


Write out database with 1 new entries

Data Base Updated

This will create the CRT, CSR, and Key files for the OpenVPN client:

$ ls /etc/openvpn/easy-rsa/keys

openvpn-client-1.csr  openvpn-client-1.crt openvpn-client-1.key

At this point, you have all the certificates ready. The next step will be to create both server and client OpenVPN configuration.

Configuring the OpenVPN Server

As we mentioned, the OpenVPN installation will create the /etc/openvpn directory, where you will add the configuration files for both server and client roles, and it has a sample configuration file for each one in /usr/share/doc/openvpn/examples/sample-config-files/, so you can copy the files in the mentioned location and modify them as you wish.

In this case, we’ll only use the server configuration file, as it’s an OpenVPN server:

$ cp /usr/share/doc/openvpn/examples/sample-config-files/server.conf.gz /etc/openvpn/

$ gunzip /etc/openvpn/server.conf.gz

Now, let’s see a basic server configuration file:

$ cat /etc/openvpn/server.conf

port 1194  

# Which TCP/UDP port should OpenVPN listen on?

proto tcp  

# TCP or UDP server?

dev tun  

# "dev tun" will create a routed IP tunnel,"dev tap" will create an ethernet tunnel.

ca /etc/openvpn/easy-rsa/keys/ca.crt  

# SSL/TLS root certificate (ca).

cert /etc/openvpn/easy-rsa/keys/openvpn-server.crt  

# Certificate (cert).

key /etc/openvpn/easy-rsa/keys/openvpn-server.key  

# Private key (key). This file should be kept secret.

dh /etc/openvpn/easy-rsa/keys/dh2048.pem  

# Diffie hellman parameters.

server 10.8.0.0 255.255.255.0  

# Configure server mode and supply a VPN subnet.

push "route 172.31.16.0 255.255.240.0"

# Push routes to the client to allow it to reach other private subnets behind the server.

keepalive 20 120  

# The keepalive directive causes ping-like messages to be sent back and forth over the link so that each side knows when the other side has gone down.

cipher AES-256-CBC  

# Select a cryptographic cipher.

persist-key  

persist-tun

# The persist options will try to avoid accessing certain resources on restart that may no longer be accessible because of the privilege downgrade.

status /var/log/openvpn/openvpn-status.log  

# Output a short status file.

log /var/log/openvpn/openvpn.log  

# Use log or log-append to override the default log location.

verb 3  

# Set the appropriate level of log file verbosity.

Note: Change the certificate paths according to your environment. 

And then, start the OpenVPN service using the created configuration file:

$ systemctl start openvpn@server

Check if the service is listening in the correct port:

$ netstat -pltn |grep openvpn

tcp        0 0 0.0.0.0:1194            0.0.0.0:* LISTEN   20002/openvpn

Finally, in the OpenVPN server, you need to add the IP forwarding line in the sysctl.conf file to allow the VPN traffic:

$ echo "net.ipv4.ip_forward=1">> /etc/sysctl.conf

And run:

$ sysctl -p

net.ipv4.ip_forward = 1

Now, let’s see how to configure an OpenVPN client to connect to this new VPN.

Configuring the OpenVPN Client

In the previous point, we mentioned the OpenVPN sample configuration files, and we used the server one, so now let’s do the same but using the client configuration file.

Copy the file client.conf from /usr/share/doc/openvpn/examples/sample-config-files/ in the corresponding location and change it as you wish.

$ cp /usr/share/doc/openvpn/examples/sample-config-files/client.conf /etc/openvpn/

You’ll also need the following certificates created previously to configure the VPN client:

ca.crt

openvpn-client-1.crt

openvpn-client-1.key

So, copy these files to your local machine or VM. You’ll need to add this files location in the VPN client configuration file.

Now, let’s see a basic client configuration file:

$ cat /etc/openvpn/client.conf

client  

# Specify that we are a client

dev tun  

# Use the same setting as you are using on the server.

proto tcp  

# Use the same setting as you are using on the server.

remote 18.224.138.210 1194  

# The hostname/IP and port of the server.

resolv-retry infinite  

# Keep trying indefinitely to resolve the hostname of the OpenVPN server.

nobind  

# Most clients don't need to bind to a specific local port number.

persist-key  

persist-tun

# Try to preserve some state across restarts.

ca /Users/sinsausti/ca.crt  

cert /Users/sinsausti/openvpn-client-1.crt

key /Users/sinsausti/openvpn-client-1.key

# SSL/TLS parms.

remote-cert-tls server  

# Verify server certificate.

cipher AES-256-CBC  

# Select a cryptographic cipher.

verb 3  

# Set log file verbosity.

Note: Change the certificate paths according to your environment. 

You can use this file to connect to the OpenVPN server from different Operating Systems like Linux, macOS, or Windows.

In this example, we’ll use the application Tunnelblick to connect from a macOS client. Tunnelblick is a free, open source graphic user interface for OpenVPN on macOS. It provides easy control of OpenVPN clients. It comes with all the necessary packages like OpenVPN, EasyRSA, and tun/tap drivers.

As the OpenVPN configuration files have extensions of .tblk, .ovpn, or .conf, Tunnelblick can read all of them.

To install a configuration file, drag and drop it on the Tunnelblick icon in the menu bar or on the list of configurations in the 'Configurations' tab of the 'VPN Details' window.

And then, press on “Connect”.

Now, you should have some new routes in your client machine:

$ netstat -rn # or route -n on Linux OS

Destination        Gateway Flags        Netif Expire

10.8.0.1/32        10.8.0.5 UGSc         utun5

10.8.0.5           10.8.0.6 UH           utun5

172.31.16/20       10.8.0.5 UGSc         utun5

As you can see, there is a route to the local database network via the VPN interface, so you should be able to  access the database service using the Private Database IP Address.

$ mysql -p -h172.31.30.248

Enter password:

Welcome to the MySQL monitor.  Commands end with ; or \g.

Your MySQL connection id is 13

Server version: 8.0.18-9 Percona Server (GPL), Release '9', Revision '53e606f'


Copyright (c) 2000, 2019, Oracle and/or its affiliates. All rights reserved.


Oracle is a registered trademark of Oracle Corporation and/or its

affiliates. Other names may be trademarks of their respective

owners.


Type 'help;' or '\h' for help. Type '\c' to clear the current input statement.


mysql>

It’s working. Now you have your traffic secured using a VPN to connect to your database node.

Conclusion

Protecting your data is a must if you’re accessing it over the internet, on-prem, or on a mixed environment. You must know how to encrypt and secure your remote access. 

As you could see, with OpenVPN you can reach the remote database using the local network through an encrypted connection using self-signed certificates. So, OpenVPN looks like a great option for this task. It’s an open source solution, and the installation/configuration is pretty easy. We used a basic OpenVPN server configuration, so you can look for more complex configuration in the OpenVPN official documentation to improve your OpenVPN server.

Database Performance Tuning for MariaDB

$
0
0

Ever since MySQL was originally forked to form MariaDB it has been widely supported and adopted quickly by a large audience in the open source database community. Originally a drop-in replacement, MariaDB has started to create distinction against MySQL, especially with the release of MariaDB 10.2

Despite this, however, there's still no real telltale difference between MariaDB and MySQL, as both have engines that are compatible and can run natively with one another. So don't be surprised if the tuning of your MariaDB setup has a similar approach to one tuning MySQL

This blog will discuss the tuning of MariaDB, specifically those systems running in a Linux environment.

MariaDB Hardware and System Optimization

MariaDB recommends that you improve your hardware in the following priority order...

Memory

Memory is the most important factor for databases as it allows you to adjust the Server System Variables. More memory means larger key and table caches, which are stored in memory so that disks can access, an order of magnitude slower, is subsequently reduced.

Keep in mind though, simply adding more memory may not result in drastic improvements if the server variables are not set to make use of the extra available memory.

Using more RAM slots on the motherboard increases the bus frequency, and there will be more latency between the RAM and the CPU. This means that using the highest RAM size per slot is preferable.

Disks

Fast disk access is critical, as ultimately it's where the data resides. The key figure is the disk seek time (a measurement of how fast the physical disk can move to access the data) so choose disks with as low a seek time as possible. You can also add dedicated disks for temporary files and transaction logs.

Fast Ethernet

With the appropriate requirements for your internet bandwidth, fast ethernet means it can have faster response to clients requests, replication response time to read binary logs across the slaves, faster response times is also very important especially on Galera-based clusters.

CPU

Although hardware bottlenecks often fall elsewhere, faster processors allow calculations to be performed more quickly, and the results sent back to the client more quickly. Besides processor speed, the processor's bus speed and cache size are also important factors to consider.

Setting Your Disk I/O Scheduler

I/O schedulers exist as a way to optimize disk access requests. It merges I/O requests to similar locations on the disk. This means that the disk drive doesn’t need to seek as often and improves a huge overall response time and saves disk operations. The recommended values for I/O performance are noop and deadline

noop is useful for checking whether complex I/O scheduling decisions of other schedulers are not causing I/O performance regressions. In some cases it can be helpful for devices that do I/O scheduling themselves, as intelligent storage, or devices that do not depend on mechanical movement, like SSDs. Usually, the DEADLINE I/O scheduler is a better choice for these devices, but due to less overhead NOOP may produce better performance on certain workloads.

For deadline, it is a latency-oriented I/O scheduler. Each I/O request has got a deadline assigned. Usually, requests are stored in queues (read and write) sorted by sector numbers. The DEADLINE algorithm maintains two additional queues (read and write) where the requests are sorted by deadline. As long as no request has timed out, the “sector” queue is used. If timeouts occur, requests from the “deadline” queue are served until there are no more expired requests. Generally, the algorithm prefers reads over writes.

For PCIe devices (NVMe SSD drives), they have their own large internal queues along with fast service and do not require or benefit from setting an I/O scheduler. It is recommended to have no explicit scheduler-mode configuration parameter.

You can check your scheduler setting with:

cat /sys/block/${DEVICE}/queue/scheduler

For instance, it should look like this output:

cat /sys/block/sda/queue/scheduler

[noop] deadline cfq

To make it permanent, edit /etc/default/grub configuration file, look for the variable GRUB_CMDLINE_LINUX and add elevator just like below:

GRUB_CMDLINE_LINUX="elevator=noop"

Increase Open Files Limit

To ensure good server performance, the total number of client connections, database files, and log files must not exceed the maximum file descriptor limit on the operating system (ulimit -n). Linux systems limit the number of file descriptors that any one process may open to 1,024 per process. On active database servers (especially production ones) it can easily reach the default system limit.

To increase this, edit /etc/security/limits.conf and specify or add the following:

mysql soft nofile 65535

mysql hard nofile 65535

This requires a system restart. Afterwards, you can confirm by running the following:

$ ulimit -Sn

65535

$ ulimit -Hn

65535

Optionally, you can set this via mysqld_safe if you are starting the mysqld process thru mysqld_safe,

[mysqld_safe]

open_files_limit=4294967295

or if you are using systemd,

sudo tee /etc/systemd/system/mariadb.service.d/limitnofile.conf <<EOF

[Service]


LimitNOFILE=infinity

EOF

sudo systemctl daemon-reload

Setting Swappiness on Linux for MariaDB

Linux Swap plays a big role in database systems. It acts like your spare tire in your vehicle, when nasty memory leaks interfere with your work, the machine will slow down... but in most cases will still be usable to finish its assigned task. 

To apply changes to your swappiness, simply run,

sysctl -w vm.swappiness=1

This happens dynamically, with no need to reboot the server. To make it persistent, edit /etc/sysctl.conf and add the line,

vm.swappiness=1

It's pretty common to set swappiness=0, but since the release of new kernels (i.e. kernels > 2.6.32-303), changes have been made so you need to set vm.swappiness=1.

Filesystem Optimizations for MariaDB

The most common file systems used in Linux environments running MariaDB are ext4 and XFS. There are also certain setups available for implementing an architecture using ZFS and BRTFS (as referenced in the MariaDB documentation).

In addition to this, most database setups do not need to record file access time. You might want to disable this when mounting the volume into the system. To do this, edit your file /etc/fstab. For example, on a volume named /dev/md2, this how it looks like:

/dev/md2 / ext4 defaults,noatime 0 0

Creating an Optimal MariaDB Instance

Store Data On A Separate Volume

It is always ideal to separate your database data on a separate volume. This volume is specifically for those types of fast storage volumes such as SSD, NVMe, or PCIe cards. For example, if your entire system volume will fail, you'll have your database volume safe and rest assured not affected in case your storage hardware will fail. 

Tuneup MariaDB To Utilize Memory Efficiently

innodb_buffer_pool_size

The primary value to adjust on a database server with entirely/primarily XtraDB/InnoDB tables, can be set up to 80% of the total memory in these environments. If set to 2 GB or more, you will probably want to adjust innodb_buffer_pool_instances as well. You can set this dynamically if you are using MariaDB >= 10.2.2 version. Otherwise, it requires a server restart.

tmp_memory_table_size/max_heap_table_size

For tmp_memory_table_size (tmp_table_size), if you're dealing with large temporary tables, setting this higher provides performance gains as it will be stored in the memory. This is common on queries that are heavily using GROUP BY, UNION, or sub-queries. Although if max_heap_table_size is smaller, the lower limit will apply. If a table exceeds the limit, MariaDB converts it to a MyISAM or Aria table. You can see if it's necessary to increase by comparing the status variables Created_tmp_disk_tables and Created_tmp_tables to see how many temporary tables out of the total created needed to be converted to disk. Often complex GROUP BY queries are responsible for exceeding the limit.

While max_heap_table_size,  this is the maximum size for user-created MEMORY tables. The value set on this variable is only applicable for the newly created or re-created tables and not the existing ones. The smaller of max_heap_table_size and tmp_table_size also limits internal in-memory tables. When the maximum size is reached, any further attempts to insert data will receive a "table ... is full" error. Temporary tables created with CREATE TEMPORARY will not be converted to Aria, as occurs with internal temporary tables, but will also receive a table full error.

innodb_log_file_size

Large memories with high-speed processing and fast I/O disk aren't new and has its reasonable price as it recommends. If you are preferring more performance gains especially during and handling your InnoDB transactions, setting the variable innodb_log_file_size to a larger value such as 5Gib or even 10GiB is reasonable. Increasing means that the larger transactions can run without needing to perform disk I/O before committing. 

join_buffer_size

In some cases, your queries tend to lack use of proper indexing or simply, there are instances that you need this query to run. Not unless it's going to be heavily called or invoked from the client perspective, setting this variable is best on a session level. Increase it to get faster full joins when adding indexes is not possible, although be aware of memory issues, since joins will always allocate the minimum size.

Set Your max_allowed_packet

MariaDB has the same nature as MySQL when handling packets. It splits data into packets and the client must be aware of the max_allowed_packet variable value. The server will have a buffer to store the body with a maximum size corresponding to this max_allowed_packet value. If the client sends more data than max_allowed_packet size, the socket will be closed. The max_allowed_packet directive defines the maximum size of packet that can be sent.

Setting this value too low can cause a query to stop and close its client connection which is pretty common to receive errors like ER_NET_PACKET_TOO_LARGE or Lost connection to MySQL server during query. Ideally, especially on most application demands today, you can start setting this to 512MiB. If it's a low-demand type of application, just use the default value and set this variable only via session when needed if the data to be sent or received is too large than the default value (16MiB since MariaDB 10.2.4). In certain workloads that demand on large packets to be processed, then you need to adjust his higher according to your needs especially when on replication. If max_allowed_packet is too small on the slave, this also causes the slave to stop the I/O thread.

Using Threadpool

In some cases, this tuning might not be necessary or recommended for you. Threadpools are most efficient in situations where queries are relatively short and the load is CPU bound (OLTP workloads). If the workload is not CPU bound, you might still want to limit the number of threads to save memory for the database memory buffers.

Using threadpool is an ideal solution especially if your system is experiencing context switching and you are finding ways to reduce this and maintain a lower number of threads than the number of clients. However, this number should also not be too low, since we also want to make maximum use of the available CPUs. Therefore there should be, ideally, a single active thread for each CPU on the machine.

You can set the thread_pool_max_threads, thread_pool_min_threads for the maximum and the minimum number of threads. Unlike MySQL, this is only present in MariaDB.

Set the variable thread_handling which determines how the server handles threads for client connections. In addition to threads for client connections, this also applies to certain internal server threads, such as Galera slave threads.

Tune Your Table Cache + max_connections

If you are facing occasional occurrences in the processlist about Opening tables and Closing tables statuses, it can signify that you need to increase your table cache. You can monitor this also via the mysql client prompt by running SHOW GLOBAL STATUS LIKE 'Open%table%'; and monitor the status variables. 

For max_connections, if you are application requires a lot of concurrent connections, you can start setting this to 500. 

Fortable_open_cache, it shall be the total number of your tables but it's best you add more depending on the type of queries you serve since temporary tables shall be cached as well. For example, if you have 500 tables, it would be reasonable you start with 1500. 

While your table_open_cache_instances, start setting it to 8. This can improve scalability by reducing contention among sessions, the open tables cache can be partitioned into several smaller cache instances of size table_open_cache / table_open_cache_instances.

For InnoDB, table_definition_cache acts as a soft limit for the number of open table instances in the InnoDB data dictionary cache. The value to be defined will set the number of table definitions that can be stored in the definition cache. If you use a large number of tables, you can create a large table definition cache to speed up opening of tables. The table definition cache takes less space and does not use file descriptors, unlike the normal table cache. The minimum value is 400. The default value is based on the following formula, capped to a limit of 2000:

MIN(400 + table_open_cache / 2, 2000)

If the number of open table instances exceeds the table_definition_cache setting, the LRU mechanism begins to mark table instances for eviction and eventually removes them from the data dictionary cache. The limit helps address situations in which significant amounts of memory would be used to cache rarely used table instances until the next server restart. The number of table instances with cached metadata could be higher than the limit defined by table_definition_cache, because parent and child table instances with foreign key relationships are not placed on the LRU list and are not subject to eviction from memory.

Unlike the table_open_cache, the table_definition_cache doesn't use file descriptors, and is much smaller.

Dealing with Query Cache

Preferably, we recommend to disable query cache in all of your MariaDB setup. You need to ensure that query_cache_type=OFF and query_cache_size=0 to complete disable query cache. Unlike MySQL, MariaDB is still completely supporting query cache and do not have any plans on withdrawing its support to use query cache. There are some people claiming that query cache still provides performance benefits for them. However, this post from Percona The MySQL query cache: Worst enemy or best friend reveals that query cache, if enabled, results to have an overhead and shows to have a bad server performance.

If you intend to use query cache, make sure that you monitor your query cache by runningSHOW GLOBAL STATUS LIKE 'Qcache%';. Qcache_inserts contains the number of queries added to the query cache, Qcache_hits contains the number of queries that have made use of the query cache, while Qcache_lowmem_prunes contains the number of queries that were dropped from the cache due to lack of memory. While in due time, using and enabling query cache may become fragmented. A high Qcache_free_blocks relative to Qcache_total_blocks may indicate fragmentation. To defragment it, run FLUSH QUERY CACHE. This will defragment the query cache without dropping any queries.

Always Monitor Your Servers

It is highly important that you properly monitor your MariaDB nodes. Common monitoring tools out there (like Nagios, Zabbix, or PMM) are available if you tend to prefer free and open-source tools. For corporate and fully-packed tools we suggest you give ClusterControl a try, as it does not only provide monitoring, but it also offers performance advisors, alerts and alarms which helps you improve your system performance and stay up-to-date with the current trends as you engage with the Support team. Database monitoring with ClusterControl is free and part of the Community Edition.

Conclusion

Tuning your MariaDB setup is almost the same approach as MySQL, but with some disparities, as it differs in some of its approaches and versions that it does support. MariaDB is now a different entity in the database world and has quickly gained the trust by the community without any FUD. They have their own reasons why it has to be implemented this way so it's very important we know how to tune this and optimize your MariaDB server(s).

Tips for Delivering MySQL Database Performance - Part Two

$
0
0

The management of database performance is an area that businesses when administrators often find themselves contributing more time to than they expected.

Monitoring and reacting to the production database performance issues is one of the most critical tasks within a database administrator job. It is an ongoing process that requires constant care. Application and underlying databases usually evolve with time; grow in size, number of users, workload, schema changes that come with code changes.

Long-running queries are seldom inevitable in a MySQL database. In some circumstances, a long-running query may be a harmful event. If you care about your database, optimizing query performance, and detecting long-running queries must be performed regularly. 

In this blog, we are going to take a more in-depth look at the actual database workload, especially on the running queries side. We will check how to track queries, what kind of information we can find in MySQL metadata, what tools to use to analyze such queries.

Handling The Long-Running Queries

Let’s start with checking Long-running queries. First of all, we have to know the nature of the query, whether it is expected to be a long-running or a short running query. Some analytic and batch operations are supposed to be long-running queries, so we can skip those for now. Also, depending on the table size, modifying table structure with ALTER command can be a long-running operation (especially in MySQL Galera Clusters).

  • Table lock - The table is locked by a global lock or explicit table lock when the query is trying to access it.
  • Inefficient query - Use non-indexed columns while lookup or joining, thus MySQL takes a longer time to match the condition.
  • Deadlock - A query is waiting to access the same rows that are locked by another request.
  • Dataset does not fit into RAM - If your working set data fits into that cache, then SELECT queries will usually be relatively fast.
  • Suboptimal hardware resources - This could be slow disks, RAID rebuilding, saturated network, etc.

If you see a query takes longer than usual to execute, do investigate it.

Using the MySQL Show Process List

​MYSQL> SHOW PROCESSLIST;

This is usually the first thing you run in the case of performance issues. SHOW PROCESSLIST is an internal mysql command which shows you which threads are running. You can also see this information from the information_schema.PROCESSLIST table or the mysqladmin process list command. If you have the PROCESS privilege, you can see all threads. You can see information like Query Id, execution time, who runs it, the client host, etc. The information with slightly wary depending on the MySQL flavor and distribution (Oracle, MariaDB, Percona)

SHOW PROCESSLIST;

+----+-----------------+-----------+------+---------+------+------------------------+------------------+----------+

| Id | User            | Host | db | Command | Time | State                  | Info | Progress |

+----+-----------------+-----------+------+---------+------+------------------------+------------------+----------+

|  2 | event_scheduler | localhost | NULL | Daemon  | 2693 | Waiting on empty queue | NULL   | 0.000 |

|  4 | root            | localhost | NULL | Query   | 0 | Table lock   | SHOW PROCESSLIST | 0.000 |

+----+-----------------+-----------+------+---------+------+------------------------+------------------+----------+

we can immediately see the offensive query right away from the output. In the above example that could be a Table lock.  But how often do we stare at those processes? This is only useful if you are aware of the long-running transaction. Otherwise, you wouldn't know until something happens - like connections are piling up, or the server is getting slower than usual.

Using MySQL Pt-query-digest

If you would like to see more information about a particular workload use pt-query-digest.  The pt-query-digest is a Linux tool from Percona to analyze MySQL queries. It’s part of the Percona Toolkit which you can find here. It supports the most popular 64 bit Linux distributions like Debian, Ubuntu, and Redhat. 

To install it you must configure Percona repositories and then install the perona-toolkit package.

Install Percona Toolkit using your package manager:

Debian or Ubuntu:

sudo apt-get install percona-toolkit

RHEL or CentOS:

sudo yum install percona-toolkit

Pt-query-digest accepts data from the process list, general log, binary log, slow log or tcpdump In addition to that, it’s possible to poll the MySQL process list at a defined interval - a process that can be resource-intensive and far from ideal, but can still be used as an alternative.

The most common source for pt-query-digest is a slow query log. You can control how much data will go there with parameter log_slow_verbosity.  

There are a number of things that may cause a query to take a longer time to execute:

  • microtime - queries with microsecond precision.
  • query_plan - information about the query’s execution plan.
  • innodb  - InnoDB statistics.
  • minimal - Equivalent to enabling just microtime.
  • standard - Equivalent to enabling microtime,innodb.
  • full - Equivalent to all other values OR’ed together without the profiling and profiling_use_getrusage options.
  • profiling - Enables profiling of all queries in all connections.
  • profiling_use_getrusage - Enables usage of the getrusage function.

source: Percona documentation

For completeness use log_slow_verbosity=full which is a common case.

Slow Query Log

The slow query log can be used to find queries that take a long time to execute and are therefore candidates for optimization. Slow query log captures slow queries (SQL statements that take more than long_query_time seconds to execute), or queries that do not use indexes for lookups (log_queries_not_using_indexes). This feature is not enabled by default and to enable it simply set the following lines and restart the MySQL server:

[mysqld]
slow_query_log=1
log_queries_not_using_indexes=1
long_query_time=0.1

The slow query log can be used to find queries that take a long time to execute and are therefore candidates for optimization. However, examining a long slow query log can be a time-consuming task. There are tools to parse MySQL slow query log files and summarize their contents like mysqldumpslow, pt-query-digest.

Performance Schema

Performance Schema is a great tool available for monitoring MySQL Server internals and execution details at a lower level. It had a bad reputation in an early version (5.6) because enabling it often caused performance issues, however the recent versions do not harm performance. The following tables in Performance Schema can be used to find slow queries:

  • events_statements_current
  • events_statements_history
  • events_statements_history_long
  • events_statements_summary_by_digest
  • events_statements_summary_by_user_by_event_name
  • events_statements_summary_by_host_by_event_name

MySQL 5.7.7 and higher include the sys schema, a set of objects that helps DBAs and developers interpret data collected by the Performance Schema into a more easily understandable form. Sys schema objects can be used for typical tuning and diagnosis use cases.

Network tracking

What if we don’t have access to the query log or direct application logs. In that case, we could use a combination of tcpdump and pt-query digest which could help to capture queries.

$ tcpdump -s 65535 -x -nn -q -tttt -i any port 3306 > mysql.tcp.txt

Once the capture process ends, we can proceed with processing the data:

$ pt-query-digest --limit=100% --type tcpdump mysql.tcp.txt > ptqd_tcp.out

ClusterControl Query Monitor

ClusterControl Query Monitor is a module in a cluster control that provides combined information about database activity. It can gather information from multiple sources like show process list or slow query log and present it in a pre-aggregated way. 

ClusterControl Top Queries

The SQL Monitoring is divided into three sections.

Top Queries

presents the information about queries that take a significant chunk of resources.

ClusterControl Top Queries

Running Queries

it’s a process list of information combined from all database cluster nodes into one view. You can use that to kill queries that affect your database operations.

ClusterControl Running Queries

Query Outliers

present the list of queries with execution time longer than average.

ClusterControl Query Outliners

Conclusion

This is all for part two. This blog is not intended to be an exhaustive guide to how to enhance database performance, but it hopefully gives a clearer picture of what things can become essential and some of the basic parameters that can be configured. Do not hesitate to let us know if we’ve missed any important ones in the comments below.


A SOx Compliance Checklist for PostgreSQL

$
0
0

The United States SOx (Sarbanes-Oxley) Act, 2002, addresses a broad spectrum of fundamental information security principles for commercial enterprises, ensuring their functions are rooted and consistently applied, based on concepts of CIA (Confidentiality, Integrity, and Availability).

Accomplishing these goals requires commitment from many individuals, all which must be aware of; their responsibilities maintaining the secure state of the enterprise assets, understanding policies, procedures, standards, guidelines, and the possibilities of losses involved with their duties.

CIA aims at ensuring that the alignment of the business strategy, goals, mission, and objectives, are supported by security controls, approved in consideration with senior management's due diligence, and tolerance for risks and costs.

PostgreSQL Database Clusters

The PostgreSQL Server has a broad collection of features offered for free, making it one of the most popular DBMS (Database Management Systems), enabling its adoption on a wide range of projects in different social and economic spheres.

The main advantage for its adoption, is the Open Source License, removing concerns around copyright infringement within an organization, possibly being caused by an IT administrator, inadvertently exceeding the number of permitted licenses.

The implementation of information security for PostgreSQL (From an organizational context) will not be successful without carefully constructed and uniformly applied security policies and procedures which cover all aspects of business continuity planning.

BCP (Business Continuity Planning)

Leadership must agree prior to starting the BCP program to ensure they understand the expected deliverables, as well their personal liability (financially and even criminally) if it is determined that they did not use due care to adequately protect the organization and its resources.

The senior management's expectations are communicated through policies, developed and maintained by security officers, responsible for establishing procedures and adherence to standards, baselines, and guidelines, and for discovering SPoFs (Single Points of Failure) that can compromise an entire system from working securely and reliably.

The classification of these potential disruptive events, is done using BIA (Business Impact Analysis), which is a sequential approach of; identifying the assets and business processes, determine criticality of each one, estimate MTD (Maximum Tolerable Downtime) based on their time sensitivity for recovery, and finally, calculate the recovery objectives; RTO (Recovery Time Objective) and RPO (Recovery Point Objective), considering the cost of achieving the objective, versus, the benefit.

Data Access Roles and Responsibilities

Commercial businesses commonly hire outside firms who specialize in background checks in order to gather more information of prospective new employees, assisting the hiring manager with solid work records, validating education degrees and certifications, criminal history, and reference checks.

Operational systems are being out-dated and poor or written down passwords, are just a couple of the many ways unauthorized individuals can find vulnerabilities and attack an organization's information systems, through the network or social engineering.

Third-party services, hired by the organization, can represent a threat as well, especially if employees are not trained to use proper security procedures. Their interactions must be rooted in strong security foundations in order to prevent information disclosure.

Least privilege refers to granting users only the access they need to do their jobs, nothing more. While some employees (based upon their job functions) have a higher “need-to-know” access. Consequently, their workstations must be continuously monitored, and up-to-date with security standards.

Some Resources That Can Help

Logos of frameworks and organizations, responsible for providing Cybersecurity guidelines.

COSO (Committee of Sponsoring Organizations of the Treadway Commission)

Formed in 1985, to sponsor the US (United States) National Commission on Fraudulent Financial Reporting, which studied causal factors that lead to fraudulent financial reporting, and produced recommendations for; public companies, their auditors, the SEC (Securities Exchange Commission), other regulators, and law enforcement bodies.

ITIL (Information Technology Infrastructure Library)

Built by the British government’s Stationary Office, ITIL is a framework composed of a set of books, which demonstrates best practices for specific needs for IT of an organization, such as management of core operational processes, incidents and availability, and financial considerations.

COBIT (Control Objectives for Information and Related Technology)

Published by the ITGI (IT Governance Institute), COBIT is a framework that provides an overall structure for IT controls, including examination of efficiency, effectiveness, CIA, reliability, and compliance, in alignment with the business needs. ISACA (Information Systems Audit and Control Association) provides deep instructions about COBIT, as well as certifications recognized globally, such as CISA (Certified Information Systems Auditor).

ISO/IEC 27002:2013 (International Organization for Standardization/International Electrotechnical Commission)

Previously known as ISO/IEC 17799:2005, the ISO/IEC 27002:2013 contains detailed instructions for organizations, covering information security controls, such as; policies, compliance, access controls, operations and HR (Human Resources) security, cryptography, management of incidents, risks, BC (Business Continuity), assets, and many more. There is also a preview of the document.

VERIS (Vocabulary of Event Recording and Incident Sharing)

Available on GitHub, VERIS is a project in continuous development, intended to help organizations collecting useful incident-related information, and sharing it anonymously and responsibly, expanding the VCDB (VERIS Community Database). The cooperation of users, resulting in an excellent reference for risk management, is then translated into an annual report, the VDBIR (Verizon Data Breach Investigation Report).

OECD Guidelines (Organization for Economic Cooperation and Development)

The OECD, in cooperation with partners around the globe, promotes RBCs (Responsible Business Conduct) for multinational enterprises, ensuring privacy to individuals upon their PII (Personally Identifiable Information), and establishing principles of how their data must be retained and maintained by enterprises.

NIST SP 800 Series (National Institute of Standards and Technology Special Publication)

The US NIST, provides on its CSRC (Computer Security Resource Center), a collection of publications for Cybersecurity, covering all kinds of topics, including databases. The most important one, from a database perspective, is the SP 800-53 Revision 4.

Conclusion

The Information Security Triad, versus its opposite.

Achieving SOx goals is a daily concern for many organizations, even those not limited to accounting activities. Frameworks containing instructions for risk assessment and internal controls must be in place for enterprise's security practitioners, as well as software for preventing destruction, alteration, and disclosure of sensitive data.


Announcing ClusterControl 1.7.5: Advanced Cluster Maintenance & Support for PostgreSQL 12 and MongoDB 4.2

$
0
0

We’re excited to announce the 1.7.5 release of ClusterControl - the only database management system you’ll ever need to take control of your open source database infrastructure. 

This new version features support for the latest MongoDB& PostgreSQL general releases as well as new operating system support allowing you to install ClusterControl on Centos 8 and Debian 10.

ClusterControl 1.7.4 provided the ability to place a node into Maintenance Mode. 1.7.5 now allows you to place (or schedule) the entire database cluster in Maintenance Mode, giving you more control over your database operations.

In addition, we are excited to announce a brand new function in ClusterControl we call “Freeze Frame.” This new feature will take snapshots of your MySQL or MariaDB setups right before a detected failure, providing you with invaluable troubleshooting information about what caused the issue. 

Release Highlights

Database Cluster-Wide Maintenance

  • Perform tasks in Maintenance-Mode across the entire database cluster.
  • Enable/disable cluster-wide maintenance mode with a cron-based scheduler.
  • Enable/disable recurring jobs such as cluster or node recovery with automatic maintenance mode.

MySQL Freeze Frame (BETA)

  • Snapshot MySQL status before cluster failure.
  • Snapshot MySQL process list before cluster failure (coming soon).
  • Inspect cluster incidents in operational reports or from the s9s command line tool.

New Operating System & Database Support

  • Centos 8 and Debian 10 support.
  • PostgreSQL 12 support.
  • MongoDB 4.2 and Percona MongoDB v4.0 support.

Additional Misc Improvements

  • Synchronize time range selection between the Overview and Node pages.
  • Improvements to the nodes status updates to be more accurate and with less delay.
  • Enable/Disable Cluster and Node recovery are now regular CMON jobs.
  • Topology view for Cluster-to-Cluster Replication.
 

View Release Details and Resources

Release Details

Cluster-Wide Maintenance 

The ability to place a database node into Maintenance Mode was implemented in the last version of ClusterControl (1.7.4). In this release we now offer the ability to place your entire database cluster into Maintenance Mode to allow you to perform updates, patches, and more.

MySQL & MariaDB Freeze Frame

This new ClusterControl feature allows you to get a snapshot of your MySQL statuses and related processes immediately before a failure is detected. This allows you to better understand what happened when troubleshooting, and provide you with actionable information on how you can prevent this type of failure from happening in the future. 

This new feature is not part of the auto-recovery features in ClusterControl. Should your database cluster go down those functions will still perform to attempt to get you back online; it’s just that now you’ll have a better idea of what caused it. 

Support for PostgreSQL 12

Released in October 2019, PostgreSQL 12 featured major improvements to indexing, partitioning, new SQL & JSON functions, and improved security features, mainly around authentication. ClusterControl now allows you to deploy a preconfigured Postgres 12 database cluster with the ability to fully monitor and manage it.

PostgreSQL GUI - ClusterControl

Support for MongoDB 4.2

MongoDB 4.2 offers unique improvements such as new ACID transaction guarantees, new query and analytics functions including new charts for rich data visualizations. ClusterControl now allows you to deploy a preconfigured MongoDB 4.2 or Percona Server for MongoDB 4.2 ReplicaSet with the ability to fully monitor and manage it.

MongoDB GUI - ClusterControl
 

Cluster-Wide Database Maintenance and Why You Need It

$
0
0

Undoubtedly, there is a long list of maintenance tasks that have to be performed by system administrators, especially when it comes to critical systems. Some of the tasks have to be performed at regular intervals, like daily, weekly, monthly and yearly. Some have to be done right away, urgently. Nevertheless, any maintenance operation should not lead to another bigger problem, and any maintenance has to be handled with extra care to avoid any interruption to the business. Therefore, planning, scheduling and reporting are important aspects. 

ClusterControl, as a cluster automation and management tool, is smart enough to plan and schedule maintenance windows in advance. This can help avoid unpleasant surprises during production operations, for instance unnecessary recovery procedure, failovers and alarms being triggered. This blog showcases some of the new maintenance mode features that come with ClusterControl 1.7.5.

Maintenance Mode pre v1.7.5

Maintenance mode has been in ClusterControl logic since v1.4.0, where one could set a maintenance duration to an individual node, which allows ClusterControl to disable recovery/failover and alarms on that node during a set period. The maintenance mode can be activated immediately or scheduled to run in the future. Alarms and notifications will be turned off when maintenance mode is active, which is expected in an environment where the corresponding node is undergoing maintenance.

Some of the weaknesses that we found out and also reported by our users:

  • Maintenance mode was bound per node. This means if one would want to perform maintenance on all nodes in the cluster, one had to repeatedly configure the maintenance mode for every node in the cluster. For larger environments, scheduling a major maintenance window for all nodes on multiple clusters could be repetitive.
  • Activating maintenance mode did not deactivate the automatic recovery feature. This would cause an unhealthy node to be recovered automatically while maintenance is ongoing. False alarms might be raised.
  • Maintenance mode could not be activated periodically per schedule. Therefore, regular maintenance had to be defined manually for every approaching date. There was no way to schedule a cron-based (with iteration) maintenance mode.

ClusterControl new maintenance mode and job implementations solve all of the key problems mentioned, which are shown in the next sections.

Database Cluster-Wide Maintenance Mode

Cluster-wide maintenance mode comes handy in an environment where you have multiple clusters, and multiple nodes per cluster managed by a single ClusterControl instance. For example, a common production setup of a MySQL Galera Cluster could have up to 7 nodes - A three-node Galera Cluster could have one additional host for asynchronous slave, with two ProxySQL/Keepalived nodes and one backup verification server. For older ClusterControl versions where only node maintenance was supported, if a major maintenance is required, for example upgrading OS kernel on all hosts, the scheduling had to be repeated 7 times for every monitored node. We have covered this issue in detail in this blog post, with some workarounds.

Cluster-wide maintenance mode is the super-set of node maintenance mode as in the previous versions. An activated cluster-wide maintenance mode will activate maintenance mode on all nodes in the particular cluster. Simply click on the Cluster Actions > Schedule Maintenance Mode and you will be presented with the following dialog:

The fields in this dialog are almost identical with scheduling maintenance dialog for single node, except its domain is the particular cluster, as highlighted in the red oval. You can activate the maintenance immediately, or schedule it to run in the future. Once scheduled, you should see the following notification under the summary bar with status "Scheduled" for all clusters:

Once the maintenance mode is activated, you should see the blue maintenance icon on the summary bar of the cluster, together with the green 'Active' icon notification in the ClusterControl UI:

All active maintenance mode can be deactivated at any time via the UI, just go to the Cluster Actions > Disable Maintenance Mode.

Advanced Maintenance Management via ClusterControl CLI

ClusterControl CLI a.k.a s9s, comes with an extended maintenance management functionality, allowing users to improve the existing maintenance operation flow as a whole. The CLI works by sending commands as JSON messages to ClusterControl Controller (CMON) RPC interface, via TLS encryption which requires the port 9501 to be opened on controller and the client host.

With a bit of scripting knowledge, we can fully automate and synchronize the maintenance process flow especially if the exercise involves another layer/party/domain outside of ClusterControl. Note that we always incorporated our changes via the CLI first before making it to the UI. This is one of the ways to test out new functionality to find out if they would be useful to our users.

The following sections will give you a walkthrough on advanced management for maintenance mode via command line.

View Maintenance Mode

To list out all maintenance that has been scheduled for all clusters and nodes:

$ s9s maintenance --list --long

ST UUID    OWNER     GROUP START             END HOST/CLUSTER REASON

Ah 460a97b dba            admins 02:31:32 04:31:32            192.168.0.22 Switching to different racks

-h e3bf19f user@email.com        2020-01-17 02:35:00 2020-01-17 03:00:00 192.168.0.23 Change network cable - Clark Kent

-c 8f55f76 user@email.com        2020-01-17 02:34:00 2020-01-17 03:59:00 PXC 57       Kernel upgrade and system reboot - John Doe

Ac 4f4d73c dba            admins 02:30:01 02:31:01            MariaDB 10.3 Test maintenance job creation every 5 minutes

Owner with email address means the maintenance mode was created by ClusterControl UI user. While for owners with groups, that user is coming from the CLI with our new user/group permission currently supported on CLI only. The leftmost column is the maintenance mode status:

  • The first character: 'A' stands for active and '-' stands for inactive.
  • The second character: 'h' stands for host-related maintenance and 'c' stands for cluster-related maintenance.

To list out the current active maintenance mode:

$ s9s maintenance --current --cluster-id=32

Cluster 32 is under maintenance: Kernel upgrade and system reboot - John Doe

Use the job command option to get the timestamp, and status of past maintenance mode:

$ s9s job --list | grep -i maintenance

5979  32 SCHEDULED dba            admins 2020-01-09 05:29:34 0% Registering Maintenance

5980  32 FINISHED  dba   admins 2020-01-09 05:30:01   0% Registering Maintenance

5981  32 FINISHED  dba   admins 2020-01-09 05:35:00   0% Registering Maintenance

5982  32 FINISHED  dba   admins 2020-01-09 05:40:00   0% Registering Maintenance

'Registering Maintenance' is the job name to schedule or activate the maintenance mode.

Create a Maintenance Mode

To create a new maintenance mode for a node, specify the host under --nodes parameter, with --begin and --end in ISO 8601 (with microsecond, UTC only thus the suffix 'Z') date format:

$ s9s maintenance --create \

--nodes="192.168.0.21" \

--begin="2020-01-09T08:50:58.000Z" \

--end="2020-01-09T09:50:58.000Z" \

--reason="Upgrading RAM"

However, the above will require an extra effort to figure out the correct start time and end time. We can use the "date" command to translate the date and time to the supported format relative to the current time, similar to below:

$ s9s maintenance --create \

--nodes="192.168.0.21" \

--begin="$(date +%FT%T.000Z -d 'now')" \

--end="$(date +%FT%T.000Z -d 'now + 2 hours')" \

--reason="Upgrading RAM"

b348f2ac-9daa-4481-9a95-e8cdf83e81fc

The above will activate a maintenance mode for node 192.168.0.21 immediately and will end up in 2 hours from the moment it was created. An accepted command should receive a UUID, as in the above example, it was 'b348f2ac-9daa-4481-9a95-e8cdf83e81fc'. A wrong command will simply return a blank output.

The following command will schedule a maintenance mode for cluster ID 32 on the next day:

$ s9s maintenance --create \

--cluster-id=32 \

--begin="$(date +%FT%T.000Z -d 'now + 1 day')" \

--end="$(date +%FT%T.000Z -d 'now + 1 day + 2 hours')" \

--reason="Replacing old network cable"

85128b1a-a1cd-450e-b381-2a92c03db7a0

We can also see what is coming up next in the scheduled maintenance for a particular node or cluster:

$ date -d 'now'

Wed Jan  8 07:41:57 UTC 2020

$ s9s maintenance --next --cluster-id=32 --nodes='192.168.0.22'

Host 192.168.0.22 maintenance starts Jan 09 07:41:23: Replacing old network cable

Omit --nodes if you just want to see the upcoming maintenance details for a particular cluster.

Delete Maintenance Mode

Firstly, retrieve the maintenance job UUID:

$ s9s maintenance --list --long

ST UUID    OWNER     GROUP START           END HOST/CLUSTER             REASON

-h 7edeabb user@email.com       04:59:00 06:59:00         192.168.0.21 Changing network cable - John Doe

-c 82b13d3 user@email.com       2020-01-10 05:02:00 2020-01-10 06:27:00 MariaDB 10.3 Replication Upgrading RAM

Total: 2

Use the --uuid and specify the corresponding maintenance mode to delete:

$ s9s maintenance --delete --uuid=82b13d3

Deleted.

At this point the maintenance mode has been deleted for the corresponding node or cluster.

Maintenance Mode Scheduling with Iteration

In ClusterControl 1.7.5, maintenance mode can be scheduled and iterated just like a cron job. For example, you can now schedule a maintenance mode for daily, weekly, monthly or yearly. This iteration automates the maintenance mode job creation and simplifies the maintenance workflow, especially if you are running in a fully automated infrastructures, where maintenance happens automatically and at regular intervals.

There is a special flag that we have to use called --create-with-job, where it registers the maintenance as a new job for the controller to execute. The following is a simple example where we activate maintenance mode by registering a new job:

$ s9s maintenance \

--create-with-job \

--cluster-id=32 \

--reason="testmainteannce" \

--minutes=60 \

--log

Preparing to register maintenance.

The owner of the maintenance will be 'dba'.

The reason is: testmainteannce

The maintenance starts NOW.

Maintenance will be 60 minute(s) long.

Registering maintenance for cluster 32.

Maintenance registered.

To schedule a periodic maintenance, use the --create-with-job flag, with --minutes for the maintenance duration and --recurrence flag in cron-style formatting. The following command schedules a maintenance job every Friday at 3 AM for cluster ID 32:

$ s9s maintenance \

--create-with-job \

--cluster-id=32 \

--reason="Weekly OS patch at 3 AM every Friday" \

--minutes=120 \

--recurrence="0 3 * * 5" \

--job-tags="maintenance"

Job with ID 5978 registered.

You should get a job ID in the response. We can then verify if the job has been created correctly:

$ s9s job --list --job-id=5978

ID   CID STATE     OWNER GROUP CREATED  RDY TITLE

5978  32 SCHEDULED dba   admins 05:21:07 0% Registering Maintenance

We can also use the --show-scheduled flag together with --long flag to get extended information on the scheduled job:

$ s9s job --show-scheduled --list --long

--------------------------------------------------------------------------------------------------------------------------

Registering Maintenance

Scheduled


Created   : 2020-01-09 05:21:07    ID : 5978 Status : SCHEDULED

Started   :               User : dba Host : 127.0.0.1

Ended     :               Group: admins Cluster: 32

Tags      : #maintenance

RPC       : 2.0

--------------------------------------------------------------------------------------------------------------------------

A recurring job created by the scheduled job will be tagged as "recurrence":

--------------------------------------------------------------------------------------------------------------------------

Registering Maintenance

Job finished.                                                                                                [ ]

                                                                                                                 0.00%

Created   : 2020-01-09 05:40:00    ID : 5982 Status : FINISHED

Started   : 2020-01-09 05:40:01    User : dba Host : 127.0.0.1

Ended     : 2020-01-09 05:40:01    Group: admins Cluster: 32

Tags      : #recurrence

RPC       : 2.0

--------------------------------------------------------------------------------------------------------------------------

Thus, to list out the recurring job, we can use the --job-tags flag. The following example shows executed recurring jobs scheduled to run every 5 minutes:

$ s9s job --list --job-tags=recurrence

ID   CID STATE    OWNER GROUP CREATED  RDY TITLE

5980  32 FINISHED dba   admins 05:30:01 0% Registering Maintenance

5981  32 FINISHED dba   admins 05:35:00 0% Registering Maintenance

5982  32 FINISHED dba   admins 05:40:00 0% Registering Maintenance

Automatic Recovery as a Job

In the previous versions, automatic recovery feature can only be enabled or disabled at runtime via the UI, through a simple switch button in the cluster's summary bar, as shown in the following screenshot:

In ClusterControl 1.7.5, automatic recovery is also part of an internal job, where the configuration can be controlled via CLI and persistent across restarts. This means the job can be scheduled, iterated and controlled with an expiration period via ClusterControl CLI and allows users to incorporate the automatic recovery management in the maintenance automation scripts when necessary. 

When a cluster-wide maintenance is ongoing, it is pretty common to see some questionable states of database hosts, which is totally acceptable during this period. The common practice is to ignore these questionable states and make no interruption to the node while maintenance is happening. If ClusterControl automatic recovery is turned on, it will automatically attempt to recover the problematic host back to the good state, regardless of the maintenance mode state. Thus, disabling ClusterControl automatic recovery during the maintenance operation is highly recommended so ClusterControl will not interrupt the maintenance as it carries on.

To disable cluster automatic recovery, simply use the --disable-recovery flag with respective cluster ID:

$ s9s cluster --disable-recovery --log --cluster-id=32

Cluster ID is 32.

Cluster recovery is currently enabled.

Node recovery is currently enabled.

Disabling cluster auto recovery.

Disabling node auto recovery.

To reverse the above, use --enable-recovery flag to enable it again:

[root@cc ~]# s9s cluster --enable-recovery --log --cluster-id=32

Cluster ID is 32.

Cluster recovery is currently disabled.

Node recovery is currently disabled.

Enabling cluster auto recovery.

Enabling node auto recovery.

The CLI also supports disabling recovery together with activating maintenance mode in the same command. One has to use the --maintenance-minutes flag and optionally provide a reason:

$ s9s cluster \

--disable-recovery \

--log \

--cluster-id=29 \

--maintenance-minutes=60 \

--reason='Disabling recovery for 1 hour to update kernel'

Registering maintenance for 60 minute(s) for cluster 32.

Cluster ID is 29.

Cluster recovery is currently enabled.

Node recovery is currently enabled.

Disabling cluster auto recovery.

Disabling node auto recovery.

From the above output, we can tell that ClusterControl has disabled automatic recovery for the node, and also registered a maintenance mode for the cluster. We can then verify with the list maintenance command:

$ s9s maintenance --list --long

ST UUID    OWNER     GROUP START END      HOST/CLUSTER REASON

Ac 687e255 system         admins 06:09:57 07:09:57 MariaDB 10.3 Replication Disabling recovery for 1 hour to update kernel

Similarly, it will appear in the UI as shown in the following screenshot:

You can enable the automatic recovery feature using the --enable-recovery flag if it is no longer necessary. The maintenance mode will still be active as defined in the --maintenance-minutes option, unless you explicitly delete or deactivate the maintenance mode via GUI or CLI.

Conclusion

ClusterControl allows you to manage your maintenance window efficiently, by discarding possible false alarms and controlling the automatic recovery behaviour while maintenance is ongoing. Maintenance mode is available for free in all ClusterControl editions, so give it a try.

Database Management & Monitoring for PostgreSQL 12

$
0
0

A few months ago we blogged about the release of PostgreSQL 12, with notable improvements to query performance (particularly over larger data sets and overall space utilization) among other important features. Now, with the ClusterControl 1.7.5 version, we’re glad to announce support for this new PostgreSQL version.

This new ClusterControl 1.7.5 version comes with many new features for managing and monitoring your database cluster. In this blog, we’ll take a look at these features and see how to deploy PostgreSQL 12 easily.

Easily Deploy PostgreSQL 12

To perform a new installation of PostgreSQL 12 from ClusterControl, just select the “Deploy” option and follow the instructions that appear. Note that if you already have a PostgreSQL 12 instance running, then you need to select the “Import Existing Server/Database” instead.

Deploy PostgreSQL 12

When selecting PostgreSQL, you must specify User, Key or Password, and port to connect by SSH to your PostgreSQL hosts. You also need the name for your new cluster and if you want ClusterControl to install the corresponding software and configurations for you.

Deploy PostgreSQL 12

Please check the ClusterControl user requirement for this step here.

Deploy PostgreSQL 12

After setting up the SSH access information, you must define the database user, version, and datadir (optional). You can also specify which repository to use. In this case, we want to deploy PostgreSQL 12, so just select it and continue.

In the next step, you need to add your servers to the cluster you’re going to create.

When adding your servers, you can enter IP or hostname.

In the last step, you can choose if your replication will be Synchronous or Asynchronous.

Deploy Postgres 12

You can monitor the status of the creation of your new cluster from the ClusterControl Activity Monitor.

Once the task is finished, you can see your new PostgreSQL 12 cluster in the main ClusterControl screen.

Once you have your cluster created, you can perform several tasks on it, like adding a load balancer (HAProxy, Keepalived) or a new replica, and also different management or monitoring tasks.

PostgreSQL 12 Database Management

As you probably know, using ClusterControl you can perform different management tasks like add/remove load balancers, add/remove slave nodes, automatic fail-over and recovery, backups, create/modify advisors, and even more.

Schedule Maintenance Mode

One of the new ClusterControl management features is the option to schedule maintenance mode for the database cluster. If you need to modify something in your environment or if for some reason you need to schedule a maintenance window, you can set it with ClusterControl.

Go to ClusterControl -> Cluster Actions -> Schedule Maintenance Mode, to enable the maintenance window for all the cluster.

After enabling it, you won’t receive alarms and notifications from this cluster during the specified period.

In case you will work over one specific node, you can enable this maintenance mode just for that node and not for all the cluster by using the “Schedule Maintenance Mode” in the Node Actions section.

PostgreSQL User Management

Now, in the ClusterControl 1.7.5 version, you’ll be able to manage users/roles for your PostgreSQL cluster. Go to ClusterControl -> Select Cluster -> Manage -> User Management.

PostgreSQL GUI User Management

Here you can see all the accounts with the privileges assigned, and you can create a new one, or modify/edit an existing account.

Now, let’s see how to monitor this new PostgreSQL version by using ClusterControl.

PostgreSQL 12 Database Monitoring

Monitoring is a must in all environments, and databases aren’t the exception. If you select your cluster in the ClusterControl main screen, you’ll see an overview of it with some basic metrics.

PostgreSQL 12 Monitoring

But probably this is not enough to see what is happening in your database cluster. So if you go to ClusterControl -> Select your Cluster -> Dashboards, you can enable this agent-based dashboard to monitor your database in more detail.

Once it is enabled, you’ll have detailed information from both the database and the operating system side.

Postgres 12 Monitoring

This dashboard method is useful to see, in a friendly way,  if everything is going fine.

You can also take advantage of the old monitoring features like query monitor, performance, advisors, and more features for PostgreSQL or different database technologies.

Conclusion

PostgreSQL 12 comes with many improvements to query performance and new features. If you’re looking for a quick way to give it a try, ClusterControl can help you to deploy, manage and monitor it in an easy way.

Why Did My MySQL Database Crash? Get Insights with the New MySQL Freeze Frame

$
0
0

In case you haven't seen it, we just released ClusterControl 1.7.5  with major improvements and new useful features. Some of the features include Cluster Wide Maintenance, support for version CentOS 8 and Debian 10, PostgreSQL 12 Support, MongoDB 4.2 and Percona MongoDB v4.0 support, as well as the new MySQL Freeze Frame. 

Wait, but What is a MySQL Freeze Frame? Is This Something New to MySQL? 

Well it's not something new within the MySQL Kernel itself. It's a new feature we added to ClusterControl 1.7.5 that is specific to MySQL databases. The MySQL Freeze Frame in ClusterControl 1.7.5 will cover these following things:

  • Snapshot MySQL status before cluster failure.
  • Snapshot MySQL process list before cluster failure (coming soon).
  • Inspect cluster incidents in operational reports or from the s9s command line tool.

These are valuable sets of information that can help trace bugs and fix your MySQL/MariaDB clusters when things go south. In the future, we are planning to include also snapshots of the SHOW ENGINE InnoDB status values as well. So please stay tuned to our future releases.

Note that this feature is still in beta state, we expect to collect more datasets as we work with our users. In this blog, we will show you how to leverage this feature, especially when you need further information when diagnosing your MySQL/MariaDB cluster.

ClusterControl on Handling Cluster Failure

For cluster failures, ClusterControl does nothing unless Auto Recovery (Cluster/Node) is enabled just like below:

Once enabled, ClusterControl will try to recover a node or recover the cluster by bringing up the entire cluster topology. 

For MySQL, for example in a master-slave replication, it must have at least one master alive at any given time, regardless of the number of available slave/s. ClusterControl attempts to correct the topology at least once for replication clusters, but provides more retries for multi-master replication like NDB Cluster and Galera Cluster. Node recovery attempts to recover a failing database node, e.g. when the process was killed (abnormal shutdown), or the process suffered an OOM (Out-of-Memory). ClusterControl will connect to the node via SSH and try to bring up MySQL. We have previously blogged about How ClusterControl Performs Automatic Database Recovery and Failover, so please visit that article to learn more about the scheme for ClusterControl auto recovery.

In the previous version of ClusterControl < 1.7.5, those attempted recoveries triggered alarms. But one thing our customers missed was a more complete incident report with state information just before the cluster failure. Until we realized this shortfall and  added this feature in ClusterControl 1.7.5. We called it the "MySQL Freeze Frame". The MySQL Freeze Frame, as of this writing, offers a brief summary of incidents leading to cluster state changes just before the crash. Most importantly, it includes at the end of the report the list of hosts and their MySQL Global Status variables and values.

How Does MySQL Freeze Frame Differs With Auto Recovery?

The MySQL Freeze Frame is not part of the auto recovery of ClusterControl. Whether Auto Recovery is disabled or enabled, the MySQL Freeze Frame will always do its work as long as a cluster or node failure has been detected.

How Does MySQL Freeze Frame Work?

In ClusterControl, there are certain states that we classify as different types of Cluster Status. MySQL Freeze Frame will generate an incident report when these two states are triggered:

  • CLUSTER_DEGRADED
  • CLUSTER_FAILURE

In ClusterControl, a CLUSTER_DEGRADED is when you can write to a cluster, but one or more nodes are down. When this happens, ClusterControl will generate the incident report.

For CLUSTER_FAILURE, though its nomenclature explains itself, it is the state where your cluster fails and is no longer able to process reads or writes. Then that is a CLUSTER_FAILURE state. Regardless of whether an auto-recovery process is attempting to fix the problem or whether it's disabled, ClusterControl will generate the incident report.

How Do You Enable MySQL Freeze Frame?

ClusterControl's MySQL Freeze Frame is enabled by default and only generates an incident report only when the states CLUSTER_DEGRADED or CLUSTER_FAILURE are triggered or encountered. So there's no need on the user end to set any ClusterControl configuration setting, ClusterControl will do it for you automagically.

Locating the MySQL Freeze Frame Incident Report

As of this writing, there are 4-ways you can locate the incident report. These can be found by doing the following sections below.

Using the Operational Reports Tab

The Operational Reports from the previous versions are used only to create, schedule, or list the operational reports that have been generated by users. Since version 1.7.5, we included the incident report generated by our MySQL Freeze Frame feature. See the example below:

The checked items or items with Report type == incident_report, are the incident reports generated by MySQL Freeze Frame feature in ClusterControl.

Using Error Reports

By selecting the cluster and generating an error report, i.e. going through this process: <select the cluster> → Logs → Error Reports→ Create Error Report. This will include the incident report under the ClusterControl host.

Using s9s CLI Command Line

On a generated incident report, it does include instructions or hint on how you can use this with s9s CLI command. Below are what's shown in the incident report:

Hint! Using the s9s CLI tool allows you to easily grep data in this report, e.g:

s9s report --list --long

s9s report --cat --report-id=N

So if you want to locate and generate an error report, you can use this approach:

[vagrant@testccnode ~]$ s9s report --list --long --cluster-id=60

ID CID TYPE            CREATED TITLE                            

19  60 incident_report 16:50:27 Incident Report - Cluster Failed

20  60 incident_report 17:01:55 Incident Report

If I want to grep the wsrep_* variables on a specific host, I can do the following:

[vagrant@testccnode ~]$ s9s report --cat --report-id=20 --cluster-id=60|sed -n '/WSREP.*/p'|sed 's/  */ /g'|grep '192.168.10.80'|uniq -d

| WSREP_APPLIER_THREAD_COUNT | 4 | 192.168.10.80:3306 | 2020-01-09 08:50:24 |

| WSREP_CLUSTER_CONF_ID | 18446744073709551615 | 192.168.10.80:3306 | 2020-01-09 08:50:24 |

| WSREP_CLUSTER_SIZE | 1 | 192.168.10.80:3306 | 2020-01-09 08:50:24 |

| WSREP_CLUSTER_STATE_UUID | 7c7a9d08-2d72-11ea-9ef3-a2551fd9f58d | 192.168.10.80:3306 | 2020-01-09 08:50:24 |

| WSREP_EVS_DELAYED | 27ac86a9-3254-11ea-b104-bb705eb13dde:tcp://192.168.10.100:4567:1,9234d567-3253-11ea-92d3-b643c178d325:tcp://192.168.10.90:4567:1,9234d567-3253-11ea-92d4-b643c178d325:tcp://192.168.10.90:4567:1,9e93ad58-3241-11ea-b25e-cfcbda888ea9:tcp://192.168.10.90:4567:1,9e93ad58-3241-11ea-b25f-cfcbda888ea9:tcp://192.168.10.90:4567:1,9e93ad58-3241-11ea-b260-cfcbda888ea9:tcp://192.168.10.90:4567:1,9e93ad58-3241-11ea-b261-cfcbda888ea9:tcp://192.168.10.90:4567:1,9e93ad58-3241-11ea-b262-cfcbda888ea9:tcp://192.168.10.90:4567:1,9e93ad58-3241-11ea-b263-cfcbda888ea9:tcp://192.168.10.90:4567:1,b0b7cb15-3241-11ea-bdbc-1a21deddc100:tcp://192.168.10.100:4567:1,b0b7cb15-3241-11ea-bdbd-1a21deddc100:tcp://192.168.10.100:4567:1,b0b7cb15-3241-11ea-bdbe-1a21deddc100:tcp://192.168.10.100:4567:1,b0b7cb15-3241-11ea-bdbf-1a21deddc100:tcp://192.168.10.100:4567:1,b0b7cb15-3241-11ea-bdc0-1a21deddc100:tcp://192.168.10.100:4567:1,dea553aa-32b9-11ea-b321-9a836d562a47:tcp://192.168.10.100:4567:1,dea553aa-32b9-11ea-b322-9a836d562a47:tcp://192.168.10.100:4567:1,e27f4eff-3256-11ea-a3ab-e298880f3348:tcp://192.168.10.100:4567:1,e27f4eff-3256-11ea-a3ac-e298880f3348:tcp://192.168.10.100:4567:1 | 192.168.10.80:3306 | 2020-01-09 08:50:24 |

| WSREP_GCOMM_UUID | 781facbc-3241-11ea-8a22-d74e5dcf7e08 | 192.168.10.80:3306 | 2020-01-09 08:50:24 |

| WSREP_LAST_COMMITTED | 443 | 192.168.10.80:3306 | 2020-01-09 08:50:24 |

| WSREP_LOCAL_CACHED_DOWNTO | 98 | 192.168.10.80:3306 | 2020-01-09 08:50:24 |

| WSREP_LOCAL_RECV_QUEUE_MAX | 2 | 192.168.10.80:3306 | 2020-01-09 08:50:24 |

| WSREP_LOCAL_STATE_UUID | 7c7a9d08-2d72-11ea-9ef3-a2551fd9f58d | 192.168.10.80:3306 | 2020-01-09 08:50:24 |

| WSREP_PROTOCOL_VERSION | 10 | 192.168.10.80:3306 | 2020-01-09 08:50:24 |

| WSREP_PROVIDER_VERSION | 26.4.3(r4535) | 192.168.10.80:3306 | 2020-01-09 08:50:24 |

| WSREP_RECEIVED | 112 | 192.168.10.80:3306 | 2020-01-09 08:50:24 |

| WSREP_RECEIVED_BYTES | 14413 | 192.168.10.80:3306 | 2020-01-09 08:50:24 |

| WSREP_REPLICATED | 86 | 192.168.10.80:3306 | 2020-01-09 08:50:24 |

| WSREP_REPLICATED_BYTES | 40592 | 192.168.10.80:3306 | 2020-01-09 08:50:24 |

| WSREP_REPL_DATA_BYTES | 31734 | 192.168.10.80:3306 | 2020-01-09 08:50:24 |

| WSREP_REPL_KEYS | 86 | 192.168.10.80:3306 | 2020-01-09 08:50:24 |

| WSREP_REPL_KEYS_BYTES | 2752 | 192.168.10.80:3306 | 2020-01-09 08:50:24 |

| WSREP_ROLLBACKER_THREAD_COUNT | 1 | 192.168.10.80:3306 | 2020-01-09 08:50:24 |

| WSREP_THREAD_COUNT | 5 | 192.168.10.80:3306 | 2020-01-09 08:50:24 |

| WSREP_EVS_REPL_LATENCY | 4.508e-06/4.508e-06/4.508e-06/0/1 | 192.168.10.80:3306 | 2020-01-09 08:50:24 |

Manually Locating via System File Path

ClusterControl generates these incident reports in the host where ClusterControl runs. ClusterControl creates a directory in the/home/<OS_USER>/s9s_tmp or /root/s9s_tmp if you are using the root system user. The incident reports can be located, for example, by going to  /home/vagrant/s9s_tmp/60/galera/cmon-reports/incident_report_2020-01-09_085027.html where the format explains as,  /home/<OS_USER>/s9s_tmp/<CLUSTER_ID>/<CLUSTER_TYPE>/cmon-reports/<INCIDENT_FILE_NAME>.html. The full path of the file is also displayed when you hover your mouse in the item or file you want to check under the Operational Reports Tab just like below:

Are There Any Dangers or Caveats When Using MySQL Freeze Frame?

ClusterControl does not change nor modify anything in your MySQL nodes or cluster. MySQL Freeze Frame will just read SHOW GLOBAL STATUS (as of this time) at specific intervals to save records since we cannot predict the state of a MySQL node or cluster when it can crash or when it can have hardware or disk issues. It's not possible to predict this, so we save the values and therefore we can generate an incident report in case a particular node goes down. In that case, the danger of having this is close to none. It can theoretically add a series of client requests to the server(s) in case some locks are held within MySQL, but we have not noticed it yet.The series of tests doesn't show this so we would be glad if you can let us know or file a support ticket in case problems arise.

There are certain situations where an incident report might not be able to gather global status variables if a network issue was the problem prior to ClusterControl freezing a specific frame to gather data. That's completely reasonable because there's no way ClusterControl can collect data for further diagnosis as there's no connection to the node in the first place.

Lastly, you might wonder why not all variables are shown in the GLOBAL STATUS section? For the meantime, we set a filter where empty or 0 values are excluded in the incident report. The reason is that we want to save some disk space. Once these incident reports are no longer needed, you can delete it via Operational Reports Tab.

Testing the MySQL Freeze Frame Feature

We believe that you are eager to try this one and see how it works. But please, make sure you are not running or testing this in a live or production environment. We'll cover 2-phases of scenario in the MySQL/MariaDB, one for master-slave setup and one for Galera-type setup.

Master-Slave Setup Test Scenario

In a master-slave(s) setup, it's easy and simple to try. 

Step One

Make sure that you have disabled the Auto Recovery modes (Cluster and Node), like below:

so it won't try or attempt to fix the test scenario.

Step Two

Go to your Master node and try setting to read-only:

root@node1[mysql]> set @@global.read_only=1;

Query OK, 0 rows affected (0.000 sec)

Step Three

This time, an alarm was raised and so a generated incident report. See below how does my cluster looks like:

and the alarm was triggered:

and the incident report was generated:

Galera Cluster Setup Test Scenario

For Galera-based setup, we need to make sure that the cluster will be no longer available, i.e., a cluster-wide failure. Unlike the Master-Slave test, you can let Auto Recovery enabled since we'll play around with network interfaces.

Note: For this setup, ensure that you have multiple interfaces if you are testing the nodes in a remote instance since you cannot bring the interface up when you down that interface where you are connected.

Step One

Create a 3-node Galera cluster (for example using vagrant)

Step Two

Issue the command (just like below) to simulate network issue and do this to all the nodes

[root@testnode10 ~]# ifdown eth1

Device 'eth1' successfully disconnected.

Step Three

Now, it took my cluster down and have this state:

raised an alarm,

and it generates an incident report:

For a sample incident report, you can use this raw file and save it as html.

It's quite simple to try but again, please do this only in a non-live and non-prod environment.

Conclusion

MySQL Freeze Frame in ClusterControl can be helpful when diagnosing crashes. When troubleshooting, you need a wealth of information in order to determine cause and that is exactly what MySQL Freeze Frame provides.

MongoDB 4.2 Management & Monitoring Without Vendor Lockin

$
0
0

With the release of a new version of ClusterControl (1.7.5), we can see several new features, one of the main ones being the support for MongoDB 4.2.

MongoDB 4.2 is on the market for a while. It was initially announced at MongoDB World in June 2019, with GA ready in August. Since then, a lot of you have been putting it through its paces. It brings many awaited features, which makes NoSQL a more straightforward choice over RDBMS.

The most significant feature in 4.X was transaction support. It dramatically reduces the gap between RDBMS and NoSQL systems. MongoDB transactions were added in version 4.0, but that didn't work with the most powerful feature of MongoDB clusters. Now MongoDB extends multi-document ACID, which is now guaranteed from the replica set to sharded clusters, enabling you to serve an even broader range of use cases.

The most prominent features of version 4.2 are:

  • On-Demand Materialized Views using the new $merge operator. 
  • Distributed transactions
  • Wildcard Indexes
  • Server-side updates 
  • MongoDB Query Language enhancements
  • Field-level encryption to selectively protect sensitive files

To install MongoDB 4.2 manually, we must first add the repositories or download the necessary packages for the installation, install them, and configure them correctly, depending on our infrastructure. All these steps take time, so let's see how we could speed it up.

In this blog, we will see how to deploy this new MongoDB version with a few clicks using ClusterControl and how to manage it. As a prerequisite, please install the 1.7.5 version of ClusterControl on a dedicated host or VM.

Deploying a MongoDB 4.2 Replica Shard

To perform a new installation from ClusterControl, select the option "Deploy" and follow the instructions that appear. Note that if you already have a MongoDB 4.2 instance running, then you need to choose the 'Import Existing Server/Database' instead.

Deploy MongoDB 4.2

ClusterControl Deployment Options

When selecting MongoDB, we must specify User, Key or Password and port to connect by SSH to our MongoDB nodes. We also need the name for our new cluster and if we want ClusterControl to install the corresponding software and configurations for us.

After setting up the SSH access information, we must define the database user, version, and datadir (optional). We can also specify which repository to use. In this case, we want to deploy MongoDB 4.2, so select it and continue.

In the next step, we need to add our servers to the cluster we are going to create.

ClusterControl Percona 4.2 MongoDB Deployment

When adding our servers, we can enter IP or hostname.

ClusterControl MongoDB 4.2 Deployment

We can monitor the status of the creation of our new cluster from the ClusterControl activity monitor.

ClusterControl Job Details

Once the task is finished, we can see our new MongoDB replicaSet in the main ClusterControl screen.

ClusterContorol Dashboard Status

Once we have our cluster created, we can perform several tasks on it, like adding a backup job

Scaling MongoDB 4.2 

If we go to cluster actions and select "Add  Node", we can either create a new replica from scratch or add an existing MongoDB database as a replica.

ClusterControl MongoDB 4.2 Add a Node

As you can see in the image, we only need to choose our new or existing server, enter the IP address for our new slave server and the database port. Then, we can choose if we want ClusterControl to install the software for us and configure cluster.

The other option is to convert replica set clusters to MongoDB shard. CusterControl will walk you through the process. We need to provide details about Configuration Server and Routers as you can see on the below screen.  

ClusterControl Convert MongoDB 4.2 ReplicaSet to Shard

Conclusion

As we have seen above, you can now deploy the latest MongoDB (version 4.2) using ClusterControl. Once deployed, ClusterControl provides a whole range of features, from monitoring, alerting, automatic failover, backup, point-in-time recovery, backup verification, to scaling of reading replicas.

Rebuilding a MySQL 8.0 Replication Slave Using a Clone Plugin

$
0
0

With MySQL 8.0 Oracle adopted a new approach to development. Instead of pushing features with major versions, almost every minor MySQL 8.0 version comes with new features or improvements. One of these new features is what we would like to focus on in this blog post. 

Historically MySQL did not come with good tools for provisioning. Sure, you had mysqldump, but it is just a logical backup tool, not really suitable for larger environments. MySQL enterprise users could benefit from MySQL Enterprise Backup while community users could use xtrabackup. Neither of those came with a clean MySQL Community deployments though. It was quite annoying as provisioning is a task you do quite often. You may need to build a new slave, rebuild a failed one - all of this will require some sort of a data transfer between separate nodes.

MySQL 8.0.17 introduced a new way of provisioning MySQL data - clone plugin. It was intended with MySQL Group Replication in mind to introduce a way of automatic provisioning and rebuilding of failed nodes, but its usefulness is not limited to that area. We can as well use it to rebuild a slave node or provision a new server. In this blog post we would like to show you how to set up MySQL Clone plugin and how to rebuild a replication slave.

First of all, the plugin has to be enabled as it is disabled by default. Once you do this, it will stay enabled through restarts. Ideally, you will do it on all of the nodes in the replication topology.

mysql> INSTALL PLUGIN clone SONAME 'mysql_clone.so';

Query OK, 0 rows affected (0.00 sec)

Clone plugin requires MySQL user with proper privileges. On donor it has to have “BACKUP_ADMIN” privilege while on the joiner it has to have “CLONE_ADMIN” privilege. Assuming you want to use the clone plugin extensively, you can just create user with both privileges. Do it on the master so the user will be created also on all of the slaves. After all, you never know which node will be a master some time in the future therefore it’s more convenient to have everything prepared upfront.

mysql> CREATE USER clone_user@'%' IDENTIFIED BY 'clonepass';

Query OK, 0 rows affected (0.01 sec)

mysql> GRANT BACKUP_ADMIN, CLONE_ADMIN ON *.* to clone_user@'%';

Query OK, 0 rows affected (0.00 sec)

MySQL Clone plugin has some prerequisites thus sanity checks should be performed. You should ensure that both donor and joiner will have the same values in the following configuration variables:

mysql> SHOW VARIABLES LIKE 'innodb_page_size';

+------------------+-------+

| Variable_name    | Value |

+------------------+-------+

| innodb_page_size | 16384 |

+------------------+-------+

1 row in set (0.01 sec)

mysql> SHOW VARIABLES LIKE 'innodb_data_file_path';

+-----------------------+-------------------------+

| Variable_name         | Value   |

+-----------------------+-------------------------+

| innodb_data_file_path | ibdata1:100M:autoextend |

+-----------------------+-------------------------+

1 row in set (0.01 sec)

mysql> SHOW VARIABLES LIKE 'max_allowed_packet';

+--------------------+-----------+

| Variable_name      | Value |

+--------------------+-----------+

| max_allowed_packet | 536870912 |

+--------------------+-----------+

1 row in set (0.00 sec)

mysql> SHOW GLOBAL VARIABLES LIKE '%character%';

+--------------------------+--------------------------------+

| Variable_name            | Value       |

+--------------------------+--------------------------------+

| character_set_client     | utf8mb4       |

| character_set_connection | utf8mb4                        |

| character_set_database   | utf8mb4       |

| character_set_filesystem | binary                         |

| character_set_results    | utf8mb4       |

| character_set_server     | utf8mb4       |

| character_set_system     | utf8       |

| character_sets_dir       | /usr/share/mysql-8.0/charsets/ |

+--------------------------+--------------------------------+

8 rows in set (0.00 sec)


mysql> SHOW GLOBAL VARIABLES LIKE '%collation%';

+-------------------------------+--------------------+

| Variable_name                 | Value |

+-------------------------------+--------------------+

| collation_connection          | utf8mb4_0900_ai_ci |

| collation_database            | utf8mb4_0900_ai_ci |

| collation_server              | utf8mb4_0900_ai_ci |

| default_collation_for_utf8mb4 | utf8mb4_0900_ai_ci |

+-------------------------------+--------------------+

4 rows in set (0.00 sec)

Then, on the master, we should double-check that undo tablespaces have unique names:

mysql> SELECT TABLESPACE_NAME, FILE_NAME FROM INFORMATION_SCHEMA.FILES

    ->        WHERE FILE_TYPE LIKE 'UNDO LOG';

+-----------------+------------+

| TABLESPACE_NAME | FILE_NAME  |

+-----------------+------------+

| innodb_undo_001 | ./undo_001 |

| innodb_undo_002 | ./undo_002 |

+-----------------+------------+

2 rows in set (0.12 sec)

Default verbosity level does not show too much data regarding cloning process therefore we would recommend to increase it to have better insight into what is happening:

mysql> SET GLOBAL log_error_verbosity=3;

Query OK, 0 rows affected (0.00 sec)

To be able to start the process on our joiner, we have to configure a valid donor:

mysql> SET GLOBAL clone_valid_donor_list ='10.0.0.101:3306';

Query OK, 0 rows affected (0.00 sec)

mysql> SHOW VARIABLES LIKE 'clone_valid_donor_list';

+------------------------+-----------------+

| Variable_name          | Value |

+------------------------+-----------------+

| clone_valid_donor_list | 10.0.0.101:3306 |

+------------------------+-----------------+

1 row in set (0.00 sec)

Once it is in place, we can use it to copy the data from:

mysql> CLONE INSTANCE FROM 'clone_user'@'10.0.0.101':3306 IDENTIFIED BY 'clonepass';

Query OK, 0 rows affected (18.30 sec)

That’s it, the progress can be tracked in the MySQL error log on the joiner. Once everything is ready, all you have to do is to setup the replication:

mysql> CHANGE MASTER TO MASTER_HOST='10.0.0.101', MASTER_AUTO_POSITION=1;

Query OK, 0 rows affected (0.05 sec)

mysql> START SLAVE USER='rpl_user' PASSWORD='afXGK2Wk8l';

Query OK, 0 rows affected, 1 warning (0.01 sec)

Please keep in mind that Clone plugin comes with a set of limitations. For starters, it transfers only InnoDB tables so if you happen to use any other storage engines, you would have to either convert them to InnoDB or use another provisioning method. It also interferes with Data Definition Language - ALTERs will block and be blocked by cloning operations.

By default cloning is not encrypted so it could be used only in a secure environment. If needed, you can set up SSL encryption for the cloning process by ensuring that the donor has SSL configured and then define following variables on the joiner:

clone_ssl_ca=/path/to/ca.pem

clone_ssl_cert=/path/to/client-cert.pem

clone_ssl_key=/path/to/client-key.pem

Then, you need to add “REQUIRE SSL;” at the end of the CLONE command and the process will be executed with SSL encryption. Please keep in mind this is the only method to clone databases with data-at-rest encryption enabled.

As we mentioned at the beginning, cloning was, most likely, designed with MySQL Group Replication/InnoDB Cluster in mind but, as long as the limitations are not affecting particular use case, it can be used as a native way of provisioning any MySQL instance. We will see how broad of adoption it will have - possibilities are numerous. What’s already great is we now have another hardware-agnostic method we can use to provision servers in addition to Xtrabackup. Competition is always good and we are looking forward to see what the future holds.


Moving from MySQL 5.7 to MySQL 8.0 - What You Should Know

$
0
0

April 2018 is not just a date for the MySQL world. MySQL 8.0 was released there, and more than 1 year after, it’s probably time to consider migrating to this new version.

MySQL 8.0 has important performance and security improvements, and, as in all migration to a new database version, there are several things to take into account before going into production to avoid hard issues like data loss, excessive downtime, or even a rollback during the migration task.

In this blog, we’ll mention some of the new MySQL 8.0 features, some deprecated stuff, and what you need to keep in mind before migrating.

What’s New in MySQL 8.0?

Let’s now summarize some of the most important features mentioned in the official documentation for this new MySQL version.

  • MySQL incorporates a transactional data dictionary that stores information about database objects.
  • An atomic DDL statement combines the data dictionary updates, storage engine operations, and binary log writes associated with a DDL operation into a single, atomic transaction.
  • The MySQL server automatically performs all necessary upgrade tasks at the next startup to upgrade the system tables in the mysql schema, as well as objects in other schemas such as the sys schema and user schemas. It is not necessary for the DBA to invoke mysql_upgrade.
  • It supports the creation and management of resource groups, and permits assigning threads running within the server to particular groups so that threads execute according to the resources available to the group. 
  • Table encryption can now be managed globally by defining and enforcing encryption defaults. The default_table_encryption variable defines an encryption default for newly created schemas and general tablespace. Encryption defaults are enforced by enabling the table_encryption_privilege_check variable. 
  • The default character set has changed from latin1 to utf8mb4.
  • It supports the use of expressions as default values in data type specifications. This includes the use of expressions as default values for the BLOB, TEXT, GEOMETRY, and JSON data types.
  • Error logging was rewritten to use the MySQL component architecture. Traditional error logging is implemented using built-in components, and logging using the system log is implemented as a loadable component.
  • A new type of backup lock permits DML during an online backup while preventing operations that could result in an inconsistent snapshot. The new backup lock is supported by LOCK INSTANCE FOR BACKUP and UNLOCK INSTANCE syntax. The BACKUP_ADMIN privilege is required to use these statements.
  • MySQL Server now permits a TCP/IP port to be configured specifically for administrative connections. This provides an alternative to the single administrative connection that is permitted on the network interfaces used for ordinary connections even when max_connections connections are already established.
  • It supports invisible indexes. This index is not used by the optimizer and makes it possible to test the effect of removing an index on query performance, without removing it.
  • Document Store for developing both SQL and NoSQL document applications using a single database.
  • MySQL 8.0 makes it possible to persist global, dynamic server variables using the SET PERSIST command instead of the usual SET GLOBAL one. 

MySQL Security and Account Management

As there are many improvements related to security and user management, we'll list them in a separate section.

  • The grant tables in the mysql system database are now InnoDB tables. 
  • The new caching_sha2_password authentication plugin is now the default authentication method in MySQL 8.0. It implements SHA-256 password hashing, but uses caching to address latency issues at connect time. It provides more secure password encryption than the mysql_native_password plugin, and provides better performance than sha256_password.
  • MySQL now supports roles, which are named collections of privileges. Roles can have privileges granted to and revoked from them, and they can be granted to and revoked from user accounts. 
  • MySQL now maintains information about password history, enabling restrictions on reuse of previous passwords. 
  • It enables administrators to configure user accounts such that too many consecutive login failures due to incorrect passwords cause temporary account locking. 

InnoDB enhancements

As the previous point, there are also many improvements related to this topic, so we'll list them in a separate section too.

  • The current maximum auto-increment counter value is written to the redo log each time the value changes, and saved to an engine-private system table on each checkpoint. These changes make the current maximum auto-increment counter value persistent across server restarts
  • When encountering index tree corruption, InnoDB writes a corruption flag to the redo log, which makes the corruption flag crash-safe. InnoDB also writes in-memory corruption flag data to an engine-private system table on each checkpoint. During recovery, InnoDB reads corruption flags from both locations and merges results before marking in-memory table and index objects as corrupt.
  • A new dynamic variable, innodb_deadlock_detect, may be used to disable deadlock detection. On high concurrency systems, deadlock detection can cause a slowdown when numerous threads wait for the same lock. At times, it may be more efficient to disable deadlock detection and rely on the innodb_lock_wait_timeout setting for transaction rollback when a deadlock occurs.
  • InnoDB temporary tables are now created in the shared temporary tablespace, ibtmp1.
  • mysql system tables and data dictionary tables are now created in a single InnoDB tablespace file named mysql.ibd in the MySQL data directory. Previously, these tables were created in individual InnoDB tablespace files in the mysql database directory.
  • By default, undo logs now reside in two undo tablespaces that are created when the MySQL instance is initialized. Undo logs are no longer created in the system tablespace.
  • The new innodb_dedicated_server variable, which is disabled by default, can be used to have InnoDB automatically configure the following options according to the amount of memory detected on the server: innodb_buffer_pool_size, innodb_log_file_size, and innodb_flush_method. This option is intended for MySQL server instances that run on a dedicated server. 
  • Tablespace files can be moved or restored to a new location while the server is offline using the innodb_directories option. 

Now, let’s take a look at some of the features that you shouldn’t use anymore in this new MySQL version.

What is Deprecated in MySQL 8.0?

The following features are deprecated and will be removed in a future version.

  • The utf8mb3 character set is deprecated. Please use utf8mb4 instead.
  • Because caching_sha2_password is the default authentication plugin in MySQL 8.0 and provides a superset of the capabilities of the sha256_password authentication plugin, sha256_password is deprecated.
  • The validate_password plugin has been reimplemented to use the server component infrastructure. The plugin form of validate_password is still available but is deprecated.
  • The ENGINE clause for the ALTER TABLESPACE and DROP TABLESPACE statements.
  • The PAD_CHAR_TO_FULL_LENGTH SQL mode.
  • AUTO_INCREMENT support is deprecated for columns of type FLOAT and DOUBLE (and any synonyms). Consider removing the AUTO_INCREMENT attribute from such columns, or convert them to an integer type.
  • The UNSIGNED attribute is deprecated for columns of type FLOAT, DOUBLE, and DECIMAL (and any synonyms). Consider using a simple CHECK constraint instead for such columns.
  • FLOAT(M,D) and DOUBLE(M,D) syntax to specify the number of digits for columns of type FLOAT and DOUBLE (and any synonyms) is a nonstandard MySQL extension. This syntax is deprecated.
  • The nonstandard C-style &&, ||, and ! operators that are synonyms for the standard SQL AND, OR, and NOT operators, respectively, are deprecated. Applications that use the nonstandard operators should be adjusted to use the standard operators.
  • The mysql_upgrade client is deprecated because its capabilities for upgrading the system tables in the mysql system schema and objects in other schemas have been moved into the MySQL server.
  • The mysql_upgrade_info file, which is created data directory and used to store the MySQL version number.
  • The relay_log_info_file system variable and --master-info-file option are deprecated. Previously, these were used to specify the name of the relay log info log and master info log when relay_log_info_repository=FILE and master_info_repository=FILE were set, but those settings have been deprecated. The use of files for the relay log info log and master info log has been superseded by crash-safe slave tables, which are the default in MySQL 8.0.
  • The use of the MYSQL_PWD environment variable to specify a MySQL password is deprecated.

And now, let’s take a look at some of the features that you must stop using in this MySQL version.

What Was Removed in MySQL 8.0?

The following features have been removed in MySQL 8.0.

  • The innodb_locks_unsafe_for_binlog system variable was removed. The READ COMMITTED isolation level provides similar functionality.
  • Using GRANT to create users. Instead, use CREATE USER. Following this practice makes the NO_AUTO_CREATE_USER SQL mode immaterial for GRANT statements, so it too is removed, and an error now is written to the server log when the presence of this value for the sql_mode option in the options file prevents mysqld from starting.
  • Using GRANT to modify account properties other than privilege assignments. This includes authentication, SSL, and resource-limit properties. Instead, establish such properties at account-creation time with CREATE USER or modify them afterward with ALTER USER.
  • IDENTIFIED BY PASSWORD 'auth_string' syntax for CREATE USER and GRANT. Instead, use IDENTIFIED WITH auth_plugin AS 'auth_string' for CREATE USER and ALTER USER, where the 'auth_string' value is in a format compatible with the named plugin. 
  • The PASSWORD() function. Additionally, PASSWORD() removal means that SET PASSWORD ... = PASSWORD('auth_string') syntax is no longer available.
  • The old_passwords system variable.
  • The FLUSH QUERY CACHE and RESET QUERY CACHE statements.
  • These system variables: query_cache_limit, query_cache_min_res_unit, query_cache_size, query_cache_type, query_cache_wlock_invalidate.
  • These status variables: Qcache_free_blocks, Qcache_free_memory, Qcache_hits, Qcache_inserts, Qcache_lowmem_prunes, Qcache_not_cached, Qcache_queries_in_cache, Qcache_total_blocks.
  • These thread states: checking privileges on cached query, checking query cache for a query, invalidating query cache entries, sending cached result to the client, storing result in the query cache, Waiting for query cache lock.
  • The tx_isolation and tx_read_only system variables have been removed. Use transaction_isolation and transaction_read_only instead.
  • The sync_frm system variable has been removed because .frm files have become obsolete.
  • The secure_auth system variable and --secure-auth client option have been removed. The MYSQL_SECURE_AUTH option for the mysql_options() C API function was removed.
  • The log_warnings system variable and --log-warnings server option have been removed. Use the log_error_verbosity system variable instead.
  • The global scope for the sql_log_bin system variable was removed. sql_log_bin has session scope only, and applications that rely on accessing @@GLOBAL.sql_log_bin should be adjusted.
  • The unused date_format, datetime_format, time_format, and max_tmp_tables system variables are removed.
  • The deprecated ASC or DESC qualifiers for GROUP BY clauses are removed. Queries that previously relied on GROUP BY sorting may produce results that differ from previous MySQL versions. To produce a given sort order, provide an ORDER BY clause.
  • The parser no longer treats \N as a synonym for NULL in SQL statements. Use NULL instead. This change does not affect text file import or export operations performed with LOAD DATA or SELECT ... INTO OUTFILE, for which NULL continues to be represented by \N. 
  • The client-side --ssl and --ssl-verify-server-cert options have been removed. Use --ssl-mode=REQUIRED instead of --ssl=1 or --enable-ssl. Use --ssl-mode=DISABLED instead of --ssl=0, --skip-ssl, or --disable-ssl. Use --ssl-mode=VERIFY_IDENTITY instead of --ssl-verify-server-cert options.
  • The mysql_install_db program has been removed from MySQL distributions. Data directory initialization should be performed by invoking mysqld with the --initialize or --initialize-insecure option instead. In addition, the --bootstrap option for mysqld that was used by mysql_install_db was removed, and the INSTALL_SCRIPTDIR CMake option that controlled the installation location for mysql_install_db was removed.
  • The mysql_plugin utility was removed. Alternatives include loading plugins at server startup using the --plugin-load or --plugin-load-add option, or at runtime using the INSTALL PLUGIN statement.
  • The resolveip utility is removed. nslookup, host, or dig can be used instead.

There are a lot of new, deprecated, and removed features. You can check the official website for more detailed information.

Considerations Before Migrating to MySQL 8.0

Let’s mention now some of the most important things to consider before migrating to this MySQL version.

Authentication Method

As we mentioned, caching_sha2_password is not the default authentication method, so you should check if your application/connector supports it. If not, let’s see how you can change the default authentication method and the user authentication plugin to ‘mysql_native_password’ again.

To change the default  authentication method, edit the my.cnf configuration file, and add/edit the following line:

$ vi /etc/my.cnf

[mysqld]

default_authentication_plugin=mysql_native_password

To change the user authentication plugin, run the following command with a privileged user:

$ mysql -p

ALTER USER ‘username’@’hostname’ IDENTIFIED WITH ‘mysql_native_password’ BY ‘password’;

Anyway, these changes aren’t a permanent solution as the old authentication could be deprecated soon, so you should take it into account for a future database upgrade.

Also the roles are an important feature here. You can reduce the individual privileges assigning it to a role and adding the corresponding users there. 

For example, you can create a new role for the marketing and the developers teams:

$ mysql -p

CREATE ROLE 'marketing', 'developers';

Assign privileges to these new roles:

GRANT SELECT ON *.* TO 'marketing';

GRANT ALL PRIVILEGES ON *.* TO 'developers';

And then, assign the role to the users:

GRANT 'marketing' TO 'marketing1'@'%';

GRANT 'marketing' TO 'marketing2'@'%';

GRANT 'developers' TO 'developer1'@'%';

And that’s it. You’ll have the following privileges:

SHOW GRANTS FOR 'marketing1'@'%';

+-------------------------------------------+

| Grants for marketing1@%                   |

+-------------------------------------------+

| GRANT USAGE ON *.* TO `marketing1`@`%`    |

| GRANT `marketing`@`%` TO `marketing1`@`%` |

+-------------------------------------------+

2 rows in set (0.00 sec)

SHOW GRANTS FOR 'marketing';

+----------------------------------------+

| Grants for marketing@%                 |

+----------------------------------------+

| GRANT SELECT ON *.* TO `marketing`@`%` |

+----------------------------------------+

1 row in set (0.00 sec)

Character Sets

As the new default character set is utf8mb4, you should make sure you’re not using the default one as it’ll change.

To avoid some issues, you should specify the character_set_server and the collation_server variables in the my.cnf configuration file.

$ vi /etc/my.cnf

[mysqld]

character_set_server=latin1

collation_server=latin1_swedish_ci

MyISAM Engine

The MySQL privilege tables in the MySQL schema are moved to InnoDB. You can create a table engine=MyISAM, and it will work as before, but coping a MyISAM table into a running MySQL server will not work because it will not be discovered.

Partitioning

There must be no partitioned tables that use a storage engine that does not have native partitioning support. You can run the following query to verify this point.

$ mysql -p

SELECT TABLE_SCHEMA, TABLE_NAME FROM INFORMATION_SCHEMA.TABLES WHERE ENGINE NOT IN ('innodb', 'ndbcluster') AND CREATE_OPTIONS LIKE '%partitioned%';

If you need to change the engine of a table, you can run:

ALTER TABLE table_name ENGINE = INNODB;

Upgrade Check

As a last step, you can run the mysqlcheck command using the check-upgrade flag to confirm if everything looks fine.

$ mysqlcheck -uroot -p --all-databases --check-upgrade

Enter password:

mysql.columns_priv                                 OK

mysql.component                                    OK

mysql.db                                           OK

mysql.default_roles                                OK

mysql.engine_cost                                  OK

mysql.func                                         OK

mysql.general_log                                  OK

mysql.global_grants                                OK

mysql.gtid_executed                                OK

mysql.help_category                                OK

mysql.help_keyword                                 OK

mysql.help_relation                                OK

mysql.help_topic                                   OK

mysql.innodb_index_stats                           OK

mysql.innodb_table_stats                           OK

mysql.password_history                             OK

mysql.plugin                                       OK

mysql.procs_priv                                   OK

mysql.proxies_priv                                 OK

mysql.role_edges                                   OK

mysql.server_cost                                  OK

mysql.servers                                      OK

mysql.slave_master_info                            OK

mysql.slave_relay_log_info                         OK

mysql.slave_worker_info                            OK

mysql.slow_log                                     OK

mysql.tables_priv                                  OK

mysql.time_zone                                    OK

mysql.time_zone_leap_second                        OK

mysql.time_zone_name                               OK

mysql.time_zone_transition                         OK

mysql.time_zone_transition_type                    OK

mysql.user                                         OK

sys.sys_config                                     OK

world_x.city                                       OK

world_x.country                                    OK

world_x.countryinfo                                OK

world_x.countrylanguage                            OK

There are several things to check before performing the upgrade. You can check the official MySQL documentation for more detailed information.

Upgrade Methods

There are different ways to upgrade MySQL 5.7 to 8.0. You can use the upgrade in-place or even create a replication slave in the new version, so you can promote it later. 

But before upgrading, step 0 must be backing up your data. The backup should include all the databases including the system databases. So, if there is any issue, you can rollback asap. 

Another option, depending on the available resources, can be creating a cascade replication MySQL 5.7 -> MySQL 8.0 -> MySQL 5.7, so after promoting the new version, if something went wrong, you can promote the slave node with the old version back. But it could be dangerous if there was some issue with the data, so the backup is a must before it.

For any method to be used, it’s necessary a test environment to verify that the application is working without any issue using the new MySQL 8.0 version.

Conclusion

More than 1 year after the MySQL 8.0 release, it is time to start thinking to migrate your old MySQL version, but luckily, as the end of support for MySQL 5.7 is 2023, you have time to create a migration plan and test the application behavior with no rush. Spending some time in that testing step is necessary to avoid any issue after migrating it.


Using PostgreSQL Replication Slots

$
0
0

What are Replication Slots?

Back in the days when "Replication Slots" were not yet introduced, managing the WAL segments were a challenge. In standard streaming replication, the master has no knowledge of the slave status.  Take the example of a master that executes a large transaction, while a standby node is in maintenance mode for a couple of hours (such as upgrading the system packages, adjusting network security, hardware upgrade, etc.). At some point, the master removes its transaction log (WAL segments) as checkpoint passes. Once the slave is off maintenance, it possibly has a huge slave lag and has to catch up with the master. Eventually, the slave will get a fatal issue like below:

LOG:  started streaming WAL from primary at 0/73000000 on timeline 1

FATAL:  could not receive data from WAL stream: ERROR:  requested WAL segment 000000010000000000000073 has already been removed

The typical approach is to specify in your postgresql.conf a WAL archival script that will copy WAL files to one or more long-term archive locations. If you don’t have any standbys or other streaming replication clients, then basically the server can discard the WAL file once the archive script is done or responds OK. But you’ll still need some recent WAL files for crash recovery (data from recent WAL files get replayed during crash recovery. In our example of a standby node which is placed for a long maintenance period, problems arise when it comes back online and asks the primary for a WAL file that the primary no longer has, then the replication fails.

This problem was addressed in PostgreSQL 9.4 via "Replication Slots".

If not using replication slots, a common way to reduce the risk of failing replication is to set the wal_keep_segments high enough so that WAL files that might be needed won't be rotated or recycled. The disadvantage of this approach is that it's hard to determine what value is best for your setup. You won't need maintenance on a daily basis or you won't need to retain a large pile of WAL files that eats your disk storage. While this works, it's not an ideal solution as risking disk space on the master can cause incoming transactions to fail.

Alternative approaches of not using replication slots is to configure PostgreSQL with continuous archiving and provide a restore_command to give the replica access to the archive. To avoid WAL build-up on the primary, you may use a separate volume or storage device for the WAL files, e.g., SAN or NFS. Another thing is with synchronous replication since it requires that primary has to wait for standby nodes to commit transaction. This means, it assures that WAL files have been applied to the standby nodes. But still, it's best that you provide archiving commands from the primary so that once WAL's are recycled in the primary, rest assured that you have WAL backups in case for recovery. Although in some situations, synchronous replication is not an ideal solution as it comes with some performance overhead as compared with asynchronous replication.

Types of Replication Slots

There are two types of replication slots. These are:

Physical Replication Slots 

Can be used for standard streaming replication. They will make sure that data is not recycled too early. 

Logical Replication Slots

Logical replication does the same thing as physical replication slots and are used for logical replication. However, they are used for logical decoding. The idea behind logical decoding is to give users a chance to attach to the transaction log and decode it with a plugin. It allows to extract changes made to the database and therefore to the transaction log in any format and for any purpose.

In this blog, we'll be using physical replication slots and how to achieve this using ClusterControl.

Advantages and Disadvantages of Using Replication Slots

Replications slots are definitely beneficial once enabled. By default, "Replication Slots" are not enabled and have to be set  manually. Among the advantages of using Replication Slots are

  • Ensures master retains enough WAL segments for all replicas to receive them
  • Prevents the master from removing rows that could cause recovery conflict on the replicas
  • A master can only recycle the transaction log once it has been consumed by all replicas. The advantage here is that a slave can never fall behind so much that a re-sync is needed.

Replication slots also come with some caveats.

  • An orphan replication slot can cause unbounded disk growth due to piled up WAL files from the master
  • Slave nodes placed under long maintenance (such as days or weeks) and that are tied to a replication slot will have unbounded disk growth due to piled up WAL files from the master

You can monitor this by querying pg_replication_slots to determine the slots that are not used. We'll check back on this a bit later.

Using Replication Slots 

As stated earlier, there are two types of replication slots. For this blog, we'll use physical replication slots for streaming replication.

Creating A Replication Slot

Creating a replication is simple. You need to invoke the existing function pg_create_physical_replication_slot to do this and has to be run and created in the master node. The function is simple,

maximus_db=# \df pg_create_physical_replication_slot

Schema              | pg_catalog

Name                | pg_create_physical_replication_slot

Result data type    | record

Argument data types | slot_name name, immediately_reserve boolean DEFAULT false, OUT slot_name name, OUT xlog_position pg_lsn

Type                | normal

e.g. Creating a replication slot named slot1,

postgres=# SELECT pg_create_physical_replication_slot('slot1');

-[ RECORD 1 ]-----------------------+---------

pg_create_physical_replication_slot | (slot1,)

The replication slot names and its underlying configuration is only system-wide and not cluster-wide. For example, if you have nodeA (current master), and standby nodes nodeB and nodeC, creating the slot on a master nodeA namely "slot1", then data will not be available to nodeB and nodeC. Therefore, when failover/switchover is about to happen, you need to re-create the slots you have created.

Dropping A Replication Slot

Unused replication slots have to be dropped or deleted. As stated earlier, when there are orphaned replication slots or slots that have not been assigned to any client or standby nodes, it can lead to boundless disk space issues if left undropped. So it is very important that these have to be dropped when it's no longer use. To drop it, simply invoke pg_drop_replication_slot. This function has the following definition:

maximus_db=# \df pg_drop_replication_slot

Schema              | pg_catalog

Name                | pg_drop_replication_slot

Result data type    | void

Argument data types | name

Type                | normal

Dropping it is simple:

maximus_db=# select pg_drop_replication_slot('slot2');

-[ RECORD 1 ]------------+-

pg_drop_replication_slot |

Monitoring Your PostgreSQL Replication Slots

Monitoring your replication slots is something that you don't want to miss. Just collect the information from view pg_replication_slots in the primary/master node just like below:

postgres=# select * from pg_replication_slots;

-[ RECORD 1 ]-------+-----------

slot_name           | main_slot

plugin              |

slot_type           | physical

datoid              |

database            |

active              | t

active_pid          | 16297

xmin                |

catalog_xmin        |

restart_lsn         | 2/F4000108

confirmed_flush_lsn |

-[ RECORD 2 ]-------+-----------

slot_name           | main_slot2

plugin              |

slot_type           | physical

datoid              |

database            |

active              | f

active_pid          |

xmin                |

catalog_xmin        |

restart_lsn         |

confirmed_flush_lsn |

The above result shows that the main_slot has been taken, but not main_slot2.

Another thing you can do is to monitor how much lag behind the slots you have. To achieve this, you can simply use the query based on the sample result below:

postgres=# SELECT redo_lsn, slot_name,restart_lsn, 

round((redo_lsn-restart_lsn) / 1024 / 1024 / 1024, 2) AS GB_behind 

FROM pg_control_checkpoint(), pg_replication_slots;

redo_lsn    | slot_name | restart_lsn | gb_behind 

------------+-----------+-------------+-----------

 1/8D400238 |     slot1 | 0/9A000000 | 3.80

But redo_lsn is not present in 9.6, shall use redo_location, so in 9.6,

imbd=# SELECT redo_location, slot_name,restart_lsn, 

round((redo_location-restart_lsn) / 1024 / 1024 / 1024, 2) AS GB_behind 

FROM pg_control_checkpoint(), pg_replication_slots;

-[ RECORD 1 ]-+-----------

redo_location | 2/F6008BE0

slot_name     | main_slot

restart_lsn   | 2/F6008CC0

gb_behind     | 0.00

-[ RECORD 2 ]-+-----------

redo_location | 2/F6008BE0

slot_name     | main_slot2

restart_lsn   | 2/F6008CC0

gb_behind     | 0.00

System Variable Requirements

Implementing replication slots requires manual setting. There are variables that you have to keep in mind that require changes and be specified in your postgresql.conf. See below:

  • max_replication_slots– If set to 0, this means that replication slots are totally disabled. If you're using PostgreSQL < 10 versions, this slot has to be specified other than 0 (default). Since PostgreSQL 10, the default is 10. This variable specifies the maximum number of replication slots. Setting it to a lower value than the number of currently existing replication slots will prevent the server from starting.
  • wal_level– must at least be replica or higher (replica is default). Setting hot_standby or archive will map to replica. For a physical replication slot, replica is enough. For logical replication slots, logical is preferred.
  • max_wal_senders– set to 10 by default, 0 in 9.6 version which means replication is disabled. We suggest you set this at least to 16 especially when running with ClusterControl.
  • hot_standby– in versions < 10, you need to set this to on which is off by default. This is important for standby nodes which means when on, you can connect and run queries during recovery or in standby mode.
  • primary_slot_name–  this variable is set via recovery.conf on the standby node. This is the slot to be used by the receiver or standby node when connecting with the sender (or primary/master).

You have to take note that these variables mostly require a database service restart in order to reload new values.

Using Replication Slots in a ClusterControl PostgreSQL Environment

Now, let’s see how we can use physical replication slots and implement them within a Postgres setup managed by ClusterControl.

Deploying of PostgreSQL Database Nodes

Let's start deploying a 3-node PostgreSQL Cluster using ClusterControl using PostgreSQL 9.6 version this time.

ClusterControl will deploy nodes with the following system variables defined accordingly based on their defaults or tuned up values. In:

postgres=# select name, setting from pg_settings where name in ('max_replication_slots', 'wal_level', 'max_wal_senders', 'hot_standby');

         name          | setting 

-----------------------+---------

 hot_standby           | on

 max_replication_slots | 0

 max_wal_senders       | 16

 wal_level             | replica

(4 rows)

In versions PostgreSQL > 9.6, max_replication_slots default value is 10 which is enabled by default but not in 9.6 or lower versions which is disabled by default. You need to assign max_replication_slots higher than 0. In this example, I set max_replication_slots to 5.

root@debnode10:~# grep 'max_replication_slots' /etc/postgresql/9.6/main/postgresql.conf 

# max_replication_slots = 0                     # max number of replication slots

max_replication_slots = 5

and restarted the service,

root@debnode10:~# pg_lsclusters 

Ver Cluster Port Status Owner    Data directory Log file

9.6 main    5432 online postgres /var/lib/postgresql/9.6/main pg_log/postgresql-%Y-%m-%d_%H%M%S.log


root@debnode10:~# pg_ctlcluster 9.6 main restart

Setting The Replication Slots For Primary and Standby Nodes

There's no option in ClusterControl to do this, so you have to create your slots manually. In this example, I created the slots in the primary in host 192.168.30.100:

192.168.10.100:5432 pgdbadmin@maximus_db=# SELECT pg_create_physical_replication_slot('slot1'), pg_create_physical_replication_slot('slot2');

 pg_create_physical_replication_slot | pg_create_physical_replication_slot 

-------------------------------------+-------------------------------------

 (slot1,)                            | (slot2,)

(1 row)

Checking what we have just created shows,

192.168.10.100:5432 pgdbadmin@maximus_db=# select * from pg_replication_slots;

 slot_name | plugin | slot_type | datoid | database | active | active_pid | xmin | catalog_xmin | restart_lsn | confirmed_flush_lsn 

-----------+--------+-----------+--------+----------+--------+------------+------+--------------+-------------+---------------------

 slot1     | | physical  | | | f      | | |       | | 

 slot2     | | physical  | | | f      | | |       | | 

(2 rows)

Now in the standby nodes, we need to update the recovery.conf and add the variable primary_slot_name and change the application_name so it's easier to identify the node. Here's how it looks like in host 192.168.30.110 recovery.conf: 

root@debnode11:/var/lib/postgresql/9.6/main/pg_log# cat ../recovery.conf 

standby_mode = 'on'

primary_conninfo = 'application_name=node11 host=192.168.30.100 port=5432 user=cmon_replication password=m8rLmZxyn23Lc2Rk'

recovery_target_timeline = 'latest'

primary_slot_name = 'slot1'

trigger_file = '/tmp/failover_5432.trigger'

Doing the same thing as well in host 192.168.30.120 but changed the application_name and set the primary_slot_name = 'slot2'.

Checking the replication slot health:

192.168.10.100:5432 pgdbadmin@maximus_db=# select * from pg_replication_slots;

 slot_name | plugin | slot_type | datoid | database | active | active_pid | xmin | catalog_xmin | restart_lsn | confirmed_flush_lsn 

-----------+--------+-----------+--------+----------+--------+------------+------+--------------+-------------+---------------------

 slot1     | | physical  | | | t      | 24252 | |       | 0/CF0A4218 | 

 slot2     | | physical  | | | t      | 11635 | |       | 0/CF0A4218 | 

(2 rows)

What Else Do You Need?

Since ClusterControl doesn't support Replication Slots as of this time, there are things that you need to take into account. What are these? Let's go into details.

Failover/Switchover Process

When an auto failover or switchover via ClusterControl has been attempted, slots will not be retained from the primary and on the standby nodes. You need to re-create this manually, check the variables if set correctly, and modify the recovery.conf accordingly.

Rebuilding a Slave from a Master

When rebuilding a slave, the recovery.conf will not be retained. This means that your recovery.conf settings having the primary_slot_name will be erased. You need to specify this manually again and check the pg_replication_slots view to determine if slots are properly used or left orphaned.

If you want to rebuild the slave/standby node from a master, you might have to consider specifying the PGAPPNAME env variable just like the command below:

$ export PGAPPNAME="app_repl_testnode15"; /usr/pgsql-9.6/bin/pg_basebackup -h 192.168.10.190 -U cmon_replication -D /var/lib/pgsql/9.6/data -p5434 -W -S main_slot -X s -R -P

Specifying the -R param is very important so it will re-create the recovery.conf, while -S shall specify what slot name to use when rebuilding the standby node.

Conclusion

Implementing the Replication Slots in PostgreSQL is straightforward yet there are certain caveats that you must remember. When deploying with ClusterControl, you’ll need to update some settings during failover or slave rebuilds.

An Introduction to MySQL Deployment Using an Ansible Role

$
0
0

Ansible automates and simplifies repetitive, complex, and tedious operations. It is an IT automation engine that automates cloud provisioning, configuration management, application deployment, intra-service orchestration, and many other IT needs. It requires no agents, using only SSH to push changes from a single source to multiple remote resources with no additional custom security infrastructure configuration and use a simple language format (YAML) to describe the automation jobs.

Installing a standalone MySQL server is a simple straightforward task, but this can be problematic if you have multiple database servers, versions, platforms and environments to support. Thus, having a configuration management tool is the way to go to improve efficiency, remove repetitiveness and reduce human errors.

In this blog post, we are going to go walk you through the basics of Ansible's automation for MySQL, as well as configuration management with examples and explanations. We will start with a simple standalone MySQL deployment, as illustrated in the following high-level diagram:

Installing Ansible

For this walkthrough, we need to have at least two hosts - One host is for Ansible (you could use a workstation instead of a server) and another one is the target host that we want to deploy a MySQL server. 

To install Ansible on CentOS 7, simply run the following commands:

(ansible-host)$ yum install -y epel-release

(ansible-host)$ yum install -y ansible

For other OS distributions, check out the Ansible installation guide.

Setting up Passwordless SSH

Using password during SSH is supported, but passwordless SSH keys with ssh-agent are one of the best ways to use Ansible. The initial step is to configure passwordless SSH since Ansible will perform the deployment solely by this channel. Firstly, generate a SSH key on the Ansible host:

(ansible-host)$ whoami

root

(ansible-host)$ ssh-keygen -t rsa -N '' -f ~/.ssh/id_rsa

You should get at least the following files generated:

(ansible-host)$ ls -al ~/.ssh/

-rw-------. 1 root root 1679 Jan 14 03:40 id_rsa

-rw-r--r--. 1 root root  392 Jan 14 03:40 id_rsa.pub

To allow passwordless SSH, we need to copy the SSH public key (id_rsa.pub) to the remote host that we want to access. We can use a tool called ssh-copy-id to do this task for us. However, you must know the user's password of the target host and the password authentication is allowed on the target host:

(ansible-host)$ whoami

root

(ansible-host)$ ssh-copy-id root@192.168.0.221

The above command will prompt out for root password of 192.168.0.221, simply enter the password and the SSH key for the current user of the Ansible host will be copied over to the target host, 192.168.0.221 into ~/.ssh/authorized_keys, meaning we authorize that particular key to access this server remotely. To test out, you should be able to run the following remote command without any password from Ansible host:

(ansible-host)$ ssh root@192.168.0.221 "hostname -I"

192.168.0.221

In case where you are not allowed to use root user for SSH (e.g, "PermitRootLogin no" in SSH configuration), you can use a sudo user instead. In the following example, we set up passwordless SSH for a sudo user called "vagrant":

(ansible-host)$ whoami

vagrant

(ansible-host)$ ssh-keygen -t rsa -N '' -f ~/.ssh/id_rsa

(ansible-host)$ ls -al ~/.ssh/

-rw-------. 1 vagrant vagrant 1679 Jan 14 03:45 id_rsa

-rw-r--r--. 1 vagrant vagrant  392 Jan 14 03:45 id_rsa.pub

(ansible-host)$ ssh-copy-id vagrant@192.168.0.221

If the target server doesn't allow password authentication via SSH, simply copy the content of SSH public key at ~/.ssh/id_rsa.pub manually into the target hosts' ~/.ssh/authorized_keys file. For example, on the Ansible host, retrieve the public key content:

(ansible-host)$ cat ~/.ssh/id_rsa.pub

ssh-rsa AAAAB3NzaC1yc2EAAAADAQABAAABAQC5MZjufN0OiKyKa2OG0EPBEF/w23FnOG2x8qpAaYYuqHlVc+ZyRugtGm+TdTJDfLA1Sr/rtZpXmPDuLUdlAvPmmwqIhgiatKiDw5t2adNUwME0sVgAlBv/KvbusTTdtpFQ1o+Z9CltGiENDCFytr2nVeBFxImoZu2H0ilZed/1OY2SZejUviXTQ0Dh0QYdIeiQHkMf1CiV2sNYs8j8+ULV26OOKCd8c1h1O9M5Dr4P6kt8E1lVSl9hbd4EOHQmeZ3R3va5zMesLk1A+iadIGJCJNCVOA2RpxDHmmaX28zQCwrpCliH00g9iCRixlK+cB39d1coUWVGy7SeaI8bzfv3 vagrant@cc

Connect to the target host and paste the Ansible's host public key into ~/.ssh/authorized_keys:

(target-host)$ whoami

root

(target-host)$ vi ~/.ssh/authorized_keys

ssh-rsa AAAAB3NzaC1yc2EAAAADAQABAAABAQC5MZjufN0OiKyKa2OG0EPBEF/w23FnOG2x8qpAaYYuqHlVc+ZyRugtGm+TdTJDfLA1Sr/rtZpXmPDuLUdlAvPmmwqIhgiatKiDw5t2adNUwME0sVgAlBv/KvbusTTdtpFQ1o+Z9CltGiENDCFytr2nVeBFxImoZu2H0ilZed/1OY2SZejUviXTQ0Dh0QYdIeiQHkMf1CiV2sNYs8j8+ULV26OOKCd8c1h1O9M5Dr4P6kt8E1lVSl9hbd4EOHQmeZ3R3va5zMesLk1A+iadIGJCJNCVOA2RpxDHmmaX28zQCwrpCliH00g9iCRixlK+cB39d1coUWVGy7SeaI8bzfv3 vagrant@cc

You may now try to run a remote command from Ansible host to verify and you should not be prompted with any password. At this point, our passwordless SSH is configured.

Defining the Target Host

Next we need to define the target host, the host that we want to manage using Ansible. Based on our architecture, we are going to deploy only one MySQL server which is 192.168.0.221. Add the following lines into /etc/ansible/hosts:

[db-mysql]

192.168.0.221

The above simply means we defined a group called "db-mysql", which will be the identifier when we refer to the target host in Ansible playbook. We can also list out all IP addresses or hostnames of the target hosts under this group. At this point, we only have one MySQL server to deploy, thus only one entry is there. You can also specify a any matching rule to match the hosts under one group, for example:

[db-mysql]

192.168.0.[221:223]

The above definition means we are having 3 hosts under this very group with the following IP addresses:

  • 192.168.0.221
  • 192.168.0.222
  • 192.168.0.223

There are a lot of ways and rules to match and group the target hosts as shown in the Ansible inventory guide.

Choosing an Ansible Role

To tell Ansible what to deploy, we need to define the deployment steps in a YML formatted file called playbook. As you might know, installing a complete MySQL server requires multiple steps to satisfy all MySQL dependencies, post-installation configuration, user and schema creation and so on. Ansible has provided a number of MySQL modules that can help us out, but still we have to write a playbook for the deployment steps.

To simplify the deployment steps, we can use existing Ansible roles. Ansible role is an independent component which allows reuse of common configuration steps. An Ansible role has to be used within the playbook. There are a number of MySQL Ansible roles available in the Ansible Galaxy, a repository for Ansible roles that are available to drop directly into your playbooks.

If you lookup "mysql", you will get plenty of Ansible roles for MySQL:

We will use the most popular one named "mysql" by geerlingguy. You can opt to use other roles but mostly the most downloaded one tends to be for general purpose which usually works fine in most cases.

On the Ansible host, run the following command to download the Ansible role:

(ansible-host)$ ansible-galaxy install geerlingguy.mysql

The role will be downloaded into ~/.ansible/roles/geerlingguy.mysql/ of the current user.

Writing the Ansible Playbook

By looking at the Readme of the Ansible role, we can follow the example playbook that is being provided. Firstly, create a playbook file called deploy-mysql.yml and add the following lines:

(ansible-host)$ vim ~/deploy-mysql.yml

- hosts: db-mysql

  become: yes

  vars_files:

    - vars/main.yml

  roles:

    - { role: geerlingguy.mysql }

In the above lines, we define the target host which is all hosts under db-mysql entries in /etc/ansible/hosts. The next line (become) tells Ansible to execute the playbook as a root user, which is necessary for the role (it is stated there in the Readme file). Next, we define the location of variables file (var_files) located at vars/main.yml, relative to the playbook path.

Let's create the variable directory and file and specify the following line:

(ansible-host)$ mkdir vars

(ansible-host)$ vim vars/main.yml

mysql_root_password: "theR00tP455w0rd"

For more information check out the Role Variables section in the Readme file of this role.

Start the Deployment

Now we are ready to start the MySQL deployment. Use the ansible-playbook command to execute our playbook definitions:

(ansible-host)$ ansible-playbook deploy-mysql.yml

You should see a bunch of lines appear in the output. Focus on the last line where it summarizes the deployment:

PLAY RECAP ***************************************************************************************************************************************

192.168.0.221              : ok=36 changed=8 unreachable=0    failed=0 skipped=16 rescued=0 ignored=0

If everything turns up green and OK, you can verify on the database host that our MySQL server is already installed and running:

(mysql-host)$ rpm -qa | grep -i maria

mariadb-server-5.5.64-1.el7.x86_64

mariadb-libs-5.5.64-1.el7.x86_64

mariadb-5.5.64-1.el7.x86_64


(mysql-host)$ mysqladmin -uroot -p ping

Enter password:

mysqld is alive

As you can see from the above, for CentOS 7, the default MySQL installation is MariaDB 5.5 as part of the standard package repository. At this point, our deployment is considered complete, however, we would like to further customize our deployment as shown in the next sections.

Customizing the Deployment

The simplest definition in playbook gives us a very basic installation and uses all default configuration options. We can further customize the MySQL installation by extending/modifying/appending the playbook to do the following:

  • modify MySQL configuration options
  • add database user
  • add database schema
  • configure user privileges
  • configure MySQL replication
  • install MySQL from other vendors
  • import a custom MySQL configuration file

Installing MySQL from Oracle repository

By default, the role will install the default MySQL package that comes with the OS distribution. As for CentOS 7, you would get MariaDB 5.5 installed by default. Suppose we want to install MySQL from another vendor, we can extend the playbook with pre_tasks, a task which Ansible executes before executing any tasks mentioned in any .yml file, as shown in the following example:

(ansible-host)$ vim deploy-mysql.yml

- hosts: db-mysql

  become: yes

  vars_files:

    - vars/main.yml

  roles:

    - { role: geerlingguy.mysql }

  pre_tasks:

    - name: Install the MySQL repo.

      yum:

        name: http://repo.mysql.com/mysql-community-release-el7-5.noarch.rpm

        state: present

      when: ansible_os_family == "RedHat"

    - name: Override variables for MySQL (RedHat).

      set_fact:

        mysql_daemon: mysqld

        mysql_packages: ['mysql-server']

        mysql_log_error: /var/lib/mysql/error.log

        mysql_syslog_tag: mysqld

        mysql_pid_file: /var/run/mysqld/mysqld.pid

        mysql_socket: /var/lib/mysql/mysql.sock

      when: ansible_os_family == "RedHat"

Execute the playbook:

(ansible-host)$ ansible-playbook deploy-mysql.yml

The above will install MySQL from Oracle repository instead. The default version you would get is MySQL 5.6. Executing the above playbook on a target host that already has a running older version of MySQL/MariaDB would likely fail because of the incompatibility.

Creating MySQL Databases and Users

Inside vars/main.yml, we can define the MySQL database and users that we want Ansible to configure on our MySQL server by using the mysql_database and mysql_users modules, right after our previous definition on mysql_root_password:

(ansible-host)$ vim vars/main.yml

mysql_root_password: "theR00tP455w0rd"

mysql_databases:

  - name: myshop

    encoding: latin1

    collation: latin1_general_ci

  - name: sysbench

    encoding: latin1

    collation: latin1_general_ci

mysql_users:

  - name: myshop_user

    host: "%"

    password: mySh0pPassw0rd

    priv: "myshop.*:ALL"

  - name: sysbench_user

    host: "192.168.0.%"

    password: sysBenchPassw0rd

    priv: "sysbench.*:ALL"

The definition instructs Ansible to create two databases, "myshop" and "sysbench", followed its respective MySQL user with proper privileges, allowed host and password.

Re-execute the playbook to apply the change into our MySQL server:

(ansible-host)$ ansible-playbook deploy-mysql.yml

This time, Ansible will pick up all the changes we made in vars/main.yml to be applied to our MySQL server. We can verify in the MySQL server with the following commands:

(mysql-host)$ mysql -uroot -p -e 'SHOW DATABASES'

Enter password:

+--------------------+

| Database           |

+--------------------+

| information_schema |

| myshop             |

| mysql              |

| performance_schema |

| sysbench           |

+--------------------+

(mysql-host)$ mysql -uroot -p -e 'SHOW GRANTS FOR sysbench_user@"192.168.0.%"'

Enter password:

+------------------------------------------------------------------------------------------------------------------------+

| Grants for sysbench_user@192.168.0.%                                                                                   |

+------------------------------------------------------------------------------------------------------------------------+

| GRANT USAGE ON *.* TO 'sysbench_user'@'192.168.0.%' IDENTIFIED BY PASSWORD '*4AC2E8AD02562E8FAAF5A958DC2AEA4C47451B5C' |

| GRANT ALL PRIVILEGES ON `sysbench`.* TO 'sysbench_user'@'192.168.0.%'                                                  |

+------------------------------------------------------------------------------------------------------------------------+

Enabling Slow Query Log

This role supports enabling MySQL slow query log, we can define the location of the log file as well as the slow query time. Add the necessary variables inside vars/main.yml file:

mysql_root_password: "theR00tP455w0rd"

mysql_databases:

  - name: example_db

    encoding: latin1

    collation: latin1_general_ci

  - name: sysbench

    encoding: latin1

    collation: latin1_general_ci

mysql_users:

  - name: example_user

    host: "%"

    password: similarly-secure-password

    priv: "example_db.*:ALL"

  - name: sysbench_user

    host: "192.168.0.%"

    password: sysBenchPassw0rd

    priv: "sysbench.*:ALL"

mysql_slow_query_log_enabled: true

mysql_slow_query_log_file: 'slow_query.log'

mysql_slow_query_time: '5.000000'

Re-run the playbook to apply the changes:

(ansible-host)$ ansible-playbook deploy-mysql.yml

The playbook will make necessary changes to MySQL slow query related options and restart the MySQL server automatically to load the new configurations. We can then verify if the new configuration options are loaded correctly on the MySQL server:

(mysql-host)$ mysql -uroot -p -e 'SELECT @@slow_query_log, @@slow_query_log_file, @@long_query_time'

+------------------+-----------------------+-------------------+

| @@slow_query_log | @@slow_query_log_file | @@long_query_time |

+------------------+-----------------------+-------------------+

|                1 | slow_query.log        | 5.000000 |

+------------------+-----------------------+-------------------+

Including Custom MySQL Configuration File

Ansible role variables and MySQL variables are two different things. The author of this role has created a number of MySQL related variables that can be represented with Ansible role variables. Taken from the Readme file, here are some of them:

mysql_port: "3306"

mysql_bind_address: '0.0.0.0'

mysql_datadir: /var/lib/mysql

mysql_socket: *default value depends on OS*

mysql_pid_file: *default value depends on OS*

mysql_log_file_group: mysql *adm on Debian*

mysql_log: ""

mysql_log_error: *default value depends on OS*

mysql_syslog_tag: *default value depends on OS*

If the generated configuration does not satisfy our MySQL requirement, we can include custom MySQL configuration files into the deployment by using mysql_config_include_files variable. It accepts an array of values separated by a comma, with a "src" as the prefix for the actual path on the Ansible host.

First of all, we have to prepare the custom configuration files on the Ansible host. Create a directory and a simple MySQL configuration file:

(ansible-host)$ mkdir /root/custom-config/

(ansible-host)$ vim /root/custom-config/my-severalnines.cnf

[mysqld]

max_connections=250

log_bin=binlog

expire_logs_days=7

Let's say we have another configuration file specifically for mysqldump configuration:

(ansible-host)$ vim /root/custom-config/mysqldump.cnf

[mysqldump]

max_allowed_packet=128M

To import these configuration files into our deployment, define them in the mysql_config_include_files array in vars/main.yml file:

mysql_root_password: "theR00tP455w0rd"

mysql_databases:

  - name: example_db

    encoding: latin1

    collation: latin1_general_ci

  - name: sysbench

    encoding: latin1

    collation: latin1_general_ci

mysql_users:

  - name: example_user

    host: "%"

    password: similarly-secure-password

    priv: "example_db.*:ALL"

  - name: sysbench_user

    host: "192.168.0.%"

    password: sysBenchPassw0rd

    priv: "sysbench.*:ALL"

mysql_slow_query_log_enabled: true

mysql_slow_query_log_file: slow_query.log

mysql_slow_query_time: 5

mysql_config_include_files: [

  src: '/root/custom-config/my-severalnines.cnf',

  src: '/root/custom-config/mysqldump.cnf'

]

Note that /root/custom-config/mysqld-severalnines.cnf and /root/custom-config/mysqldump.cnf exist inside the Ansible host.

Re-run the playbook:

(ansible-host)$ ansible-playbook deploy-mysql.yml

The playbook will import those configuration files and put them into the include directory (depending on the OS) which is /etc/my.cnf.d/ for CentOS 7. The playbook will auto-restart the MySQL server to load the new configuration options. We can then verify if the new configuration options are loaded correctly:

(mysql-host)$ mysql -uroot -p -e 'select @@max_connections'

250

(mysql-host)$ mysqldump --help | grep ^max-allowed-packet

max-allowed-packet                134217728

Conclusion

Ansible can be used to automate the database deployment and configuration management with a little knowledge of scripting. Meanwhile, ClusterControl uses a similar passwordless SSH approach to deploy, monitor, manage and scale your database cluster from A to Z, with a user interface and needs no additional skill to achieve the same result.

Open Source Database Adoption - Taking a Look at Percona’s Survey Results

$
0
0

Are you still struggling to pick the best open source database software for your organisation? You would have penned down a must-have feature list right from deploying, managing, and monitoring a database but finding the best fit?... still not there. 

There are many software vendors out there trying their best to offer a variety of combinations of features to manage the open-source databases, so it would be wise to get an insight on the current happenings around this space before making any decision. 

Recently Percona conducted a survey on 750 respondents from small, medium, and large companies to try to understand how they have managed their open source database environments. The survey results have led to interesting findings to understand the trends in open source database adoption by the open source community. 

This blog walks you through important points on open source database features, leading technologies, adoption factors, and concerns evaluated by those organisations. 

Multiple Open Source Environments

Many companies now have multiple databases on multiple platforms across different locations, to keep up with the rapid needs and changes in their business. The need for multiple database instances often increases as the data volume increases. On average, over half of the open source community uses at least 25 instances for this purpose. 

73% of relational database users, shows that the relational database is still the market preference over the multiple-model databases like time-Series, graph, wide column, and other niche database technologies. 

With many different databases, companies are now overwhelmed with choices, allowing them to have a combination of database types to support the various applications they have in their environment. The combination usually depends on the interaction and data support between the database and the applications. To maintain these multi environments, companies should be prepared to invest in either a multi-skilled DBA or have a good open source database management system (like ClusterControl) to deploy, manage, and monitor the various databases in their environment.

The Leading Open Source Databases

The survey on open source databases  also highlighted the top databases installed in 2019, and the five leading databases are as below

Postgres-XL, Clustrix, Alibaba Cloud: ApsaraDB RDS for PostgreSQL, FoundationDB Document Layer and Azure Cosmos DB are at the bottom 5 with less than 1% installation for the year.

MySQL - Variants and Combinations

The MySQL Community Edition secured the title for most deployed database for the year of 2019. The top five most popular MySQL-compatible softwares after the community version are...

  • MariaDB Community
  • Percona Server for MySQL
  • MySQL on Amazon RDS
  • Percona XtraDB Cluster
  • Amazon Aurora

MySQL combinations with other databases differ based on the editions. PostgreSQL, Elastic, Redis and MongoDB commonly used with the MySQL Community version. On the other hand, with the Enterprise Version, proprietary databases, SQL Server and Oracle are used as the best combination. 

64% of the community also selected PostgreSQL as a popular database to use alongside the enterprise edition. These results show clearly that the community version is not usually paired with a proprietary database. It is assumed that there could be two main reasons for this decision; lack of skills to manage multiple open source databases and/or the fact that management has concerns over the support of stability of the open source products.

PostgreSQL - Variants and Combinations

PostgreSQL has gained a lot of attention in the last few years and has the most installation after the MySQL database. Its strength lies in the large community base which contributes to its upgrades and expansions. Although there are many compatible versions, only the standard version is preferred one. PostgreSQL is coupled most with Elastic, MongoDB, SQL, and Redis. The enterprise version, like MySQL Enterprise, is commonly paired with the enterprise databases like Oracle and SQL Server.

MongoDB - Variants and Combinations

MongoDB gained its popularity along with big data and its ability to overcome the limitation of a rigid relational database with NoSQL. NoSQL paved the way for agile development and supports flexibility and scalability. Like the other two, MongoDB Community is still the most widely used version by small and medium companies, and the enterprise version is only used by large organisations. 

Open Source Database Adoption

Open-source databases gained popularity because of cost-saving and to avoid vendor lock-in situations. Another bit of good news is that these databases work for any business size, hence it is widely used by small, medium, and large companies alike. 

Open source tools give a platform for experimentation, which allows the users to use a community edition, and get comfortable with it, before moving on to further deployments. On average 53% of companies are moving into the open-source software adoption. 

Open Source Community Contributions

Enhancement in the open source world really depends on the contributions from its user community. This is why open source software with a large community (like PostgreSQL) is always adopted widely by small, medium, and large companies.  Although companies are geared up for open source adoption, and do know the need to contribute, many of the users have said they don't have the time to contribute back to the libraries. 

Support Services

The next main concern on the adoption of open source is around support preferences. Generally, small scale companies management and technical staff prefer a self-support option. 

Support services are also a limiting factor. Companies are often worried about the support mechanism, especially during times of crisis. They lack confidence in their own support team or it could be the internal team just has too many other tasks, making it impossible to give adequate support. 

Small companies usually rely on self-support to minimize cost. To increase confidence in the open source solution, some companies appoint external vendors for support services. Another option which can be considered is to opt for an open source database management system which includes support services as well.

Enterprise or Subscribed Database Preferences

There is still a large percentage of companies using proprietary databases for three major reasons; the strong 24x7 dedicated support line, brand trust, and the enhanced security.  Trust is tagged with a long established brand which gives peace of mind to the users. Despite these factors, community open source still wins with one major factor which is cost saving. 

Open Source Database Adoption Concerns

The survey showed there are three main adoption concerns (besides vendor lock-in). 

The first concern is the lack of support which has been discussed in the earlier sections of this blog. Next is the concern around the lack of fixes and bugs from the small and medium companies. The worry could be on the cost incurred to fix any bugs. 

Large companies are not worried about this, because they can afford the cost to hire someone to fix any bugs and even further enhance the system. 

Security is the third reason, and this concern is mainly from the technical team because they are responsible for the security compliance of its systems in the organisation. 

Conclusion

Adopting an open source database is the way-to-go for any size business and is the best fit if cost and avoiding vendor lock-in is a concern. You also need to be aware of, and check on, the support mechanism, patch support, and security aspects before making a choice. 

Along with the open source technology adoption, you would need a proper technical team to manage the database and have a proper support mechanism to handle any limitations. 

Open source technologies allow you to experiment with the available free or community versions and then decide to go ahead with the licensed or enterprise version if required. 

The great thing is that with open source technologies, you won't have to settle for one database anymore, as you have more than one to serve the different aspects of your business.

A Comparison Between the MySQL Clone Plugin and Xtrabackup

$
0
0

In one of our previous blogs we explained how Clone Plugin, one of new features that showed in MySQL 8.0.17, can be used to rebuild a replication slave. Currently the go-to tool for that, as well as for backups, is Xtrabackup. We thought it is interesting to compare how those tools work and behave.

Comparing Performance

The first thing we decided to test is how both perform when it comes to storing the copy of the data locally. We used AWS and m5d.metal instance with two NVMe SSD and we ran the clone to local copy:

mysql> CLONE LOCAL DATA DIRECTORY='/mnt/clone/';

Query OK, 0 rows affected (2 min 39.77 sec)

Then we tested Xtrabackup and made the local copy:

rm -rf /mnt/backup/ ; time xtrabackup --backup --target-dir=/mnt/backup/ --innodb-file-io-threads=8 --innodb-read-io-threads=8  --innodb-write-io-threads=8 --innodb-io-capacity=20000 --parallel=16

200120 13:12:28 completed OK!

real 2m38.407s

user 0m45.181s

sys 4m18.642s

As you can see, the time required to copy the data was basically the same. In both cases the limitation was the hardware, not the software.

Transferring data to another server will be the most common use case for both tools. It can be a slave you want to provision or rebuild. In the future it may be a backup, Clone Plugin doesn’t have such functionality as of now but we are pretty sure in the future someone will make it possible to use it as a backup tool. Given that hardware is the limitation for local backup in both cases, hardware will also be a limitation for transferring the data across the network. Depending on your setup, it could be either the network, disk I/O or CPU.

In a I/O-intensive operations CPU is the least common bottleneck. This makes it quite common to trade some CPU utilization for reduction in the data set size. You can accomplish that through compression. If it is done on the fly, you still have to read the same amount of data but you send less of it (as it is compressed) over the network. Then, you will have to decompress it and write it down. It is also possible that the files themselves are compressed. In that case you reduce the amount of data read, transferred and written to disk.

Clone Plugin doesn’t come with any sort of on-the-fly compression available. It can clone compressed InnoDB tables but this doesn’t help much when compared to Xtrabackup as Xtrabackup will as well copy the reduced data set. On the other hand, Xtrabackup can be used along with the compression done on the fly, so it will come up faster if the network will be the limiting factor. Other than that we would expect to see similar results in both cases.

Comparing Usability

Performance is just one thing to compare, there are many others like how easy tools are to use. In both cases there are several steps you have to perform. For Clone Plugin it is:

  1. Install the plugin on all nodes
  2. Create users on both donor and receiver nodes
  3. Set up the donor list on the receiver

Those three steps have to be performed once. When they are set, you can use Clone Plugin to copy the data. Based on the init system you may need to start MySQL node after the clone process has completed. This is not required if, like in the case of systemd, MySQL will be automatically restarted.

Xtrabackup requires a couple more steps to get things done.

  1. Install the software on all nodes
  2. Create user on the donor

Those two steps have to be executed once. For every backup you have to execute following steps:

  1. Configure network streaming. Simple and secure way would be to use SSH, something like:
xtrabackup --backup --innodb-file-io-threads=8 --innodb-read-io-threads=8  --innodb-write-io-threads=8 --innodb-io-capacity=20000 --parallel=8 --stream=xbstream --target-dir=/mnt/backup/ | ssh root@172.32.4.70 "xbstream -x -C /mnt/backup/"

We found, though, for faster harddrives, with single-threaded SSH, CPU becomes a bottleneck. Setting up netcat requires additional step on the receiver to ensure netcat is up, listening and redirecting the traffic to the proper software (xbstream).

  1. Stop MySQL on the receiver node

  2. Run the Xtrabackup

  3. Apply InnoDB logs

  4. Copy back the data

  5. Start MySQL on the receiver node

As you can see, Xtrabackup requires more steps to be taken.

Security Considerations

Clone Plugin can be configured to use SSL for data transfer even though by default it uses plain text. Cloning of the encrypted tablespaces is possible but there is no option to encrypt, for example, the local clone. User would have to do it separately, after the clone process is completed.

Xtrabackup itself doesn’t provide any security. Security is determined by how you stream the data. If you use SSH for streaming, data in transit will be encrypted. If you decide to use netcat, it will be sent as a plain text. Of course, if the data is encrypted in tablespaces, it is already secured, just like in the case of the Clone Plugin. Xtrabackup can also be used along with on-the-fly encryption to ensure your data is encrypted also at rest.

Plugin Features

Clone Plugin is a new product, still in an infant phase. Its primary task is to provide ways of provisioning nodes in InnoDB Cluster and it does that just fine. For other tasks, like backups or provisioning of replication slaves, it can be used to some extent but it suffers from several limitations. We covered some of them in our previous blog so we won’t repeat it here but the most serious one, when talking about provisioning and backups, is that only InnoDB tables are cloned. If you happen to use any other storage engine, you cannot really use Clone Plugin. On the other hand Xtrabackup will happily backup and transfer most commonly used storage engines: InnoDB, MyISAM (unfortunately, it’s still used in many places) and CSV. Xtrabackup comes also with a set of tools that are intended to help with streaming the data from node to node or even stream backup to S3 buckets.

To sum it up, when it comes to backing up data and provisioning replication slaves, xtrabackup is and most likely will still be the most popular pick. On the other hand, Clone Plugin, most likely, will improve and evolve. We will see what the future holds and how things will look like in a year’s time.

Let us know if you have any thoughts on the Clone Plugin, we are very interested to see what is your opinion on this new tool.


Understanding the ProxySQL Audit Log

$
0
0

ProxySQL became a very important bit of infrastructure in the database environments. It works as a load balancer, it helps to shape the flow of the traffic and reduce the downtime. With great power comes great responsibility. How can you stay up to date on who is accessing the ProxySQL configuration? Who is connecting to the database through ProxySQL? Those questions can be answered using ProxySQL Audit Log, which is available starting from ProxySQL 2.0.5. In this blog post we will look into how to enable this feature and how the log contents look like.

The initial steps will be to deploy ProxySQL. We can easily do that using ClusterControl - both MySQL Replication and Galera Cluster types support ProxySQL deployment.

Assuming we have a cluster up and running, we can deploy ProxySQL from Manage -> LoadBalancers:

We have to decide on which node ProxySQL should be installed, its version (we’ll keep the default 2.x) and define credentials for ProxySQL administrative and monitoring users.

Below we can either import existing application users from the database or create a new one by assigning name, password, schema and MySQL privileges. We can then configure which nodes should be included in ProxySQL and decide if we use implicit transactions or not. Once everything is done, we can deploy ProxySQL. For high availability you probably want to add a second ProxySQL and then keepalived on top of them. Keepalived can also be easily deployed from ClusterControl:

Here we have to pick nodes on which ProxySQL is deployed, pass the Virtual IP and network interface VIP should be assigned to. Once this is done, ClusterControl can deploy Keepalived for you.

Now, let’s take a look at the audit log. All configurations should be performed on both ProxySQL nodes. Alternatively you can use an option to sync the nodes:

There are two settings that govern how the audit log should work:

The first one defines the file where data should be stored, the second tells how large the log file should be before it’ll be rotated. Let’s configure log in ProxySQL data directory:

Now, we can take a look at the data we see in the audit log file. First of all, the format in which data is stored is JSON. There are two types of events, one related to MySQL connectivity and second related to ProxySQL admin interface connectivity.

Here is an example of entries triggered by MySQL traffic:

"client_addr": "10.0.0.100:40578",

  "event": "MySQL_Client_Connect_OK",

  "proxy_addr": "0.0.0.0:6033",

  "schemaname": "sbtest",

  "ssl": false,

  "thread_id": 810,

  "time": "2020-01-23 14:24:17.595",

  "timestamp": 1579789457595,

  "username": "sbtest"

}

{

  "client_addr": "10.0.0.100:40572",

  "event": "MySQL_Client_Quit",

  "proxy_addr": "0.0.0.0:6033",

  "schemaname": "sbtest",

  "ssl": false,

  "thread_id": 807,

  "time": "2020-01-23 14:24:17.657",

  "timestamp": 1579789457657,

  "username": "sbtest"

}

{

  "client_addr": "10.0.0.100:40572",

  "creation_time": "2020-01-23 14:24:17.357",

  "duration": "299.653ms",

  "event": "MySQL_Client_Close",

  "extra_info": "MySQL_Thread.cpp:4307:process_all_sessions()",

  "proxy_addr": "0.0.0.0:6033",

  "schemaname": "sbtest",

  "ssl": false,

  "thread_id": 807,

  "time": "2020-01-23 14:24:17.657",

  "timestamp": 1579789457657,

  "username": "sbtest"

}

As you can see, most of the data repeats: client address, ProxySQL address, schema name, if SSL was used in connections, related thread number in MySQL, user that created the connection. The “MySQL_Client_Close” event also contains information about the time when the connection was created and the duration of the connection. You can also see which part of ProxySQL code was responsible for closing the connection.

Admin connections are quite similar:

{

  "client_addr": "10.0.0.100:52056",

  "event": "Admin_Connect_OK",

  "schemaname": "information_schema",

  "ssl": false,

  "thread_id": 815,

  "time": "2020-01-23 14:24:19.490",

  "timestamp": 1579789459490,

  "username": "proxysql-admin"

}

{

  "client_addr": "10.0.0.100:52056",

  "event": "Admin_Quit",

  "schemaname": "information_schema",

  "ssl": false,

  "thread_id": 815,

  "time": "2020-01-23 14:24:19.494",

  "timestamp": 1579789459494,

  "username": "proxysql-admin"

}

{

  "client_addr": "10.0.0.100:52056",

  "creation_time": "2020-01-23 14:24:19.482",

  "duration": "11.795ms",

  "event": "Admin_Close",

  "extra_info": "MySQL_Thread.cpp:3123:~MySQL_Thread()",

  "schemaname": "information_schema",

  "ssl": false,

  "thread_id": 815,

  "time": "2020-01-23 14:24:19.494",

  "timestamp": 1579789459494,

  "username": "proxysql-admin"

}

The data collected is very similar, the main difference is that it is related to connections to the ProxySQL administrative interface.

Conclusion

As you can see, in a very easy way you can enable auditing of the access to ProxySQL. This, especially the administrative access, is something which should be monitored from the security standpoint. Audit plugin makes it quite easy to accomplish.

Viewing all 1476 articles
Browse latest View live