Monitoring is a must in all environments, and databases aren’t the exception. Once you have your database infrastructure up-and-running, you’ll need to keep tabs on what’s happening. Monitoring is a must if you want to be sure everything is going fine but also if you make necessary adjustments while your system grows and evolves. That will enable you to identify trends, plan for upgrades or improvements, or react adequately to any problems or errors that may arise with new versions, different purposes, and so on.
For each database technology, there are different things to monitor. Some of these are specific to the database engine, vendor, or even the particular version that you’re using. Database clusters heavily depend on the underlying infrastructure, so network and operating stats are interesting to see by the database administrators too.
When running multiple database systems, the monitoring of these systems can become quite a chore.
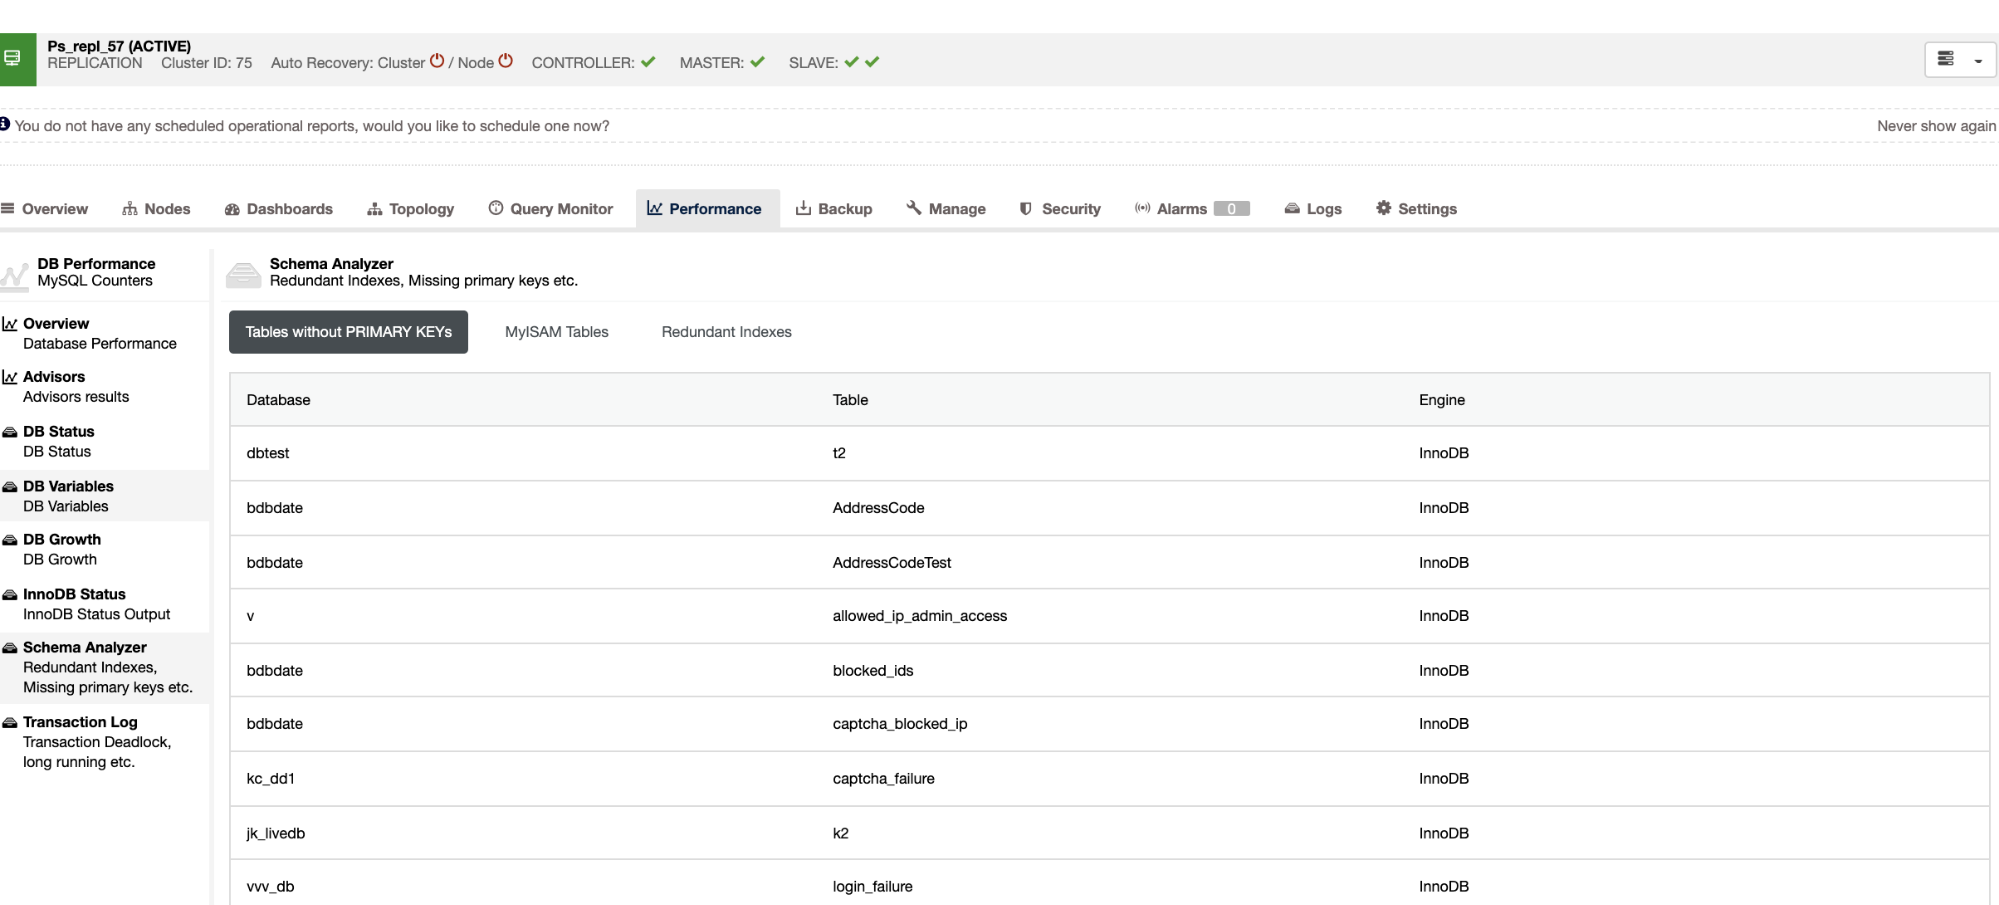
In this blog, we’ll take a look at what you need to monitor a MySQL 8.0 environment. We will also take a look at cluster control monitoring features, which may help you to track the health of your databases for free.
OS and Database System Monitoring
When observing a database cluster or node, there are two main points to take into account: the operating system and the MySQL instance itself. You will need to define which metrics you are going to monitor from both sides and how you are going to do it. You need to follow the parameter always in the meaning of your system, and you should look for alterations on the behavior model.
Grip in mind that when one of your parameters is affected, it can also affect others, making troubleshooting of the issue more complicated. Having a proper monitoring and alerting system is essential to make this task as simple as possible.
In most cases, you will need to use some tools, as it is difficult to find one to cover all the wanted metrics.
OS System Monitoring
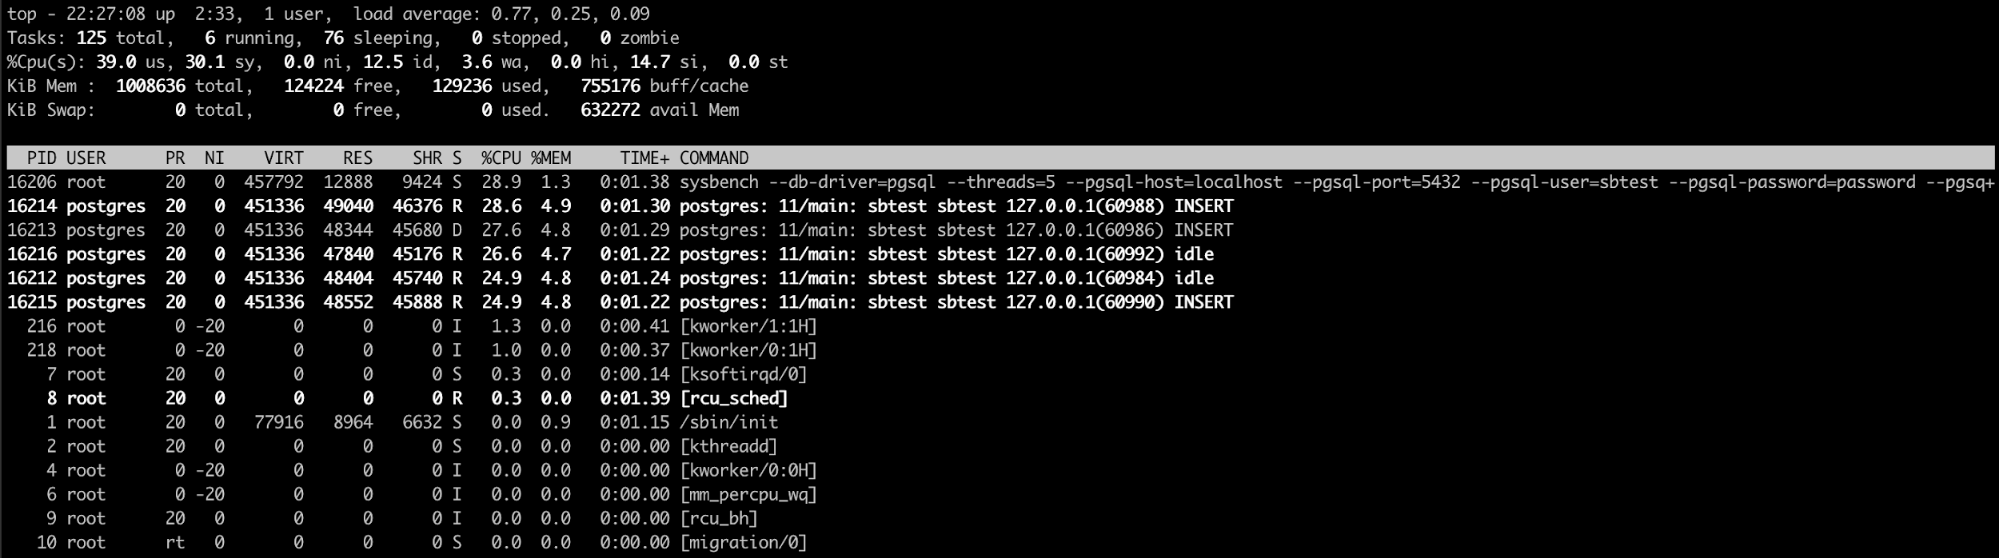
One major thing (which is common to all database engines and even to all systems) is to monitor the Operating System behavior. Here are some points to check here. Below you can find top system resources to watch on a database server. It's actually also the list of very first things to check.
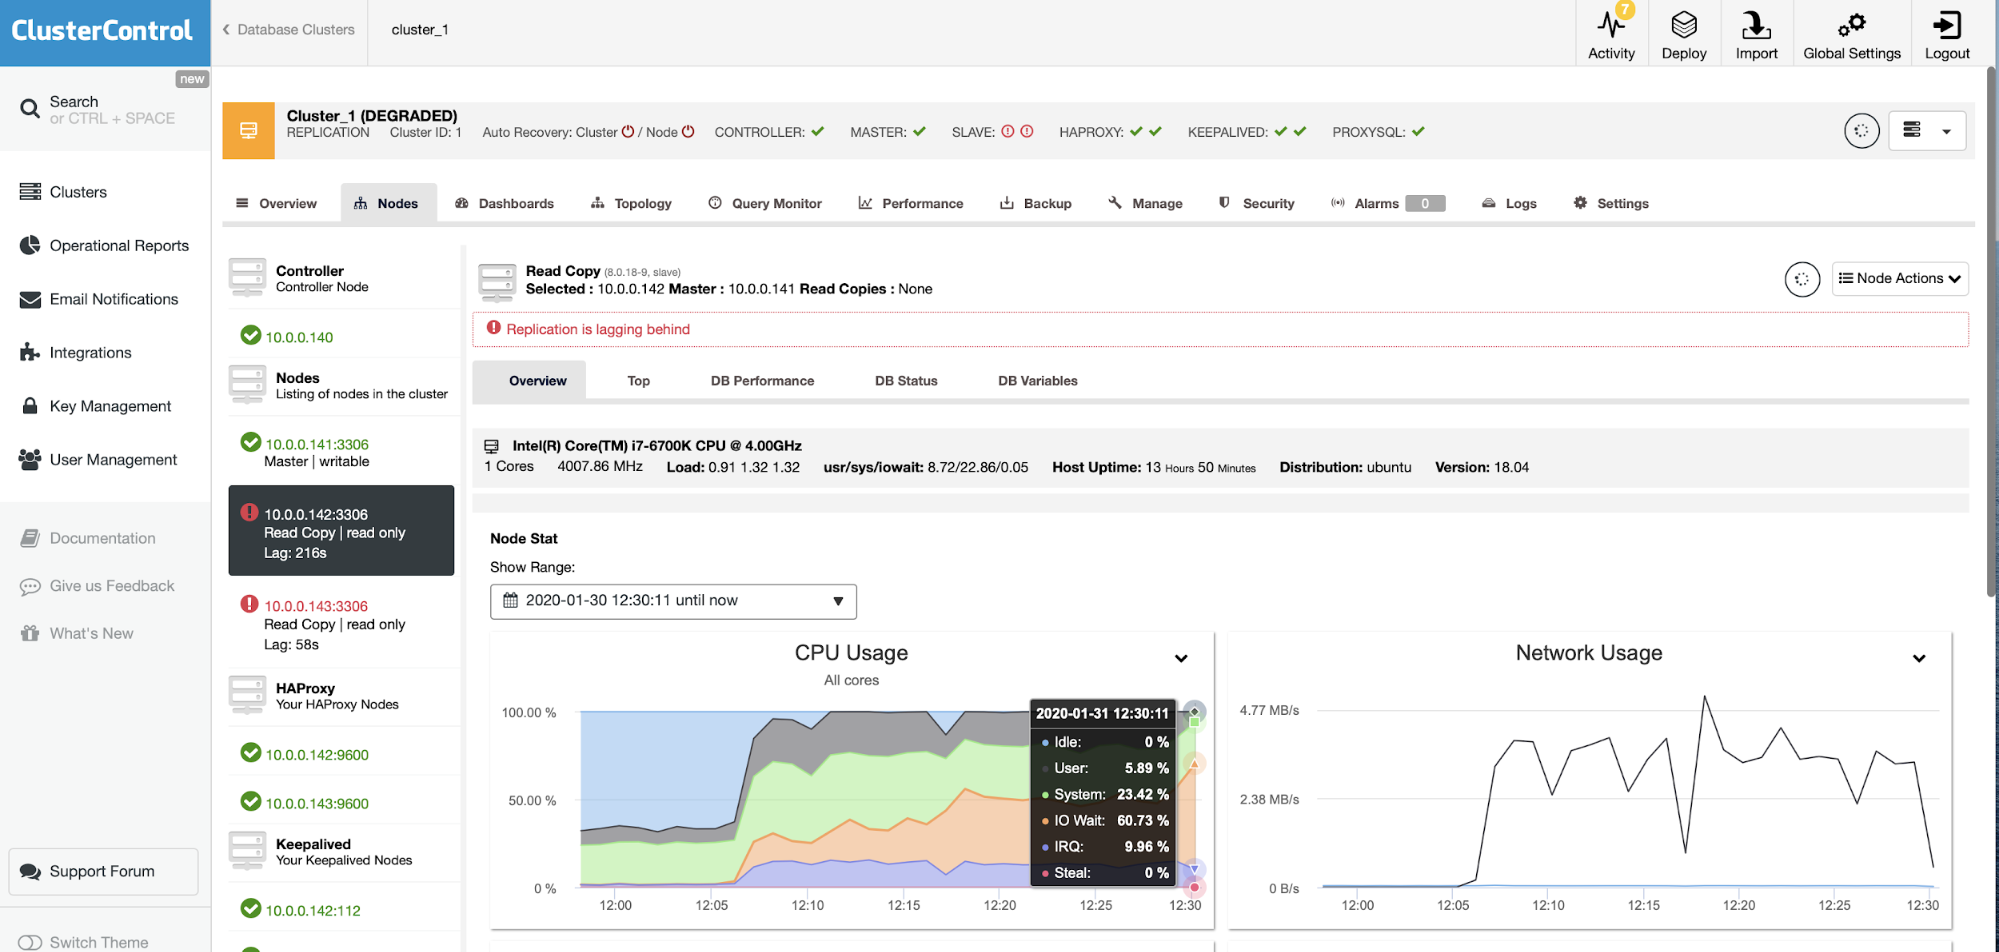
CPU Usage
A high CPU usage is not a bad thing as long as you don’t reach the limit. Excessive percentage of CPU usage could be a problem if it’s not usual behavior. In this case, it is essential to identify the process/processes that are generating this issue. If the problem is the database process, you will need to check what is happening inside the database.
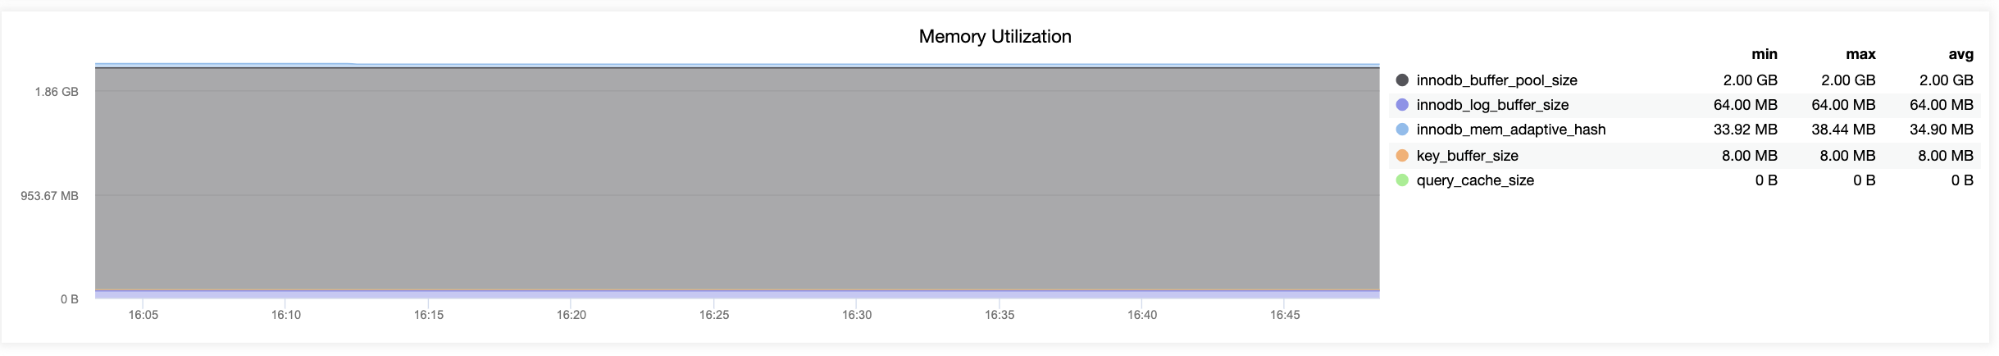
RAM Memory or SWAP Usage
Ideally, your entire database should be stored in memory, but this is not always possible. Give MySQL as much as you can afford but leave enough for other processes to function.
If you see a high value for this metric and nothing has changed in your system, you probably need to check your database configuration. Parameters like shared_buffers and work_mem can affect this directly as they define the amount of memory to be able to use for the MySQL database. Swap is for emergencies only, and it should not be used, make sure you also have your operating system set to let MySQL decide about swap usage.
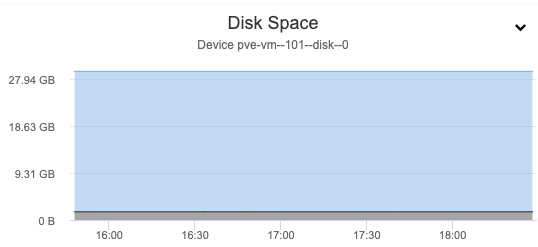
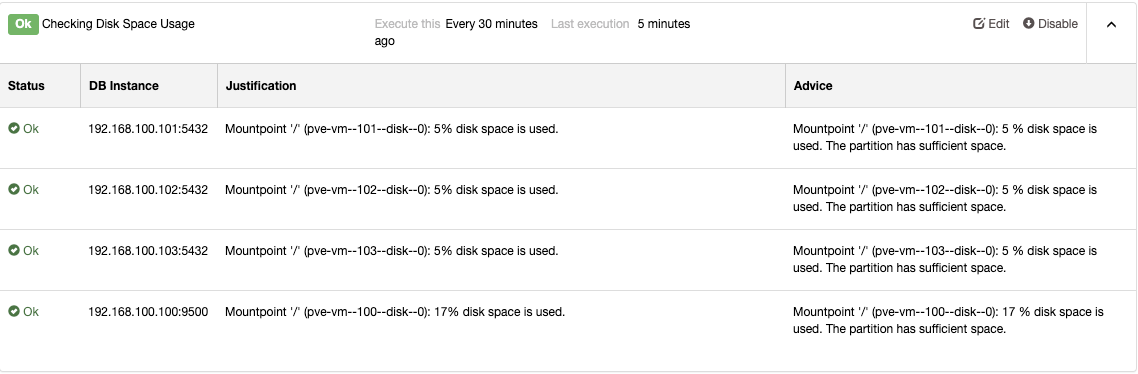
Disk Usage
Disk usage is one of the key metrics to monitor and alert. Make sure you always have free space for new data, temporary files, snapshots, or backups.
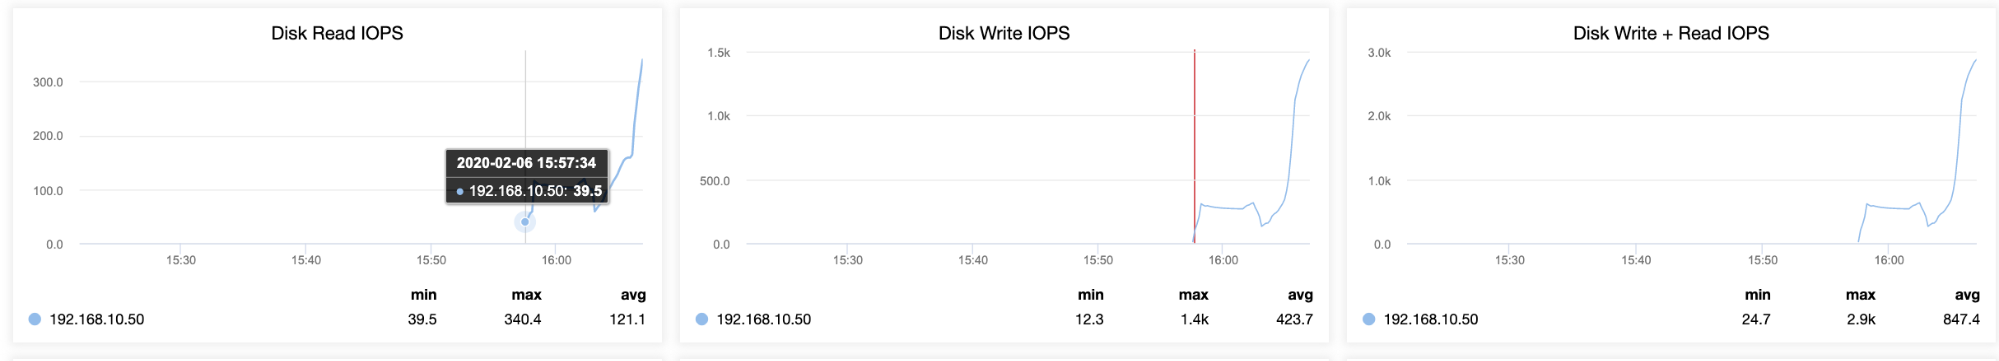
Monitoring hard metric values is not good enough. An abnormal increase in the use of disk space or an excessive disk access consumption is essential things to watch as you could have a high number of errors logged in the MySQL log file or a lousy cache configuration that could generate a vital disk access consumption instead of using memory to process the queries. Make sure you are able to catch abnormal behaviors even if your warning and critical metrics are not reached yet.
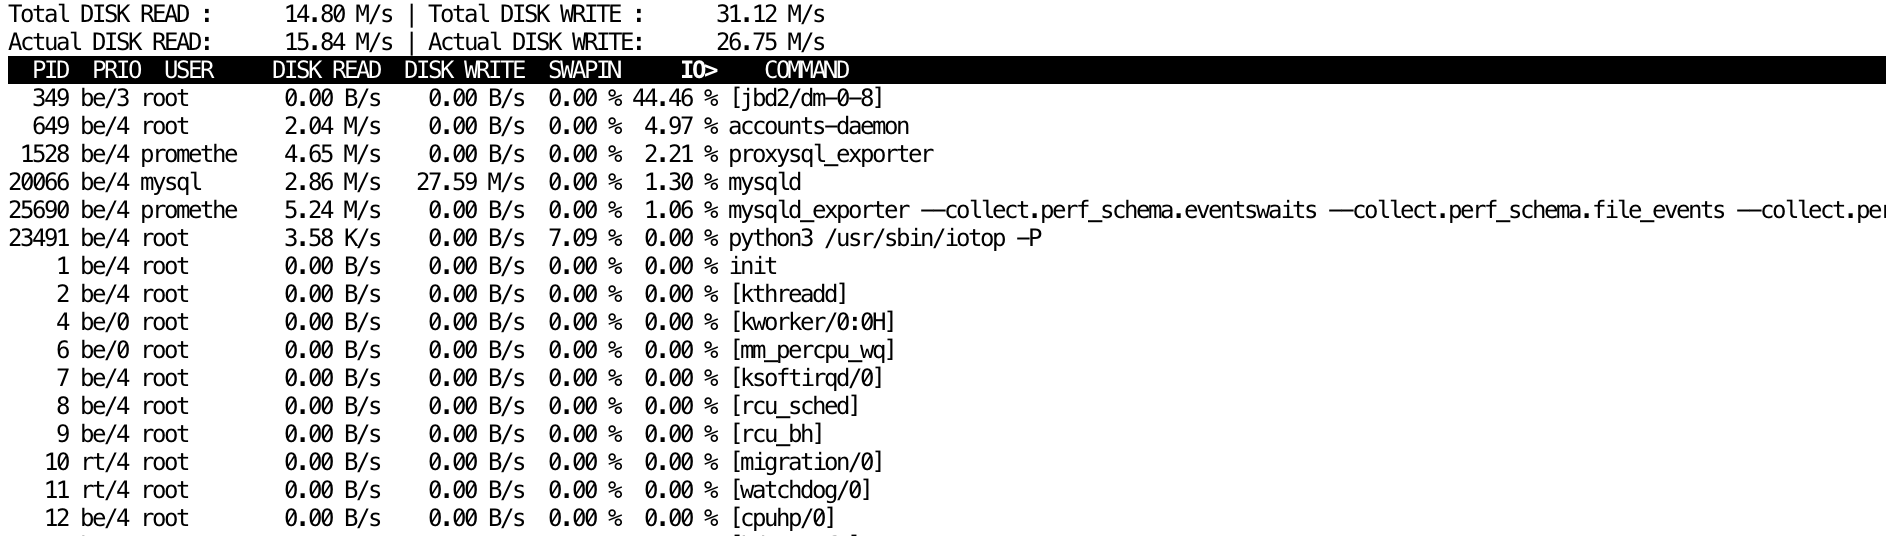
Along with monitoring space we also should monitor disk activity. The top values to monitor are:
- Read/Write requests
- IO Queue length
- Average IO wait
- Average Read/Write time
- Read/Write bandwidth
You can use iostat or pt-diskstats from Percona to see all these details.
Things that can affect your disk performance are often related to data transfer from and towards your disk so monitor abnormal processes than can be started from other users.
Load Average
An all-in-one performance metric. Understanding Linux Load is a key to monitor OS and database dependent systems.
Load average related to the three points mentioned above. A high load average could be generated by an excessive CPU, RAM, or disk usage.
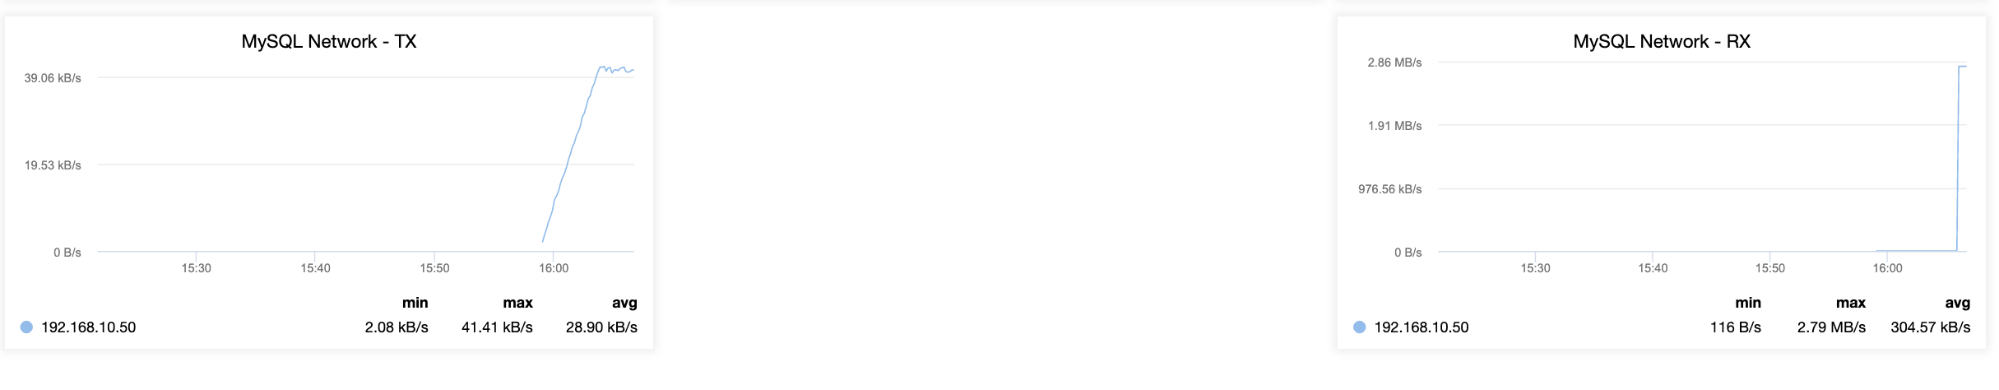
Network
Unless doing backups or transferring vast amounts of data, it shouldn’t be the bottleneck.
A network issue can affect all the systems as the application can’t connect (or connect losing packages) to the database, so this is an important metric to monitor indeed. You can monitor latency or packet loss, and the main issue could be a network saturation, a hardware issue, or just a lousy network configuration.
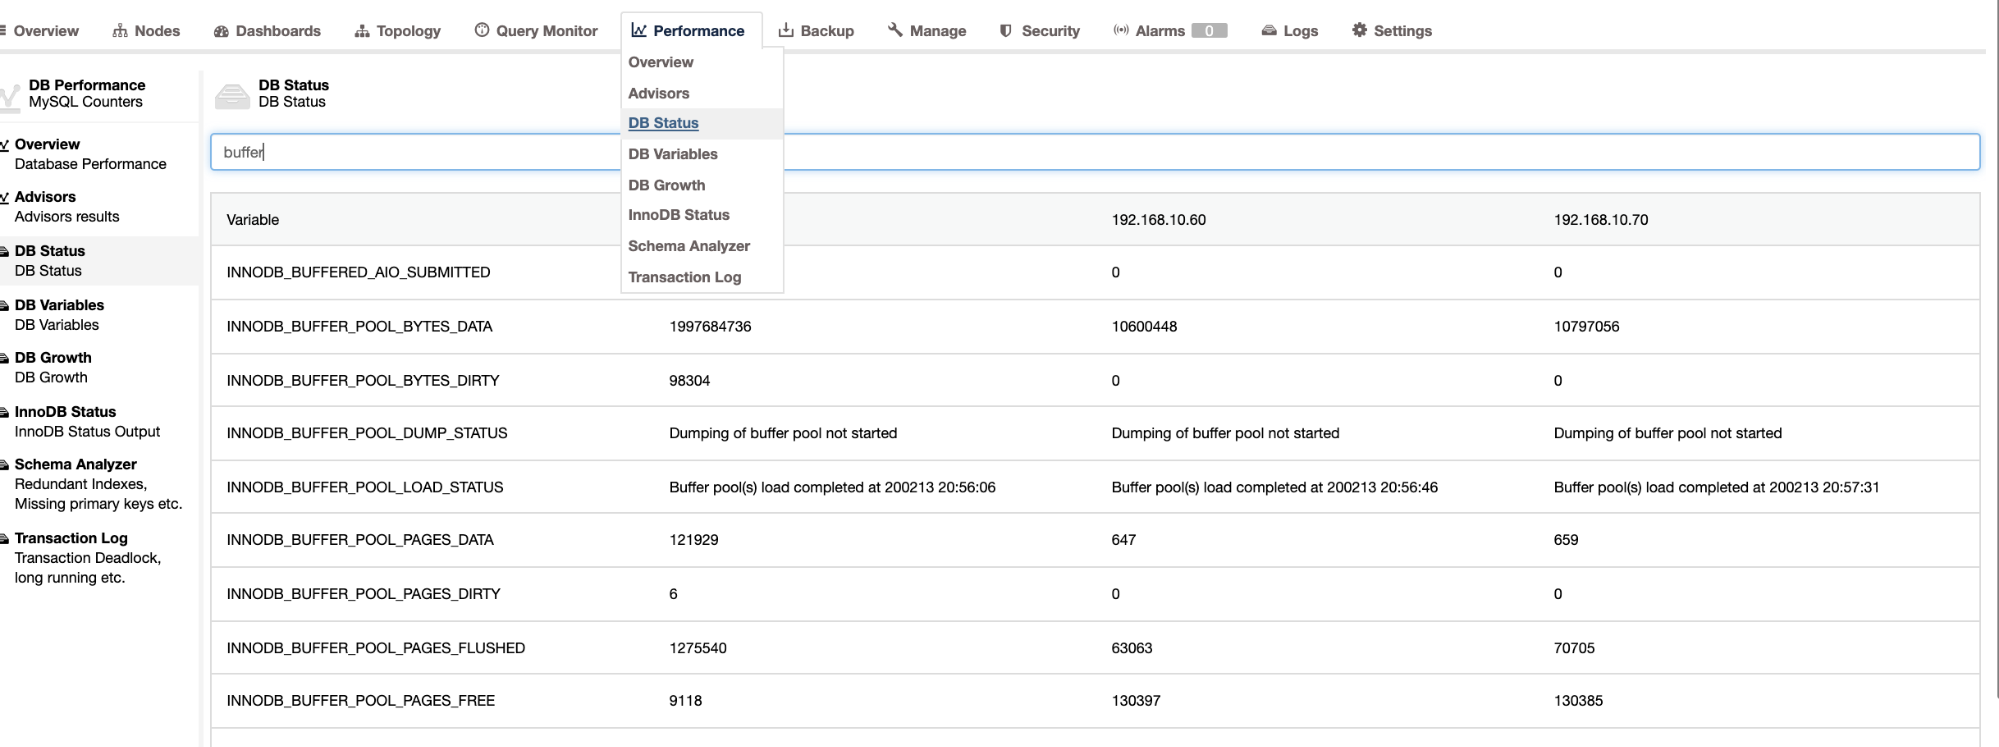
Database Monitoring
While monitoring is a must, it’s not typically free. There is always a cost on the database performance, depending on how much you are monitoring, so you should avoid monitoring things that you won’t use.
In general, there are two ways to monitor your databases, from the logs or from the database side by querying.
In the case of logs, to be able to use them, you need to have a high logging level, which generates high disk access and it can affect the performance of your database.
For the querying mode, each connection to the database uses resources, so depending on the activity of your database and the assigned resources, it may affect the performance too.
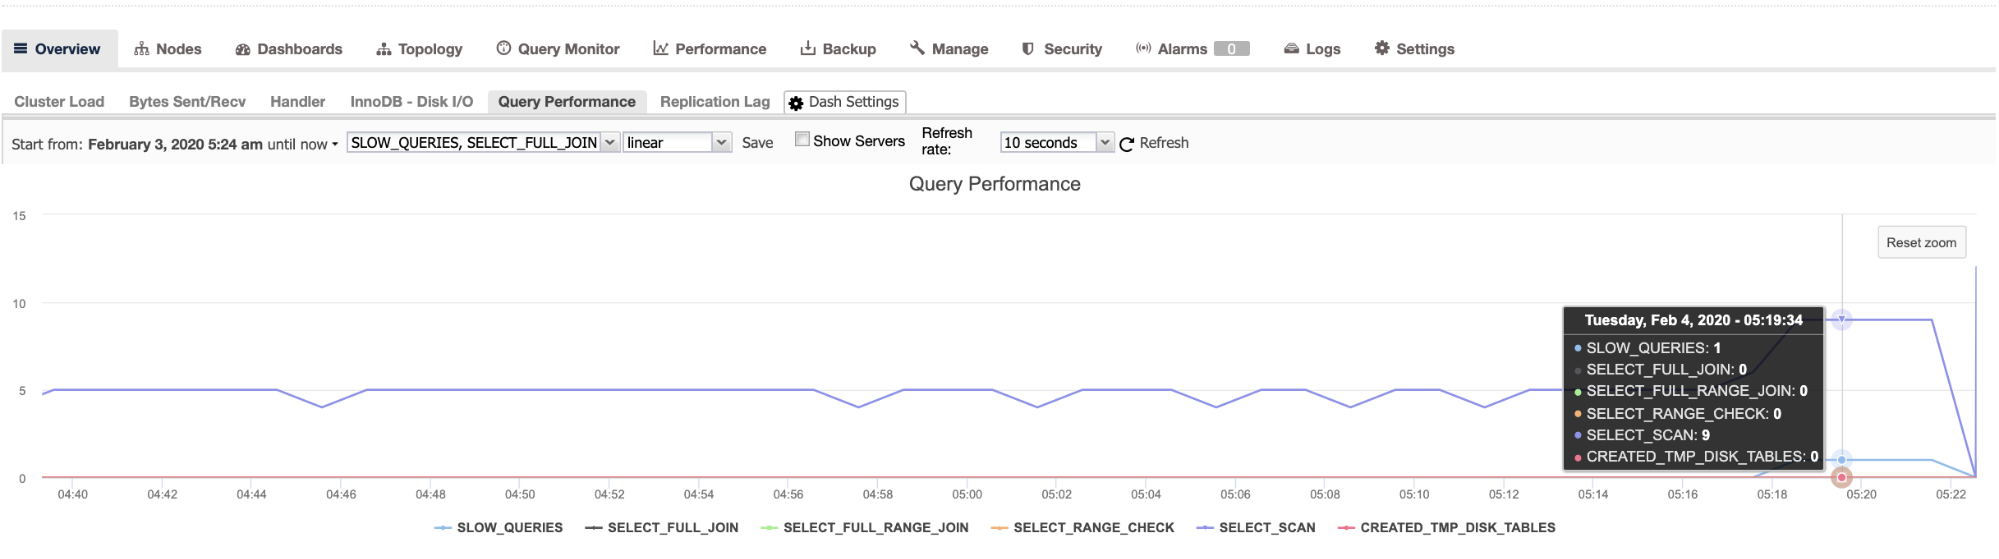
Of course, there are many metrics in MySQL. Here we will focus on the top important.
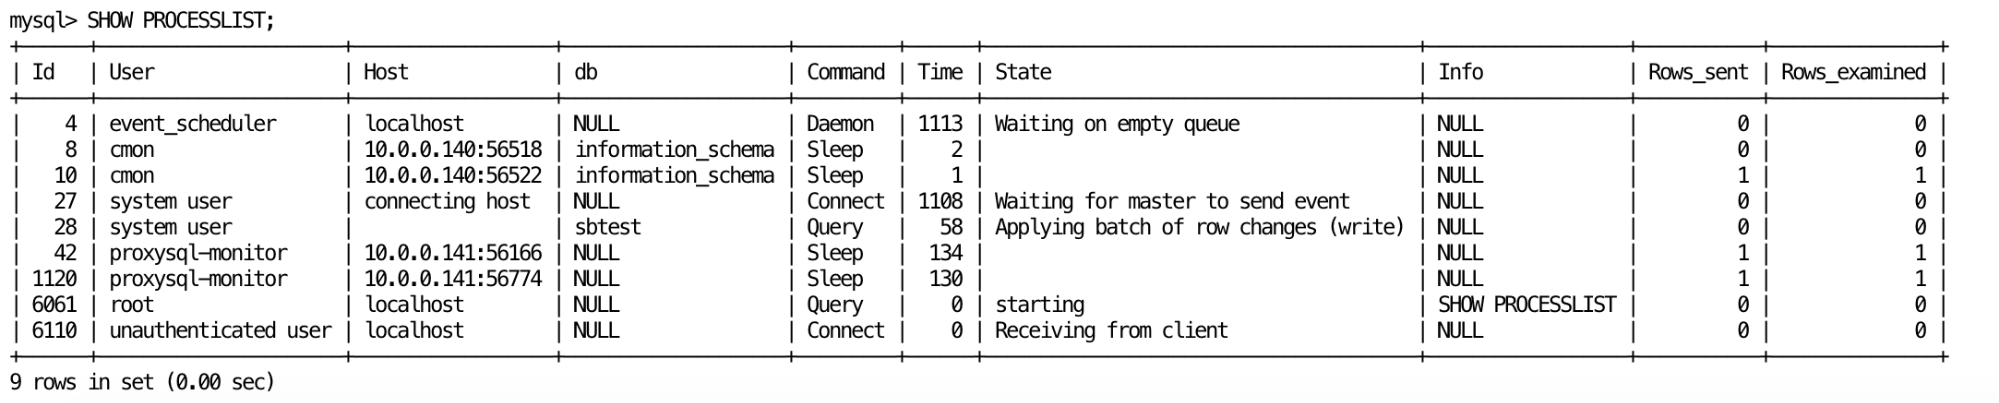
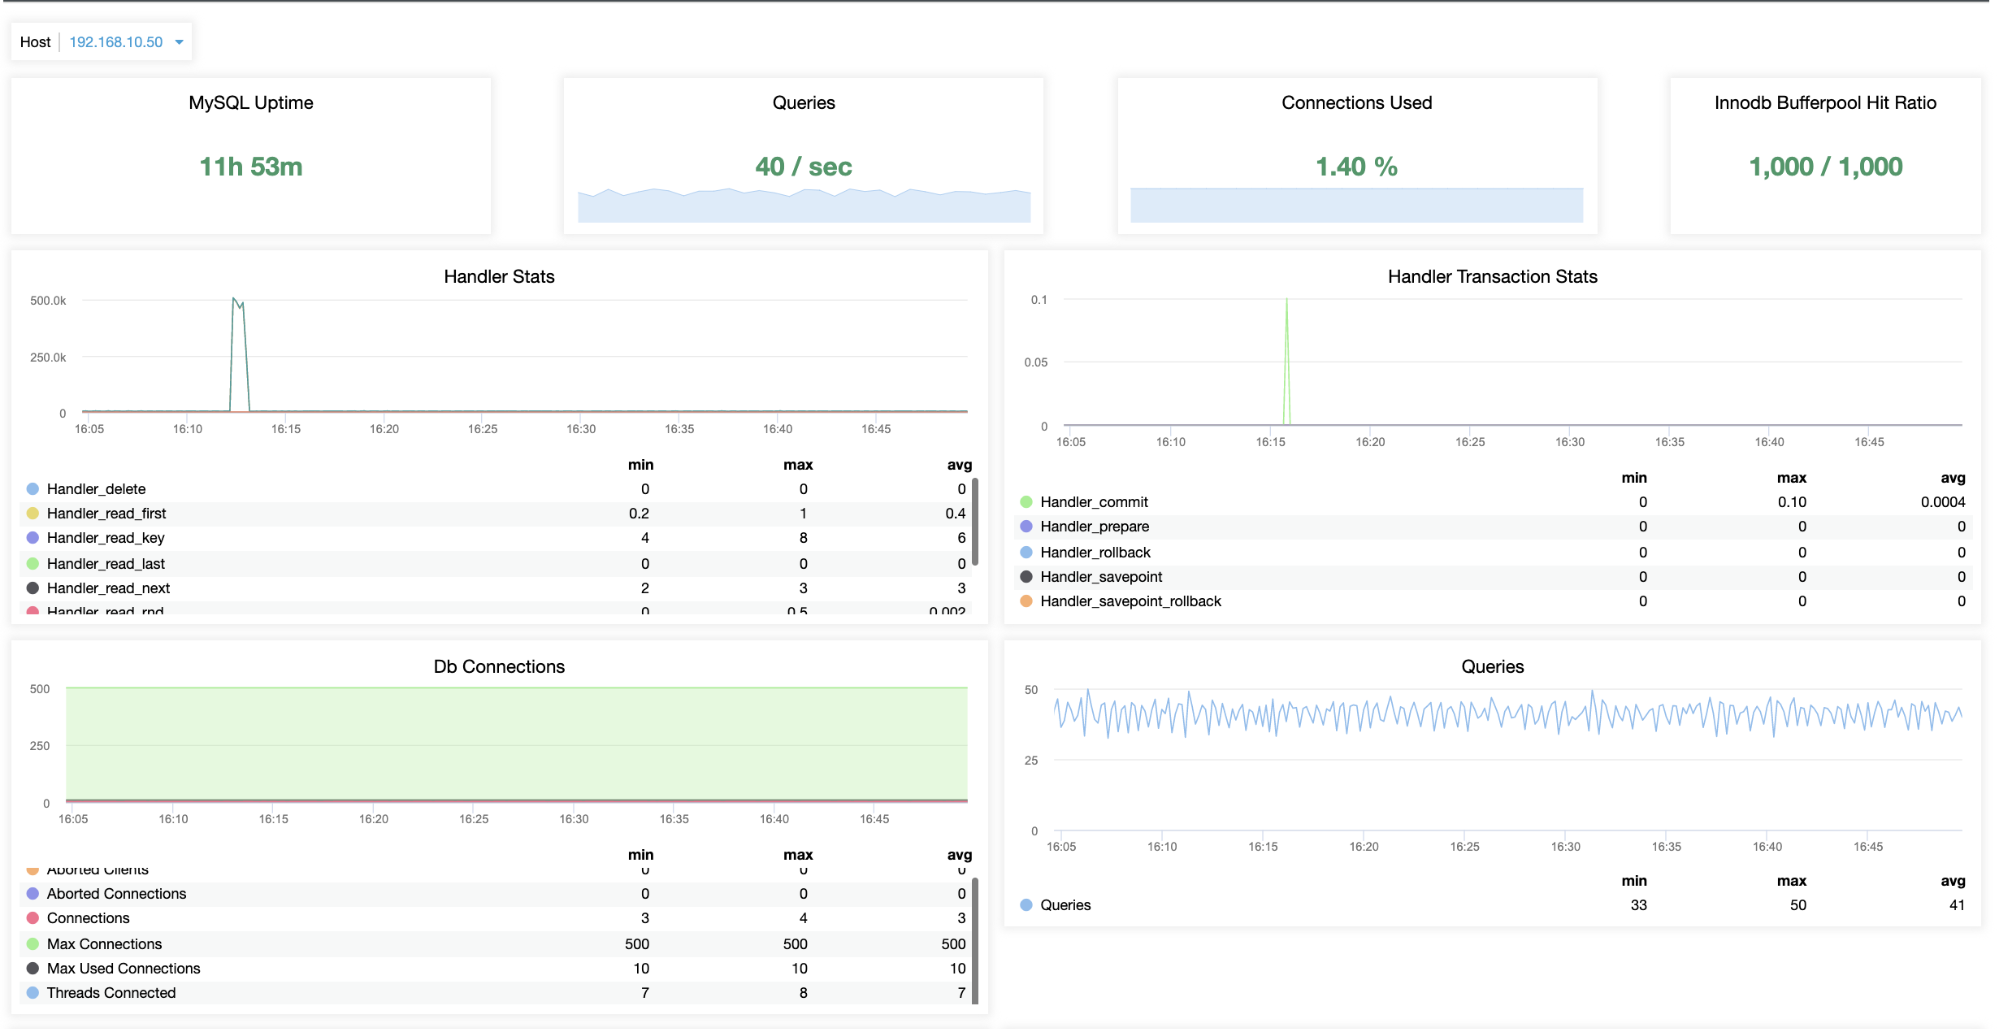
Monitoring Active Sessions
You should also track the number of active sessions and DB up down status. Often to understand the problem you need to see how long the database is running. so we can use this to detect respawns.
The next thing would be a number of sessions. If you are near the limit, you need to check if something is wrong or if you just need to increment the max_connections value. The difference in the number can be an increase or decrease of connections. Improper usage of connection pooling, locking or network issues are the most common problems related to the number of connections.
The key values here are
- Uptime
- Threads_connected
- Max_used_connections
- Aborted_connects
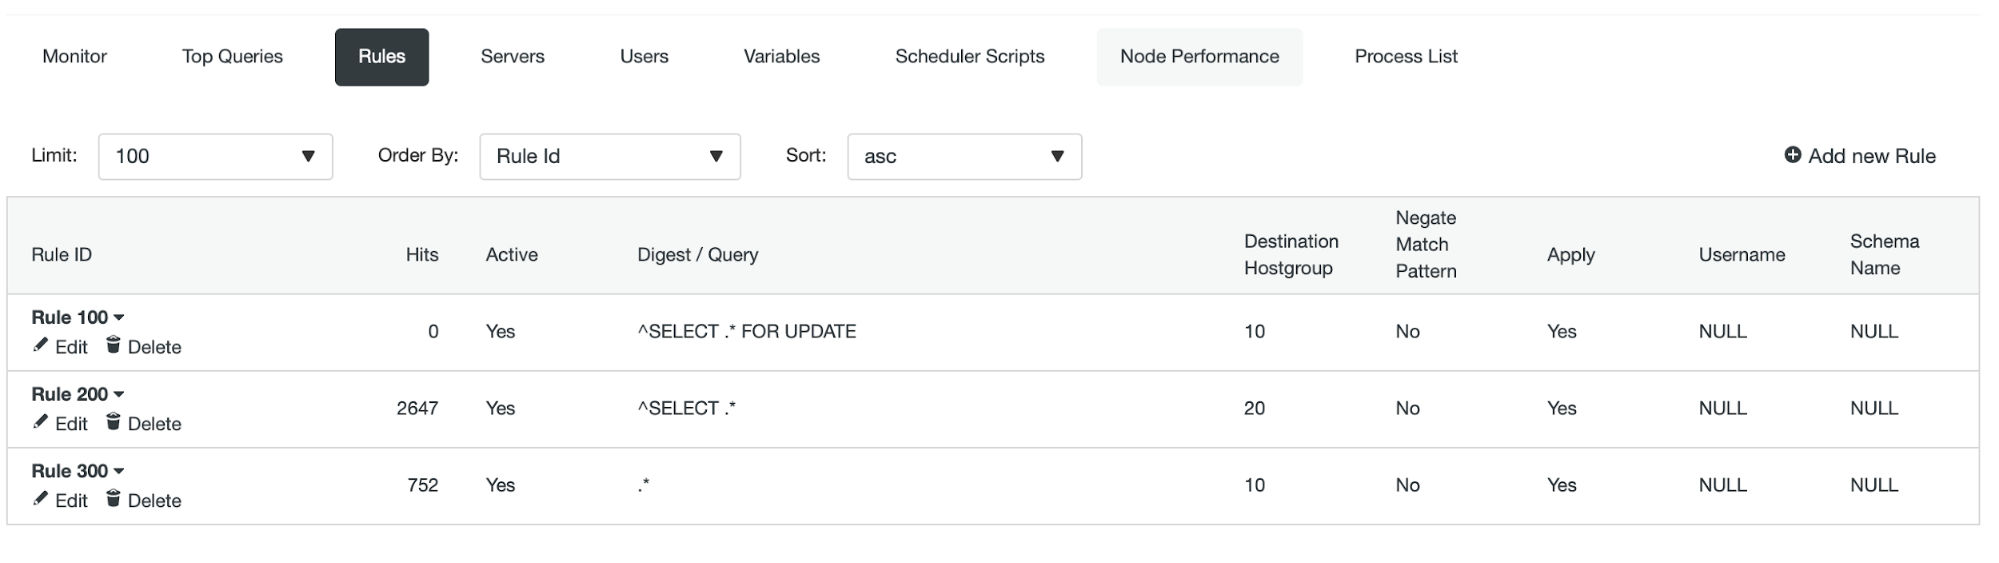
Database Locks
If you have a query waiting for another query, you need to check if that another query is a normal process or something new. In some cases, if somebody is making an update on a big table, for example, this action can be affecting the normal behavior of your database, generating a high number of locks.
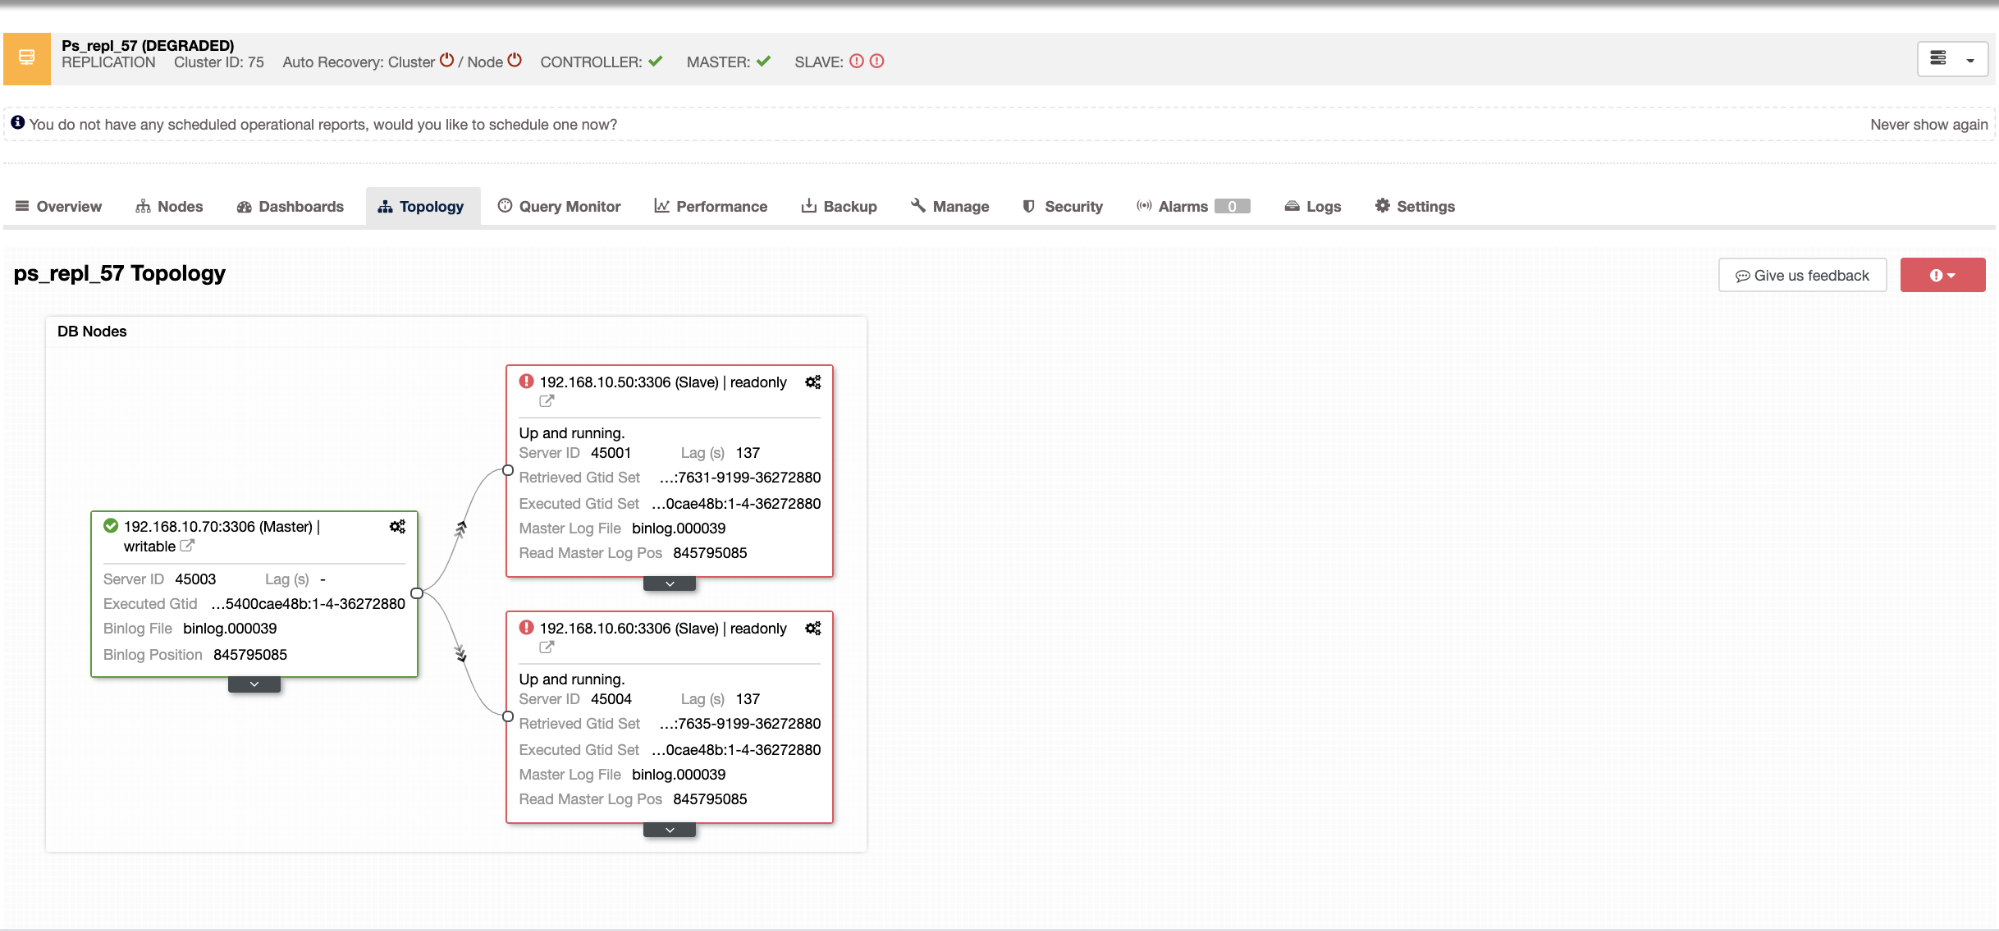
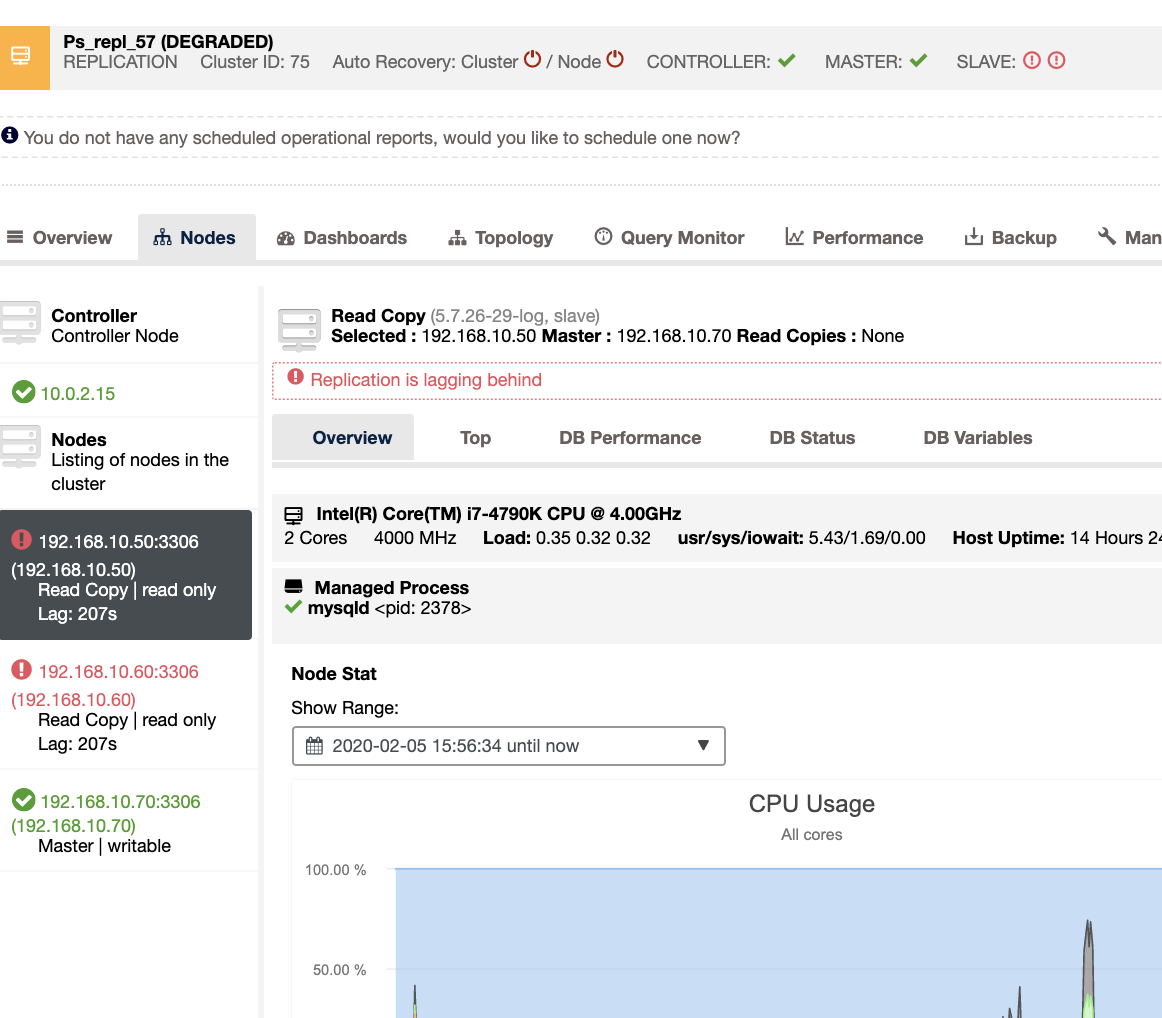
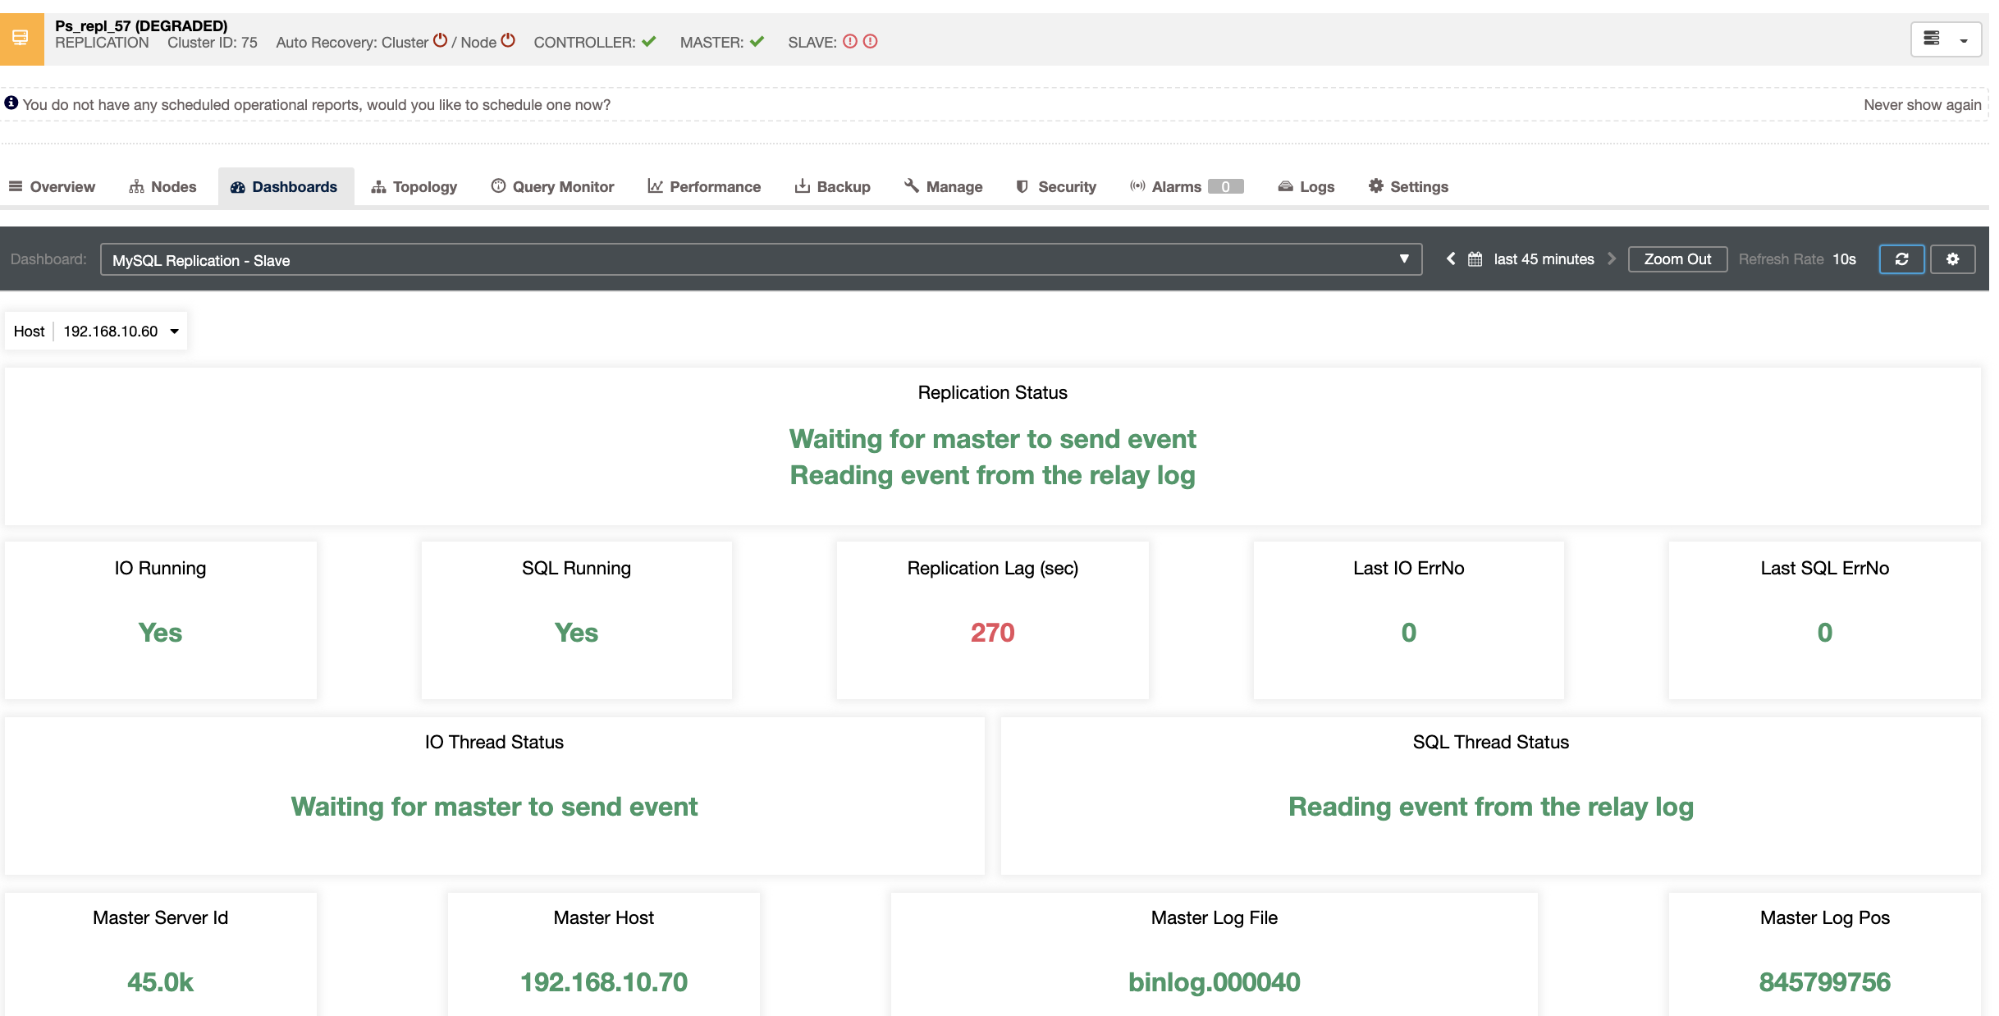
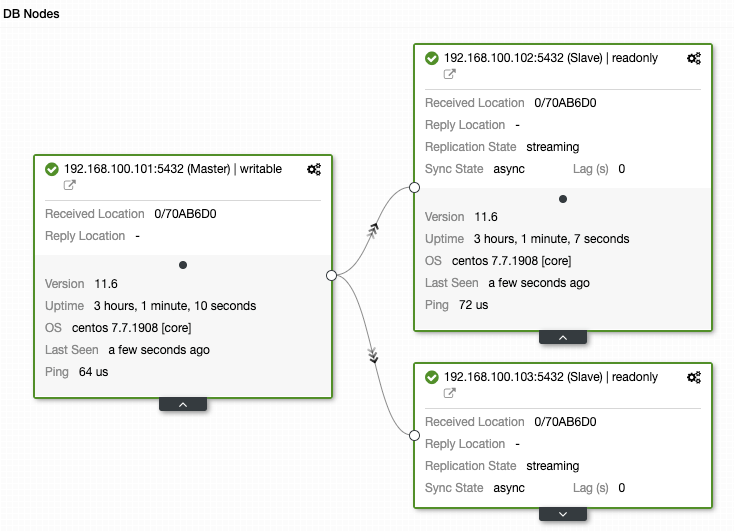
Monitoring Replication
The key metrics to monitor for replication are the lag and the replication state. Not only the up down status but also the lag because a continuous increase in this value is not a very good sign as it means that the slave is not able to catch up with its master.
The most common issues are networking issues, hardware resource issues, or under dimensioning issues. If you are facing a replication issue you will need to know this asap as you will need to fix it to ensure the high availability environment.
Replication is best monitored by checking SLAVE STATUS and the following parameters:
- SLAVE_RUNNING
- SLAVE_IO_Running
- SLAVE_SQL_RUNNING
- LAST_SQL_ERRNO
- SECONDS_BEHIND_MASTER
Backups
Unfortunately, the vanilla community edition doesn't come with the backup manager. You should know if the backup was completed, and if it’s usable. Usually, this last point is not taken into account, but it’s probably the most critical check in a backup process. Here we would have to use external tools like percona-xtrabackup or ClusterControl.
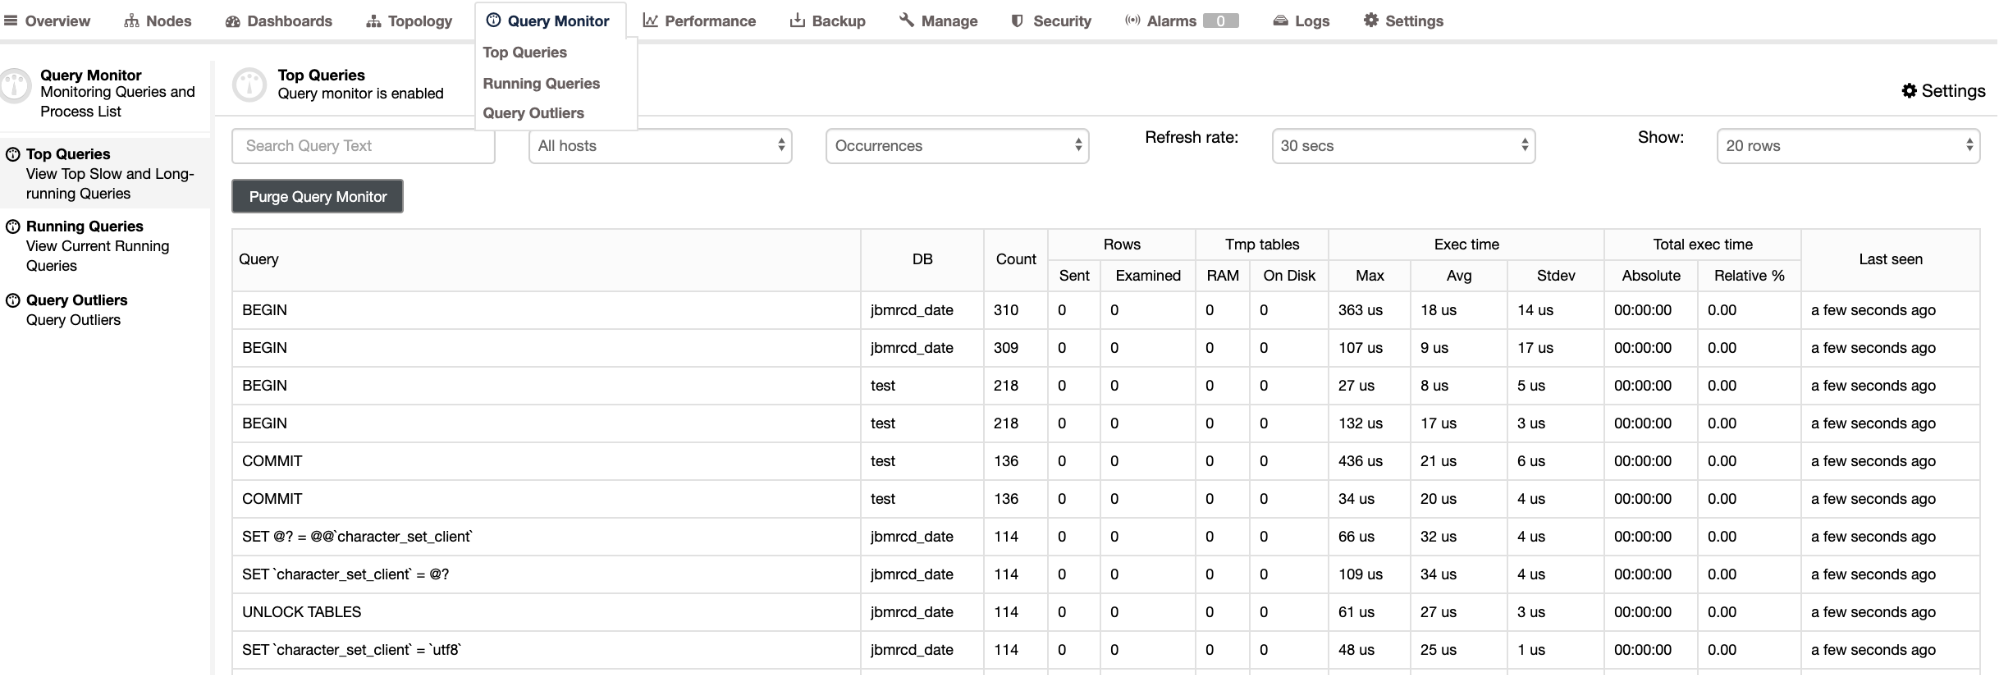
Database Logs
You should monitor your database log for errors like FATAL or deadlock, or even for common errors like authentication issues or long-running queries. Most of the errors are written in the log file with detailed useful information to fix it. Common failure points you need to keep an eye on are errors, log file sizes. The location of the error log can be found under the log_error variable.
External Tools
Last but not least you can find a list of useful tools to monitor your database activity.
Percona Toolkit - is the set of Linux tools from Percona to analyze MySQL and OS activities. You can find it here. It supports the most popular 64 bit Linux distributions like Debian, Ubuntu, and Redhat.
mysqladmin - mysqladmin is an administration program for the MySQL daemon. It can be used to check server health (ping), list the processes, see the values of the variables, but also do some administrative work like create/drop databases, flush (reset) logs, statistics, and tables, kill running queries, stop the server and control replication.
innotop - offers an extended view of SHOW statements. It's very powerful and can significantly reduce the investigation time. Among vanilla MySQL support, you can see the Galera view and Master-slave replication details.
mtop - monitors a MySQL server showing the queries which are taking the most amount of time to complete. Features include 'zooming' in on a process to show the complete query, 'explaining' the query optimizer information for a query and 'killing' queries. In addition, server performance statistics, configuration information, and tuning tips are provided.
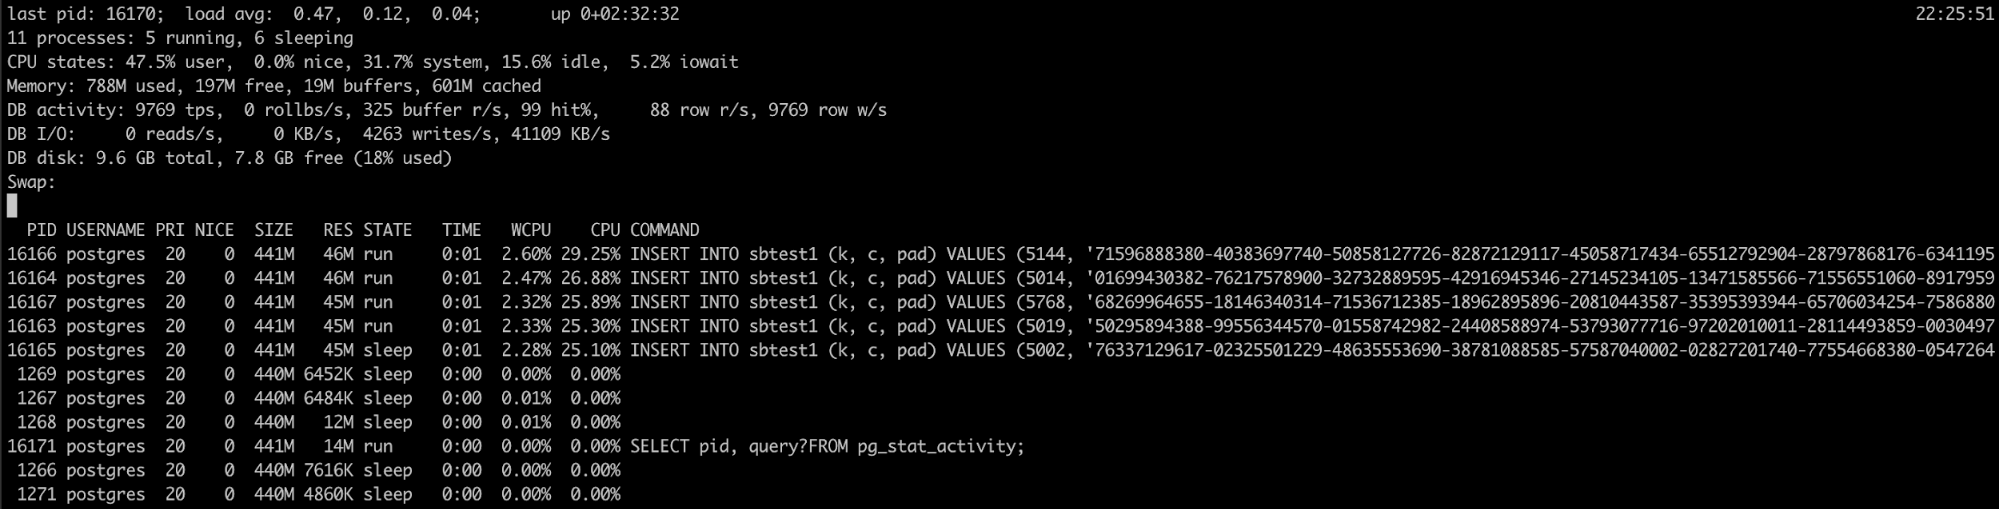
Mytop - runs in a terminal and displays statistics about threads, queries, slow queries, uptime, load, etc. in tabular format, much similar to the Linux
Conclusion
This blog is not intended to be an exhaustive guide to how to enhance database monitoring, but it hopefully gives a clearer picture of what things can become essential and some of the basic parameters that can be watched. Do not hesitate to let us know if we’ve missed any important ones in the comments below.