It is sometimes inevitable to run MySQL database servers on a public or exposed network. This is a common setup in a shared hosting environment, where a server is configured with multiple services and often running within the same server as the database server. For those who have this kind of setup, you should always have some kind of protection against cyberattacks like denial-of-service, hacking, cracking, data breaches; all which can result in data loss. These are things that we always want to avoid for our database server.
Here are some of the tips that we can do to improve our MySQL or MariaDB security.
Scan Your Database Servers Regularly
Protection against any malicious files in the server is very critical. Scan the server regularly to look for any viruses, spywares, malwares or rootkits especially if the database server is co-located with other services like mail server, HTTP, FTP, DNS, WebDAV, telnet and so on. Commonly, most of the database hacked issues originated from the application tier that is facing the public network. Thus, it's important to scan all files, especially web/application files since they are one of the entry points to get into the server. If those are compromised, the hacker can get into the application directory, and have the ability to read the application files. These might contain sensitive information, for instance, the database login credentials.
ClamAV is one of the most widely known and widely trusted antivirus solutions for a variety of operating systems, including Linux. It's free and very easy to install and comes with a fairly good detection mechanism to look for unwanted things in your server. Schedule periodic scans in the cron job, for example:
0 3 * * * /bin/freshclam ; /bin/clamscan / --recursive=yes -i > /tmp/clamav.log ; mail -s clamav_log_`hostname` monitor@mydomain.local < /tmp/clamav.logThe above will update the ClamAV virus database, scan all directories and files and send you an email on the status of the execution and report every day at 3 AM.
Use Stricter User Roles and Privileges
When creating a MySQL user, do not allow all hosts to access the MySQL server with wildcard host (%). You should scan your MySQL host and look for any wildcard host value, as shown in the following statement:
mysql> SELECT user,host FROM mysql.user WHERE host = '%';

+---------+------+

| user    | host |

+---------+------+

| myadmin | %    |

| sbtest  | % |

| user1   | % |

+---------+------+
From the above output, strict or remove all users that have only '%' value under Host column. Users that need to access the MySQL server remotely can be enforced to use SSH tunnelling method, which does not require remote host configuration for MySQL users. Most of the MySQL administration clients such as MySQL Workbench and HeidiSQL can be configured to connect to a MySQL server via SSH tunelling, therefore it's possible to completely eliminate remote connection for MySQL users.
Also, limit the SUPER privilege to only users from localhost, or connecting via UNIX socket file. Be more cautious when assigning FILE privilege to non-root users since it permits read and write files on the server using theLOAD DATA INFILE and SELECT ... INTO OUTFILE statements. Any user to whom this privilege is granted can also read or write any file that the MySQL server can read or write.
Change the Database Default Settings
By moving away from the default setup, naming and configurations, we can reduce the attack vector to a number of folds. The following actions are some examples on default configurations that DBAs could easily change but commonly overlooked related to MySQL:
- Change default MySQL port to other than 3306.
- Rename the MySQL root username to other than "root".
- Enforce password expiration and reduce the password lifetime for all users.
- If MySQL is co-located with the application servers, enforce connection through UNIX socket file only, and stop listening on port 3306 for all IP addresses.
- Enforce client-server encryption and server-server replication encryption.
We actually have covered this in detail in this blog post, How to Secure MySQL/MariaDB Servers.
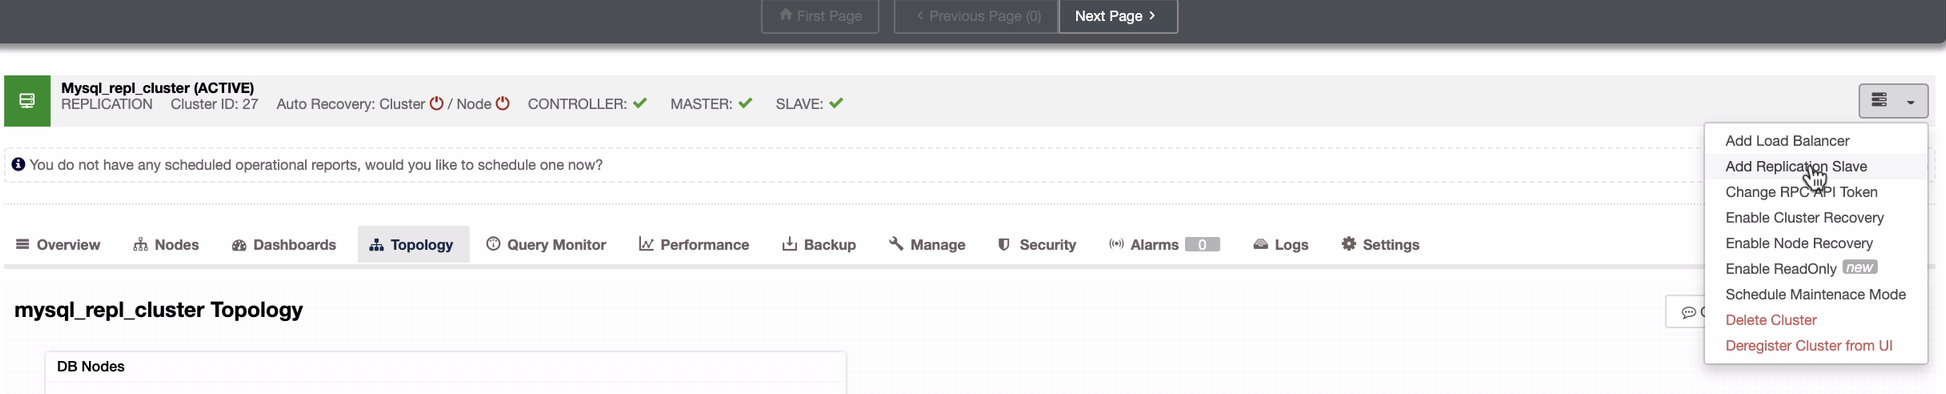
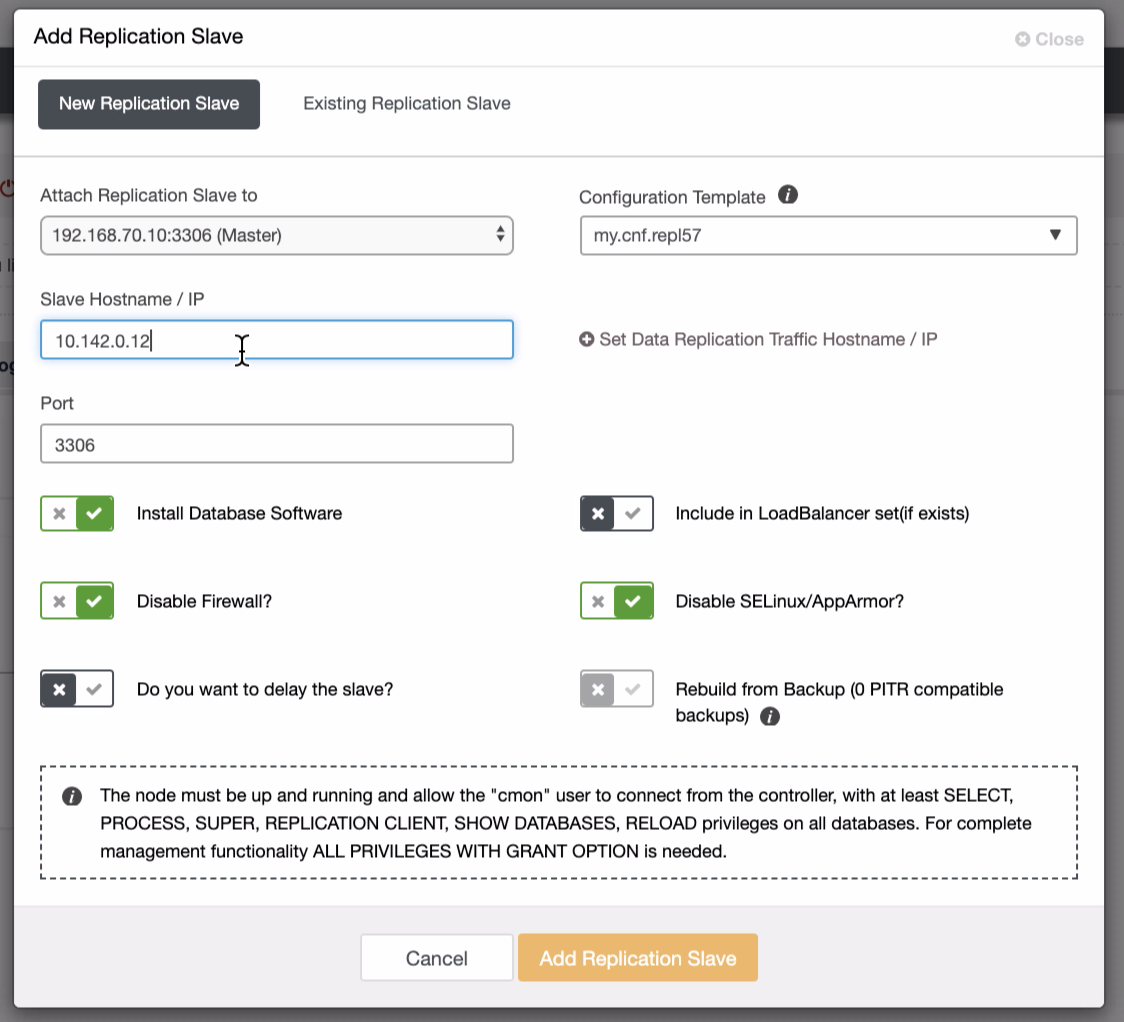
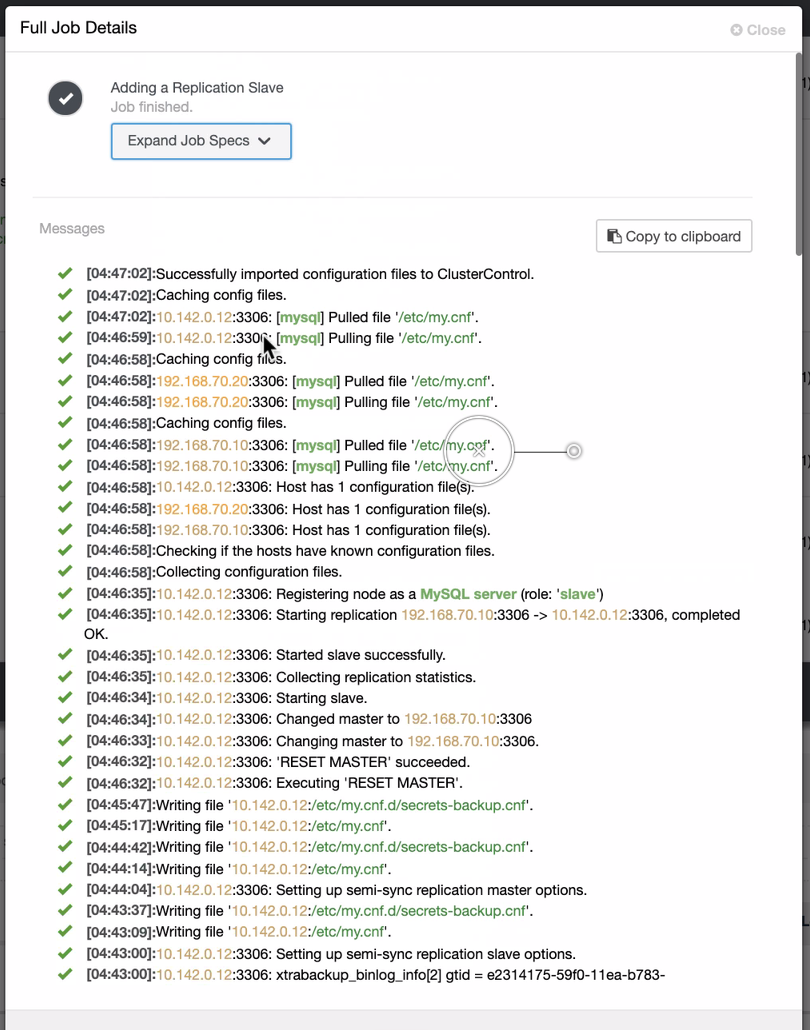
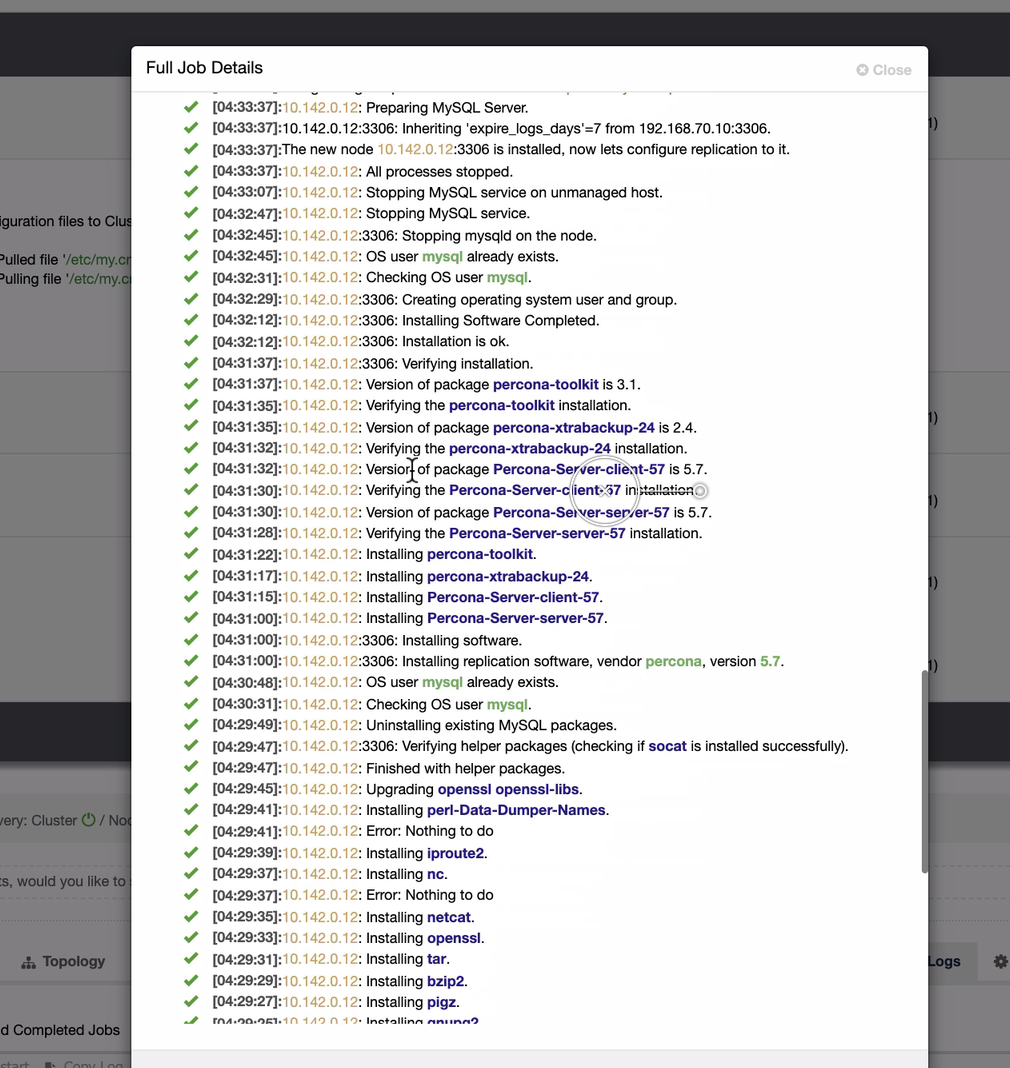
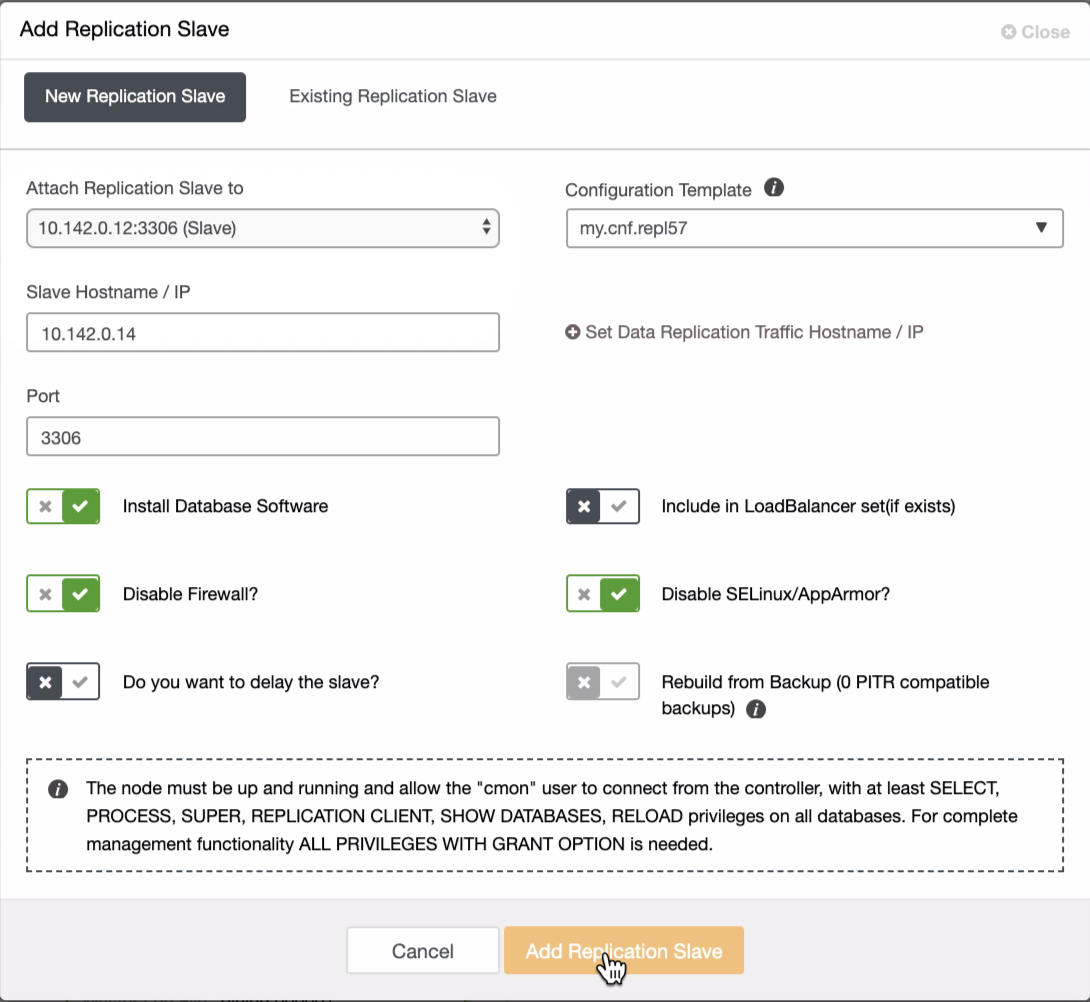
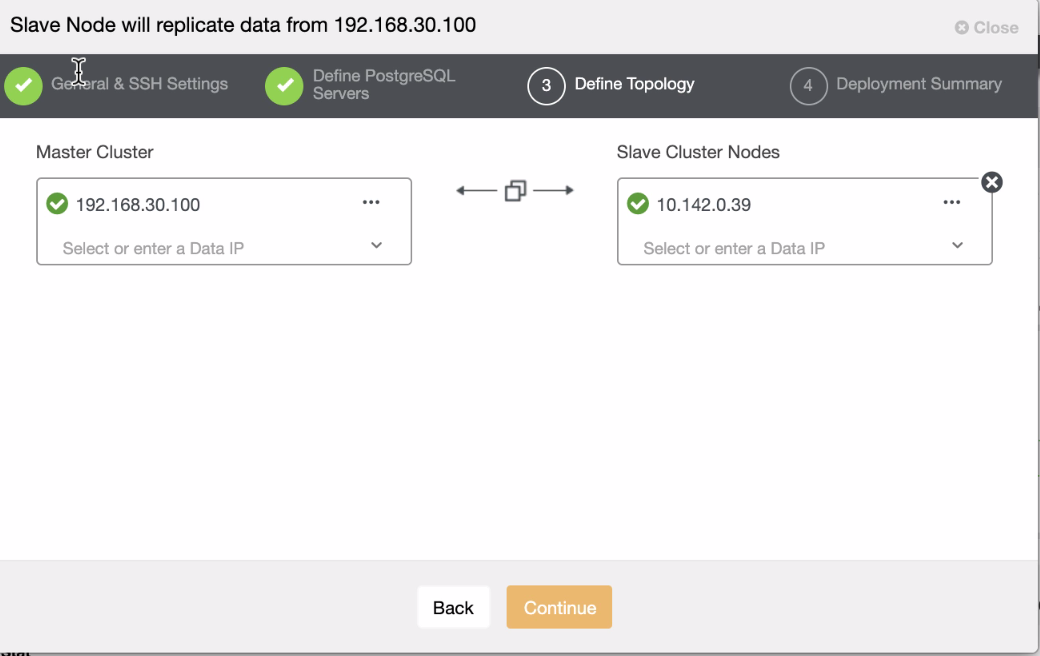
Setup a Delayed Slave
A delayed slave is just a typical slave, however the slave server intentionally executes transactions later than the master by at least a specified amount of time, available from MySQL 5.6. Basically, an event received from the master is not executed until at least N seconds later than its execution on the master. The result is that the slave will reflect the state of the master some time back in the past.
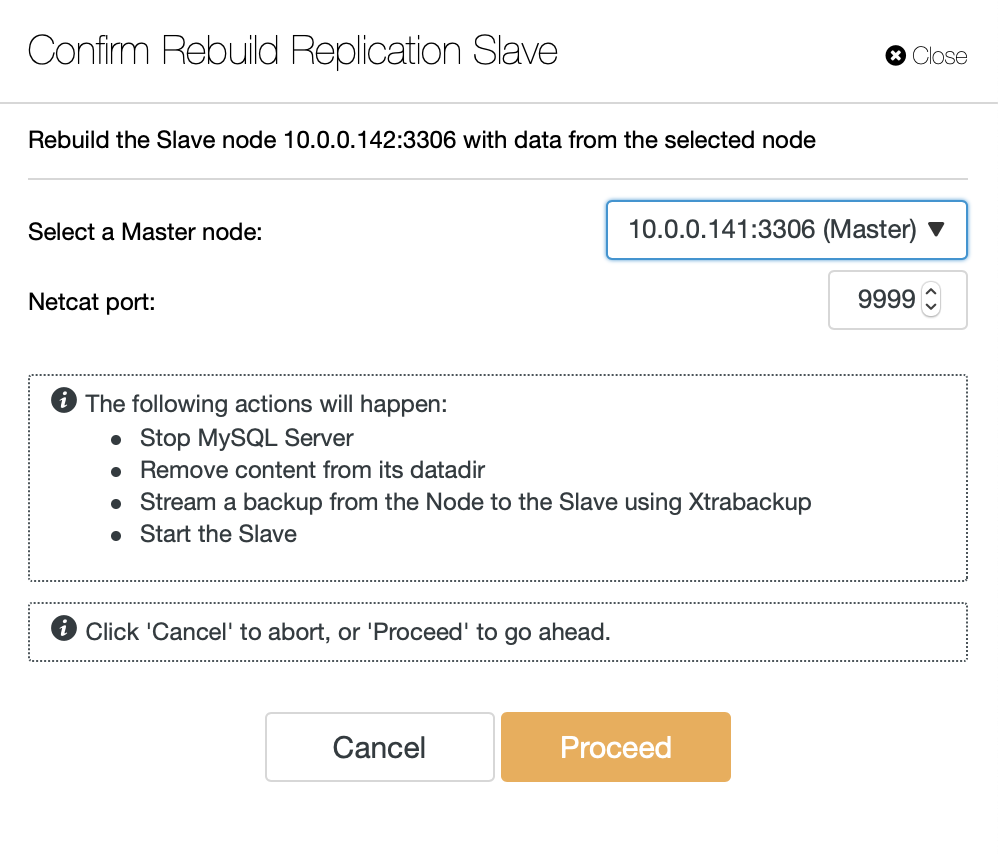
A delayed slave can be used to recover data, which would be helpful when the problem is found immediately, within the period of delay. Suppose we configured a slave with a 6-hour delay from the master. If our database were modified or deleted (accidentally by a developer or deliberately by a hacker) within this time range, there is a possibility for us to revert to the moment right before it happened by stopping the current master, then remove the delay on the slave server up until certain point with the following command:
START SLAVE UNTIL MASTER_LOG_FILE='xxxxx', MASTER_LOG_POS=yyyyyy;And then promote the slave to become the new master. This method is probably the fastest way to recover your MySQL database in production environment without having to reload a backup. Having a number of delayed slaves with different length durations, as shown in this blog, Multiple Delayed Replication Slaves for Disaster Recovery with Low RTO on how to set up a cost-effective delayed replication servers on top of Docker containers.
Enable Binary Logging
Binary logging is generally recommended to be enabled even though you are running on a standalone MySQL/MariaDB server. The binary log contains information about SQL statements that modify database contents. The information is stored in the form of “events” that describe the modifications. Despite performance impact, having binary log allows you to have the possibility to replay your database server to the exact point where you want it to be restored, also known as point-in-time recovery (PITR). Binary logging is also mandatory for replication.
With binary logging enabled, one has to include the binary log file and position information when taking up a full backup. For mysqldump, using the --master-data flag with value 1 or 2 will print out the necessary information that we can use as a starting point to roll forward the database when replaying the binary logs later on.
With binary logging enabled, you can use another cool recovery feature called flashback, which is described in the next section.
Enable Flashback
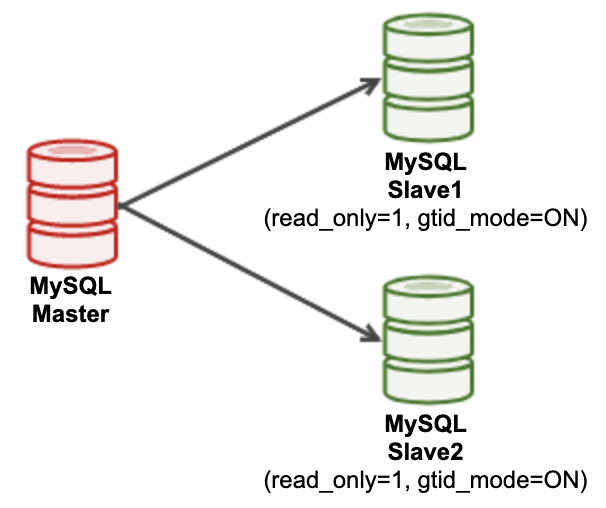
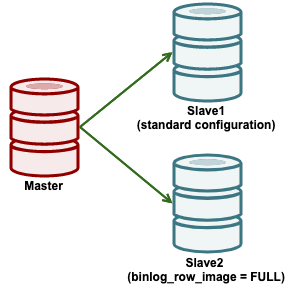
The flashback feature is available in MariaDB, where you can restore back the data to the previous snapshot in a MySQL database or in a table. Flashback uses the mysqlbinlog to create the rollback statements and it needs a FULL binary log row image for that. Thus, to use this feature, the MySQL/MariaDB server must be configured with the following:
[mysqld]
...
binlog_format = ROW
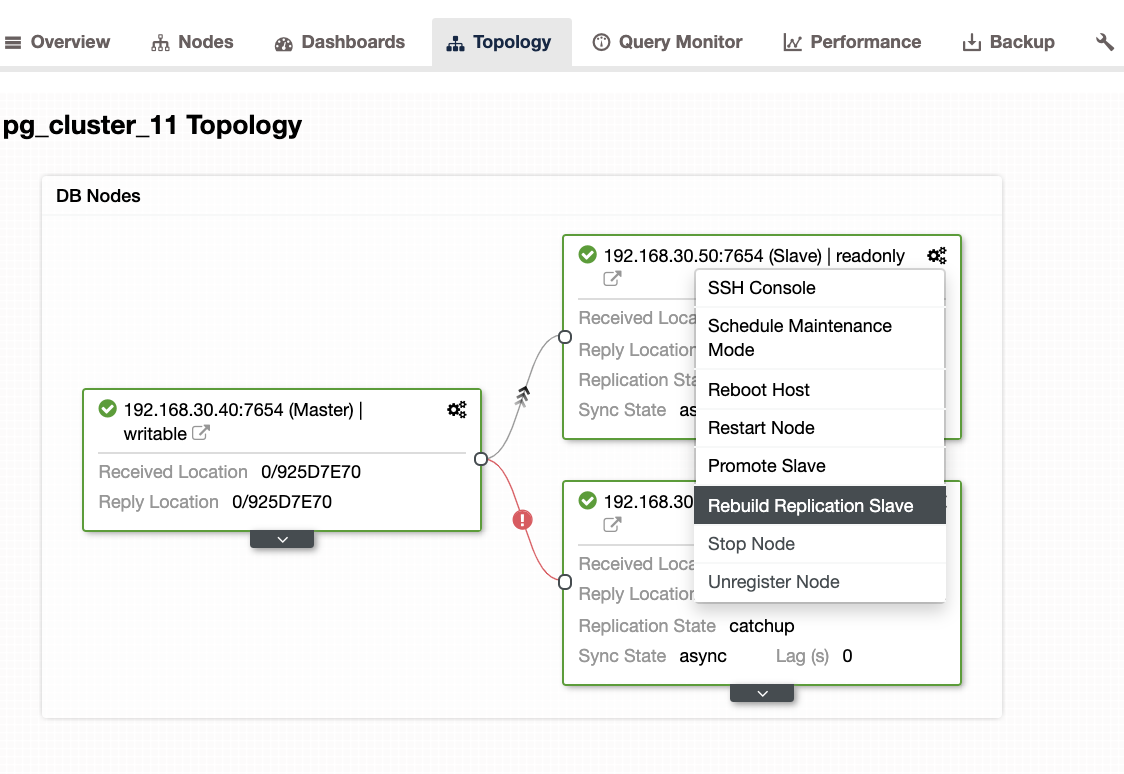
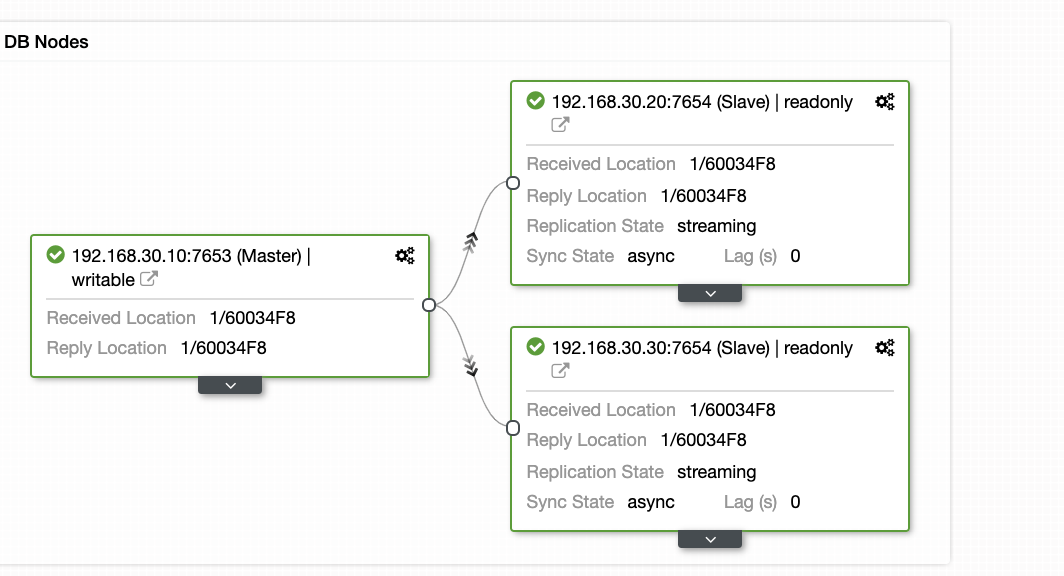
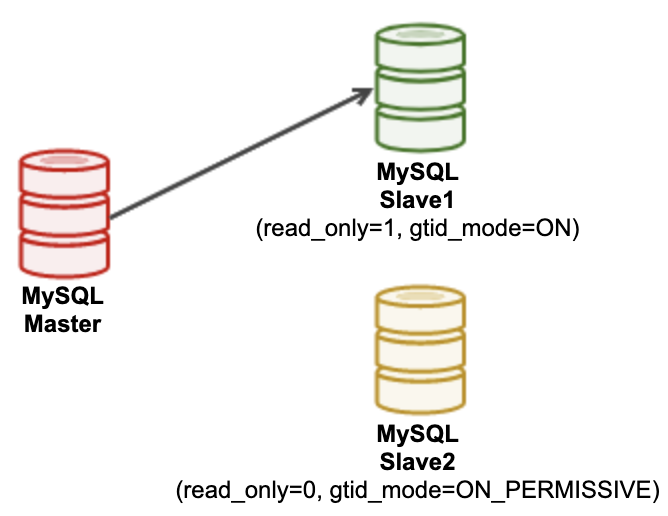
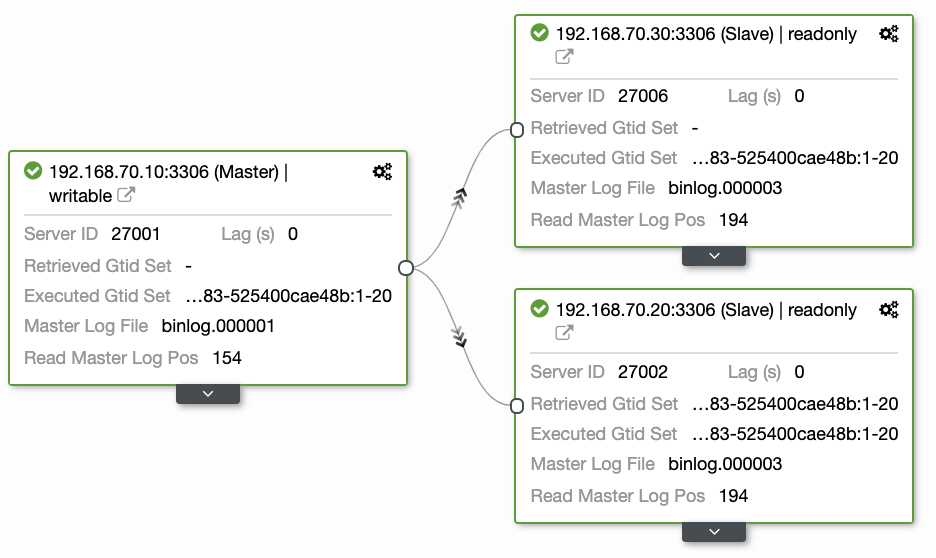
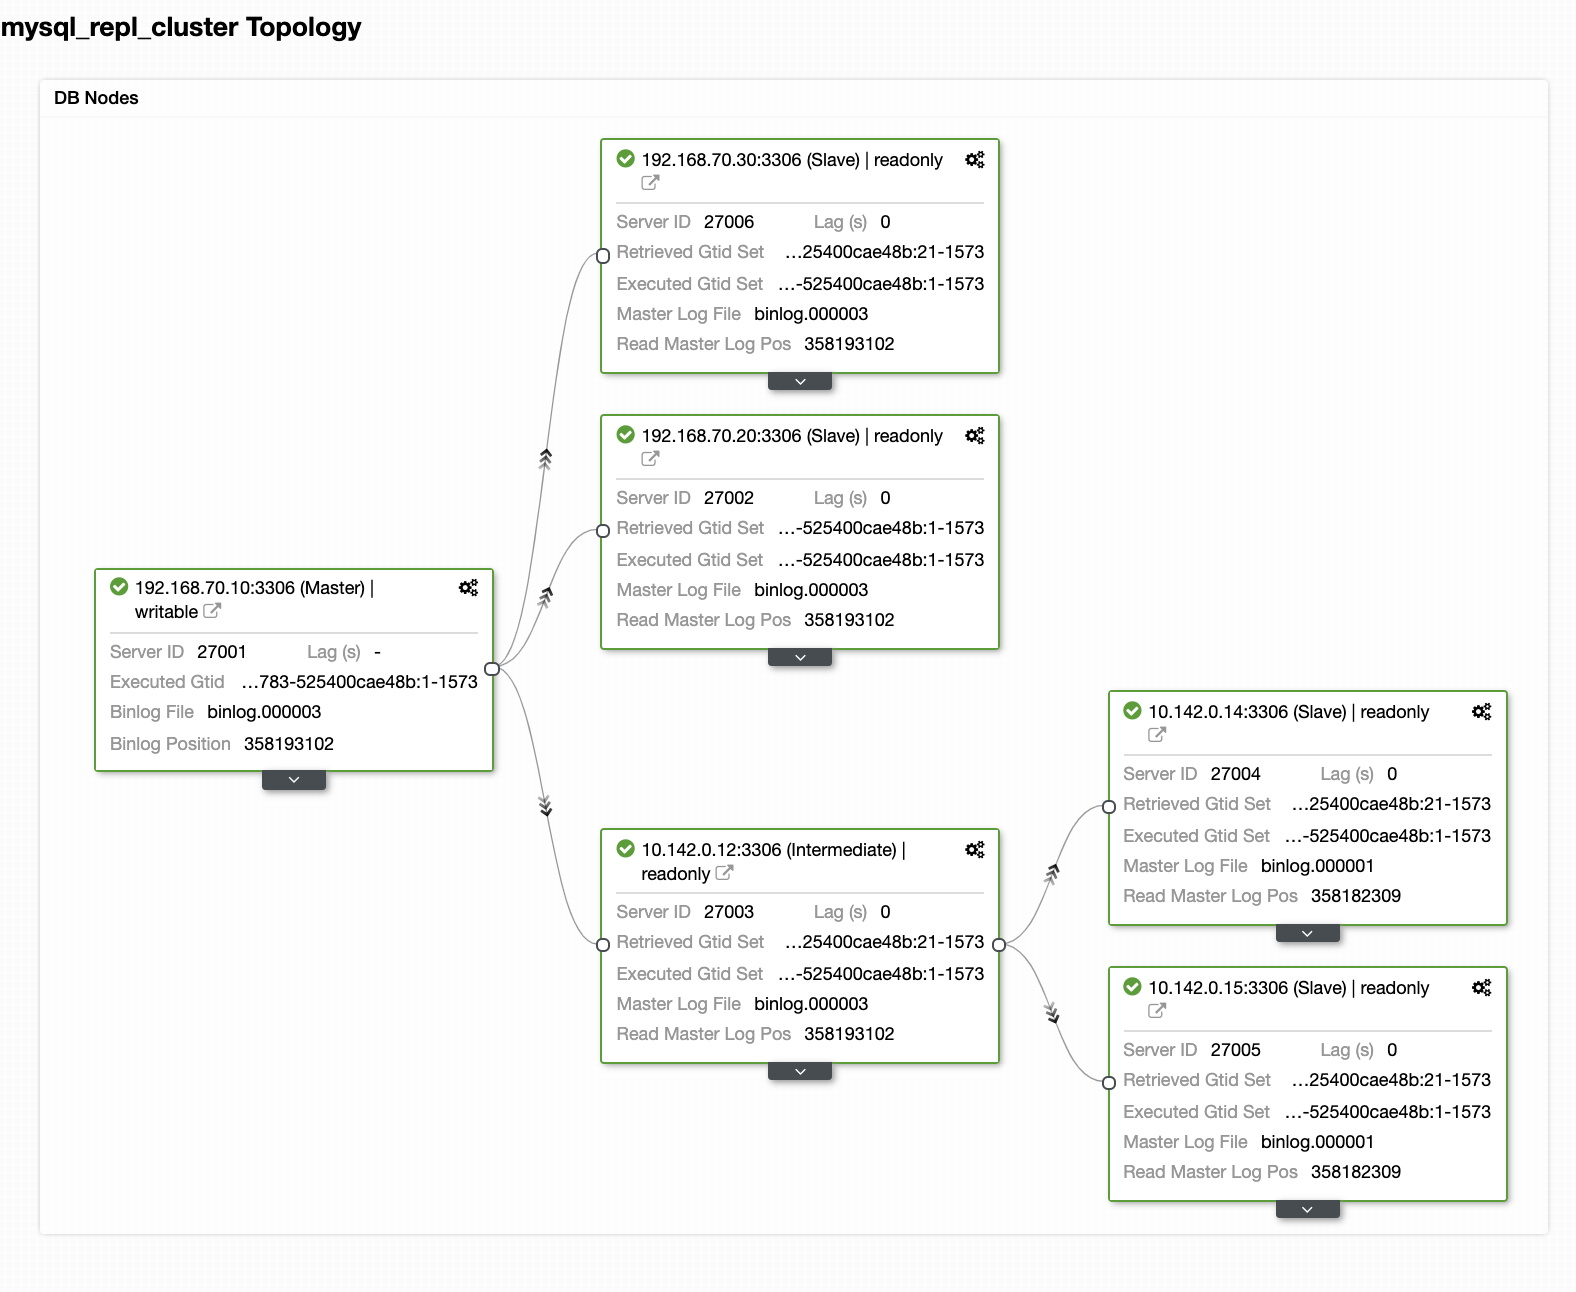
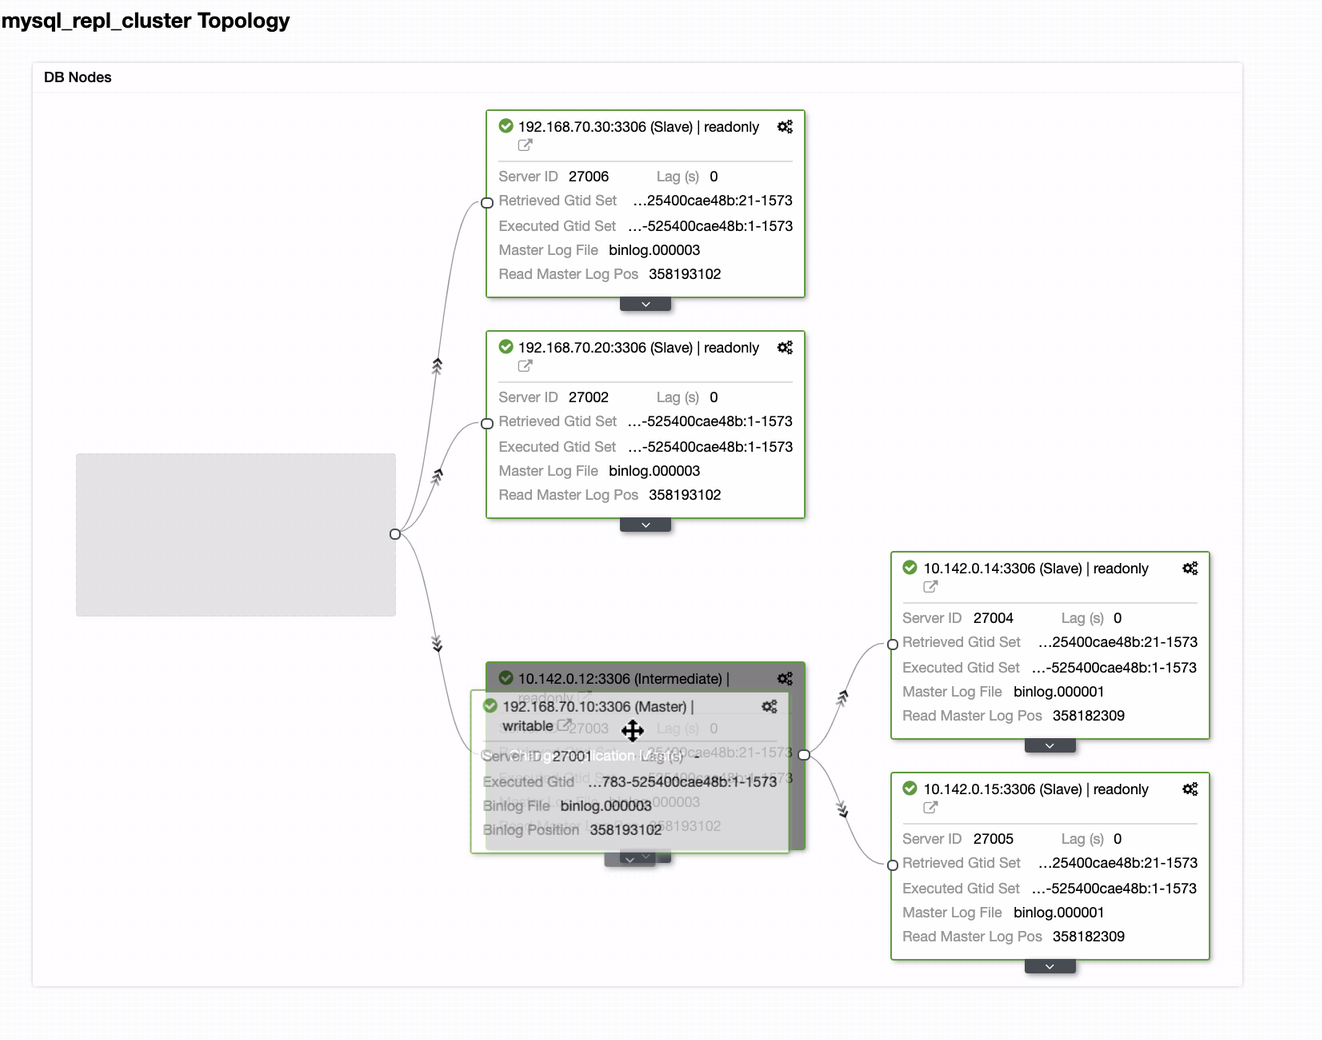
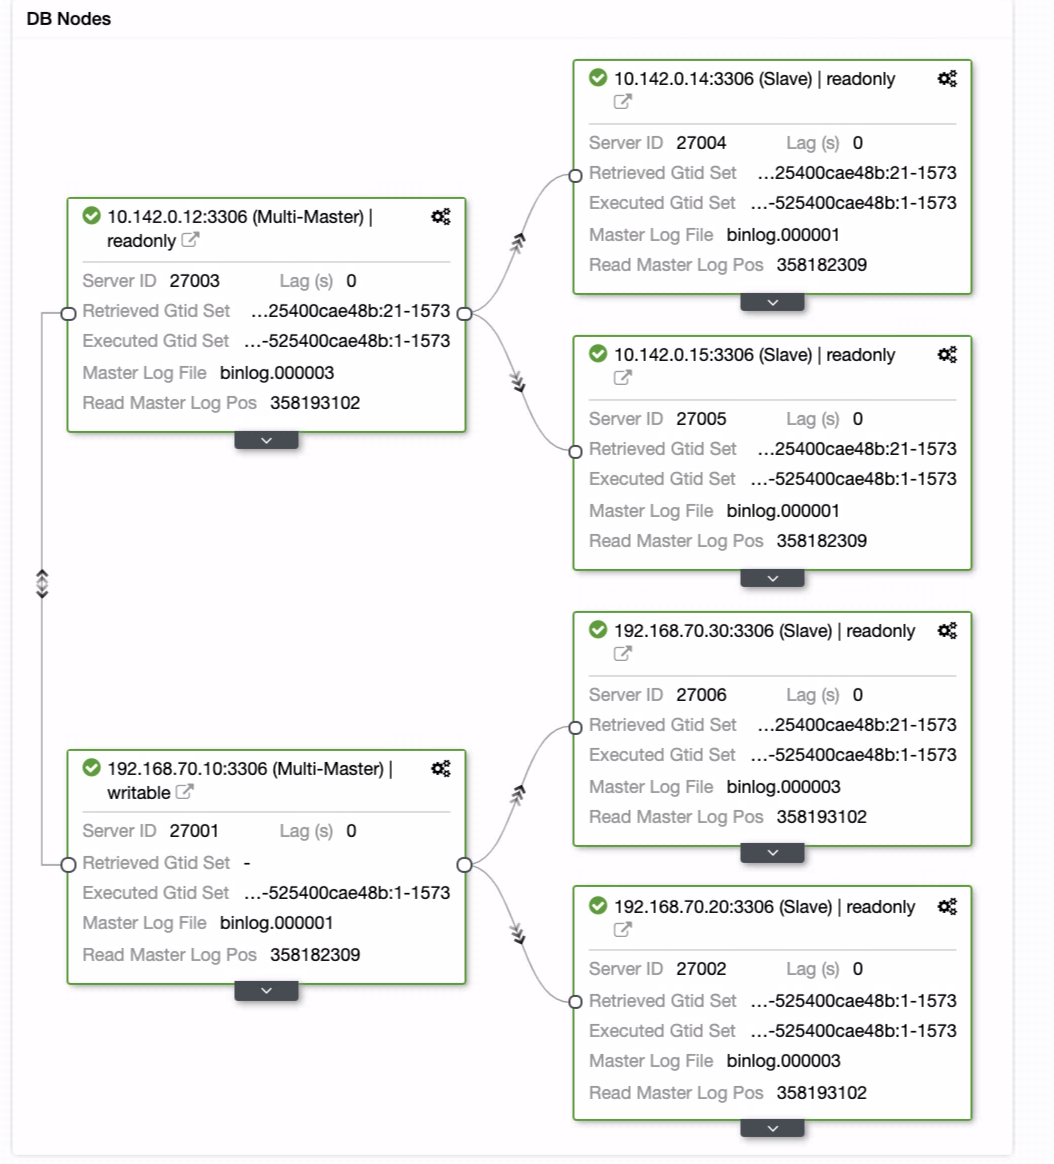
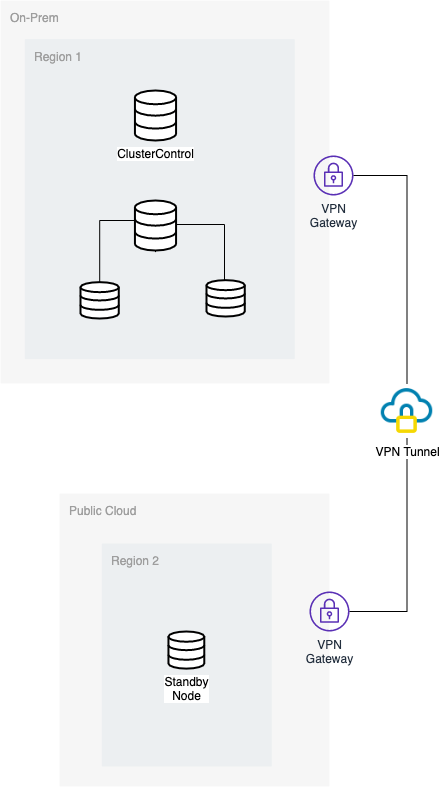
binlog_row_image = FULLThe following architecture diagram illustrates how flashback is configured on one of the slave:
To perform the flashback operation, firstly you have to determine the date and time when you want to "see" the data, or binary log file and position. Then, use the --flashback flag with mysqlbinlog utility to generate SQL statements to rollback the data to that point. In the generated SQL file, you will notice that the DELETE events are converted to INSERTs and vice versa, and also it swaps WHERE and SET parts of the UPDATE events.
The following command line should be executed on the slave2 (configured with binlog_row_image=FULL):
$ mysqlbinlog --flashback --start-datetime="2020-02-17 01:30:00" /var/lib/mysql/mysql-bin.000028 -v --database=shop --table=products > flashback_to_2020-02-17_013000.sqlThen, detach slave2 from the replication chain because we are going to break it and use the server to rollback our data:
mysql> STOP SLAVE;

mysql> RESET MASTER;

mysql> RESET SLAVE ALL;
Finally, import the generated SQL file into the MariaDB server for database shop on slave2:
$ mysql -u root -p shop < flashback_to_2020-02-17_013000.sqlWhen the above is applied, the table "products" will be at the state of 2020-02-17 01:30:00. Technically, the generated SQL file can be applied to both MariaDB and MySQL servers. You could also transfer the mysqlbinlog binary from MariaDB server so you can use the flashback feature on a MySQL server. However, MySQL GTID implementation is different than MariaDB thus restoring the SQL file requires you to disable MySQL GTID.
A couple of advantages using flashback is you do not need to stop the MySQL/MariaDB server to carry out this operation. When the amount of data to revert is small, the flashback process is much faster than recovering the data from a full backup.
Log All Database Queries
General log basically captures every SQL statement being executed by the client in the MySQL server. However, this might not be a popular decision on a busy production server due to the performance impact and space consumption. If performance matters, binary log has the higher priority to be enabled. General log can be enabled during runtime by running the following commands:
mysql> SET global general_log_file='/tmp/mysql.log';

mysql> SET global log_output = 'file';

mysql> SET global general_log = ON;
You can also set the general log output to a table:
mysql> SET global log_output = 'table';You can then use the standard SELECT statement against the mysql.general_log table to retrieve queries. Do expect a bit more performance impact when running with this configuration as shown in this blog post.
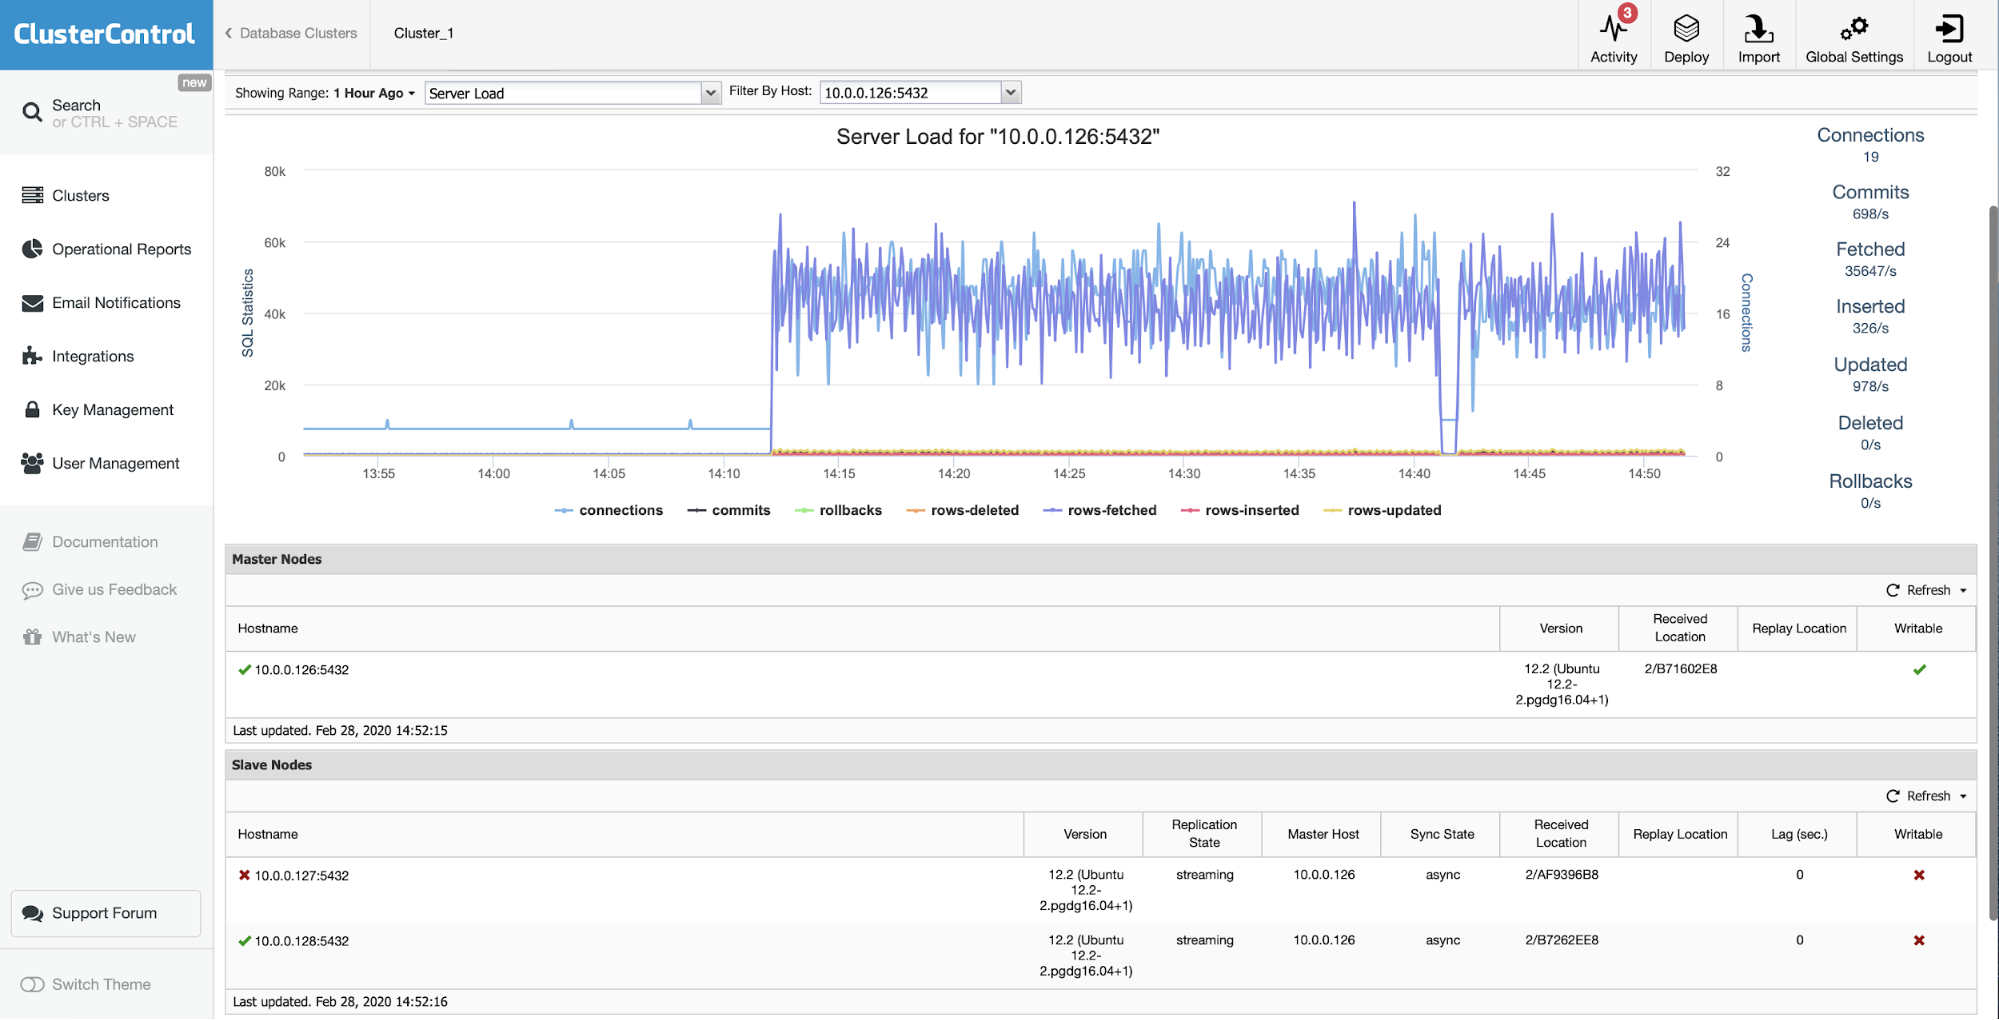
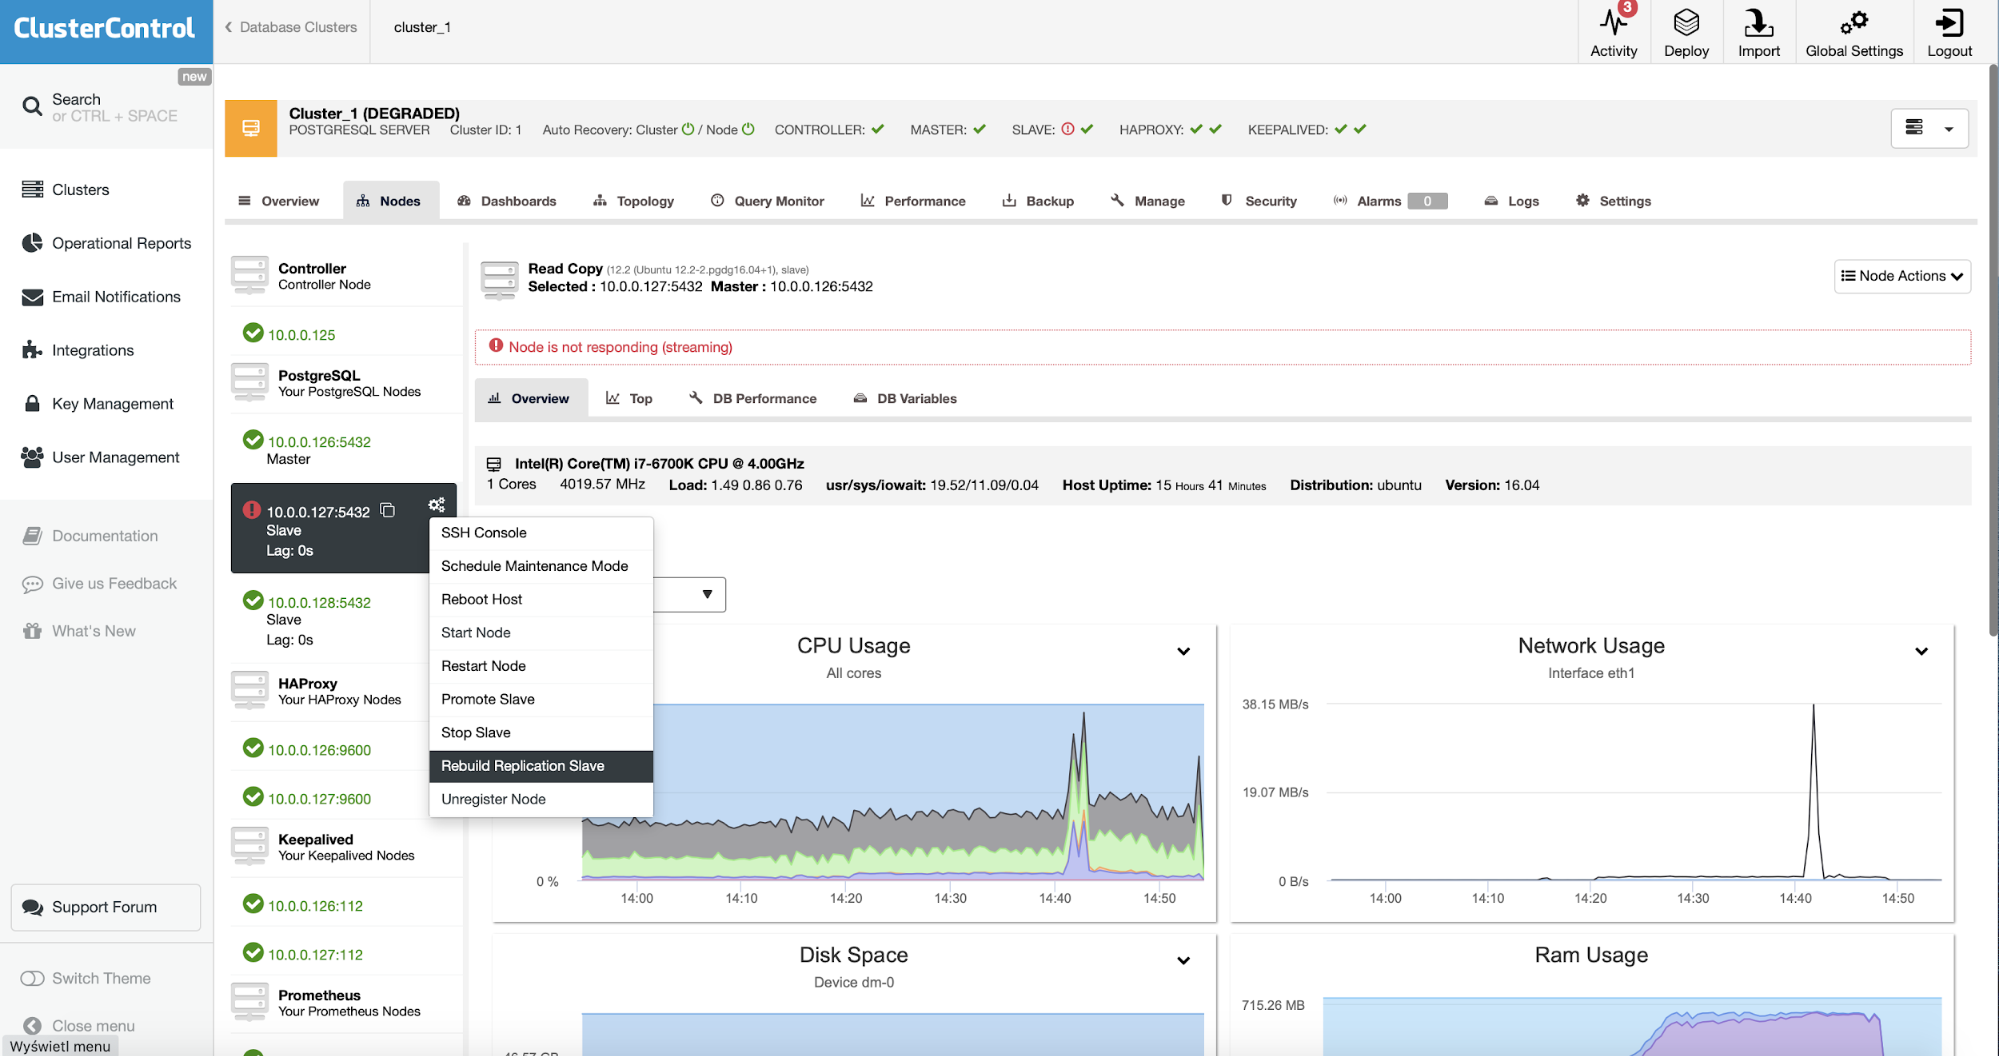
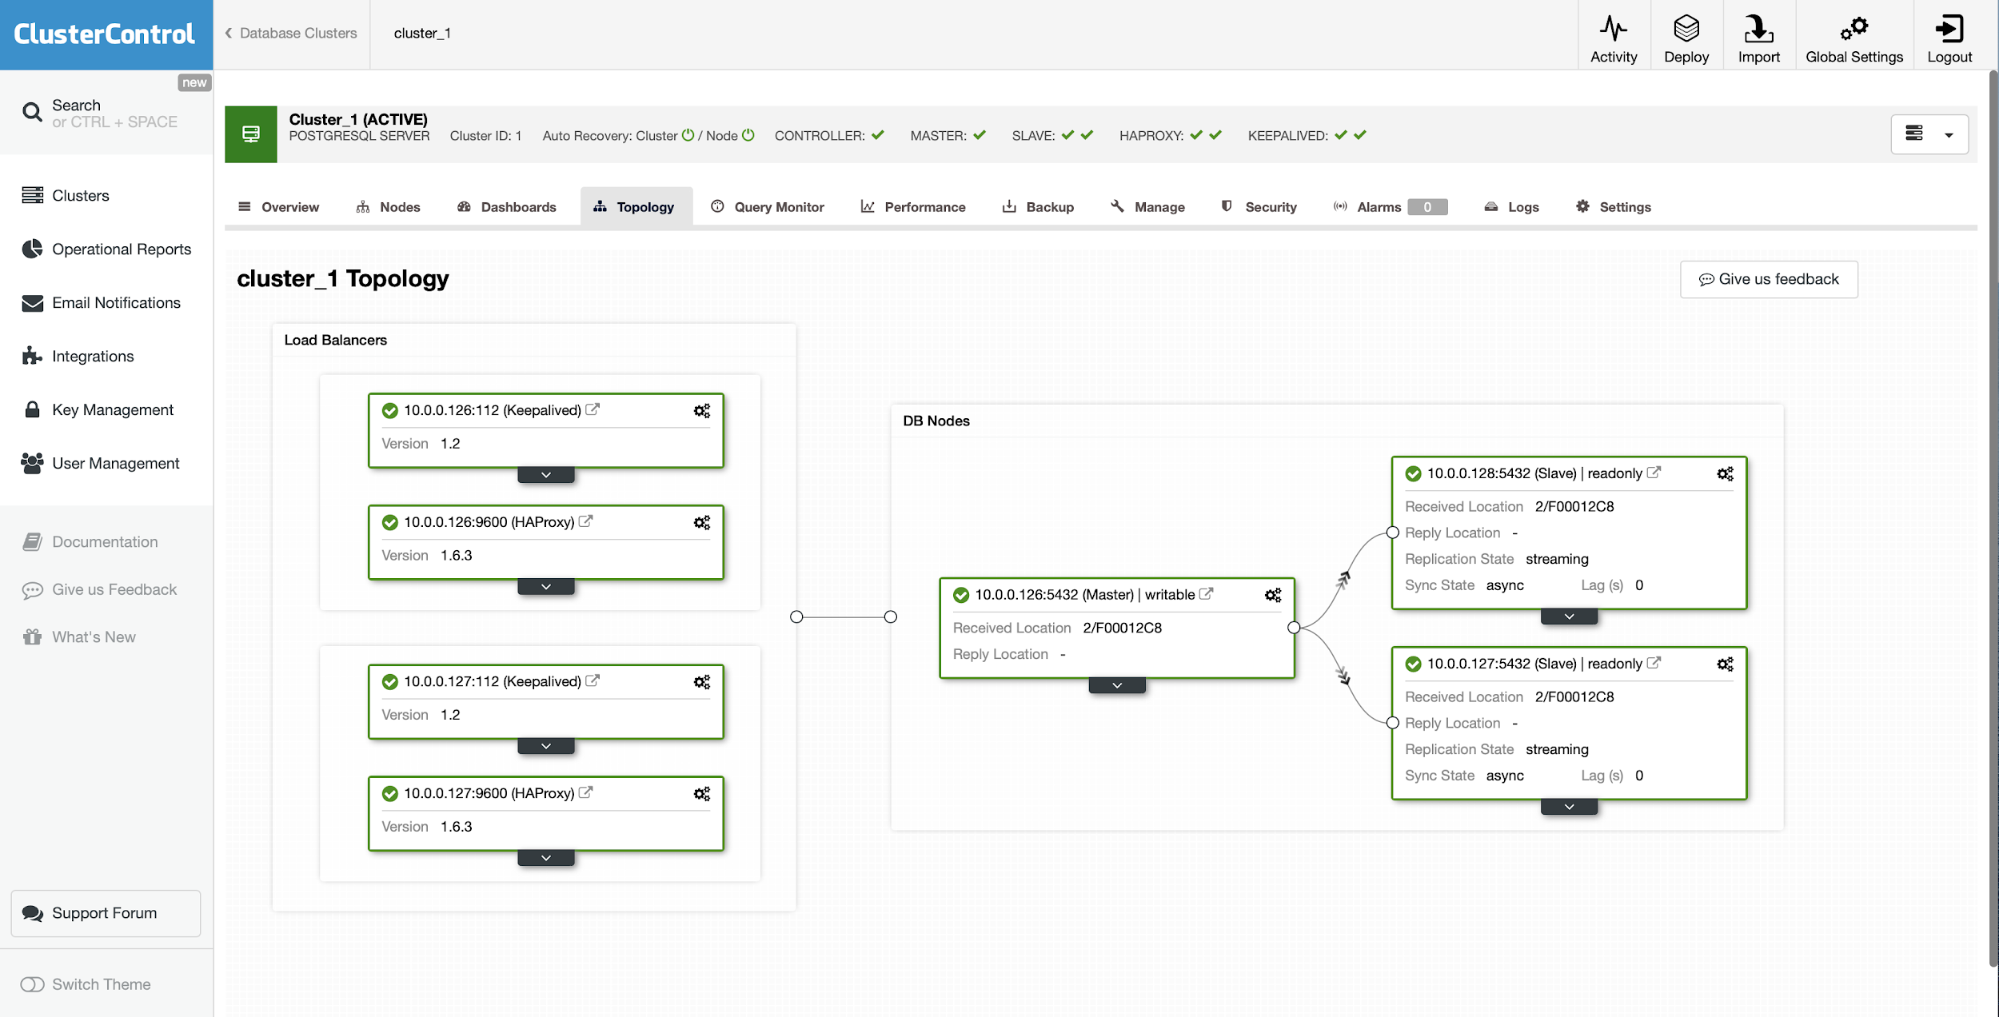
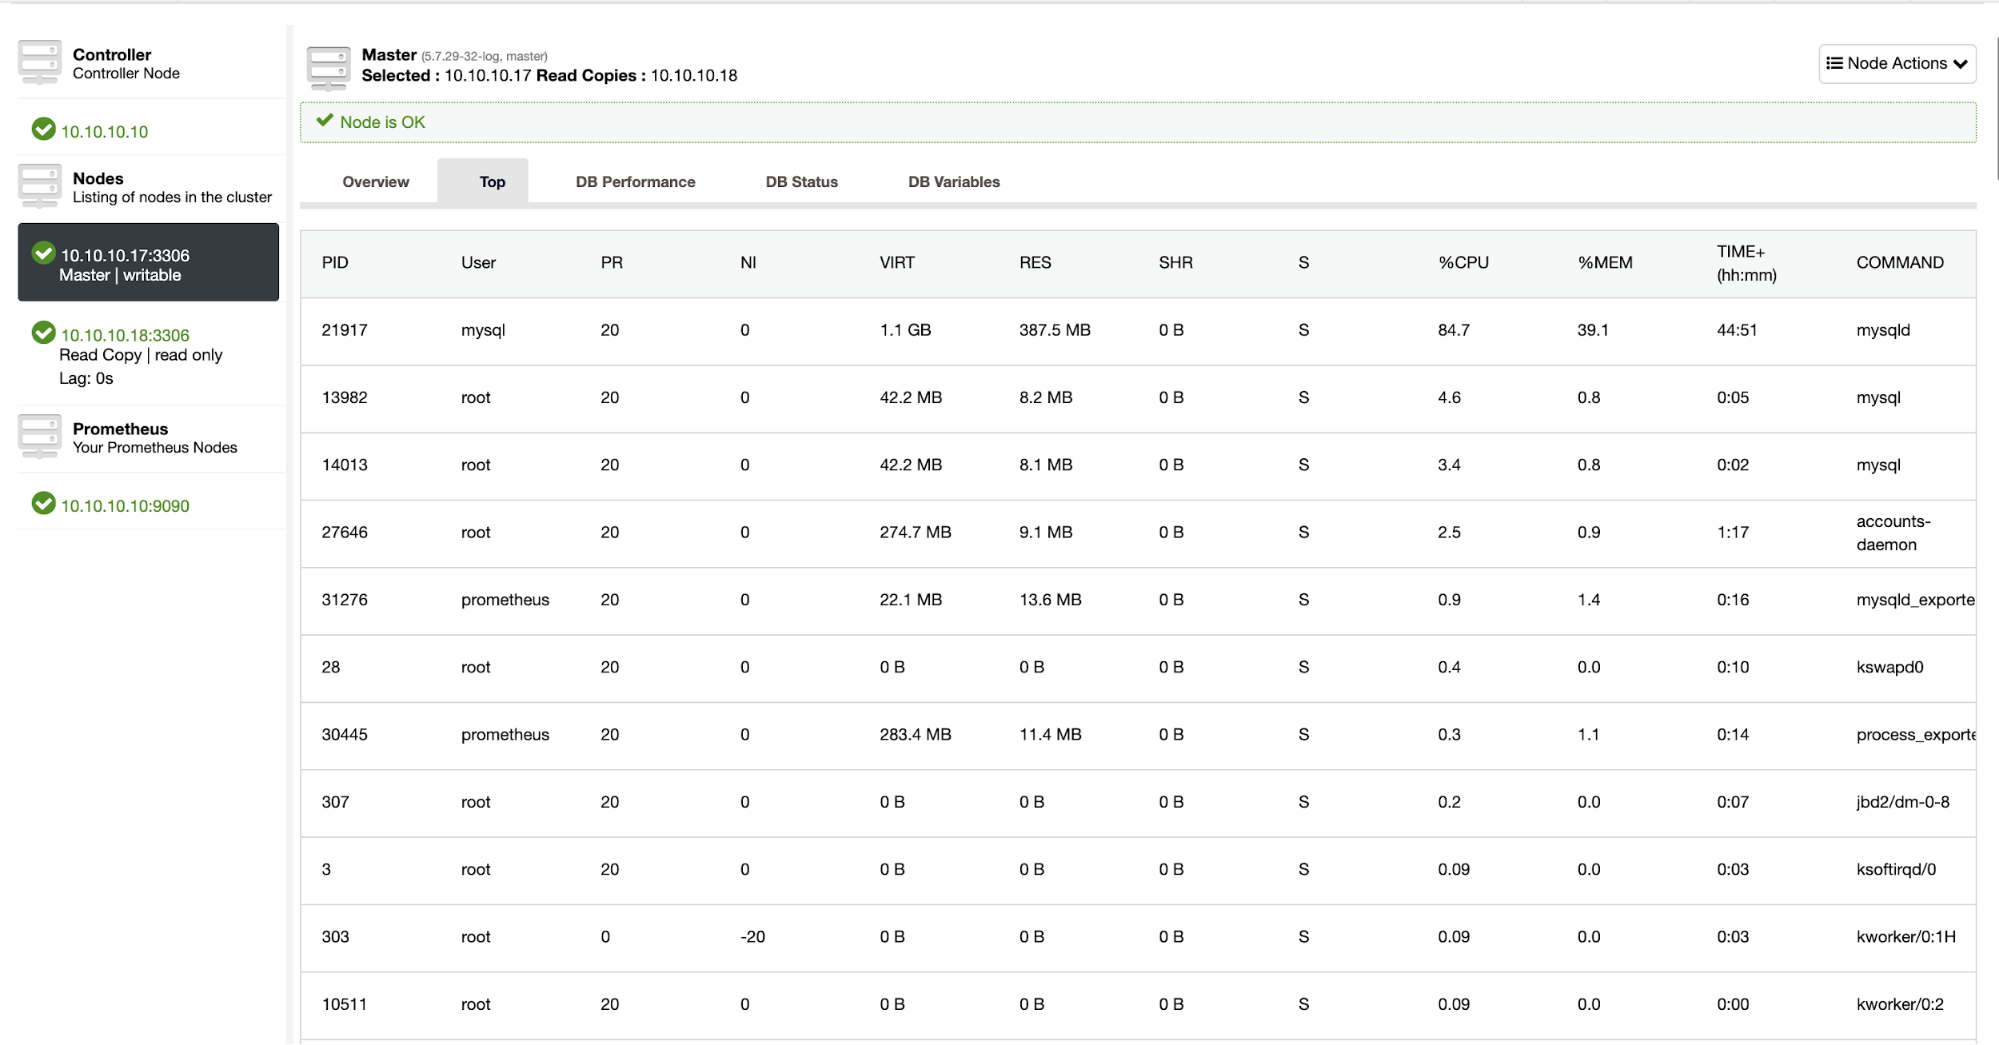
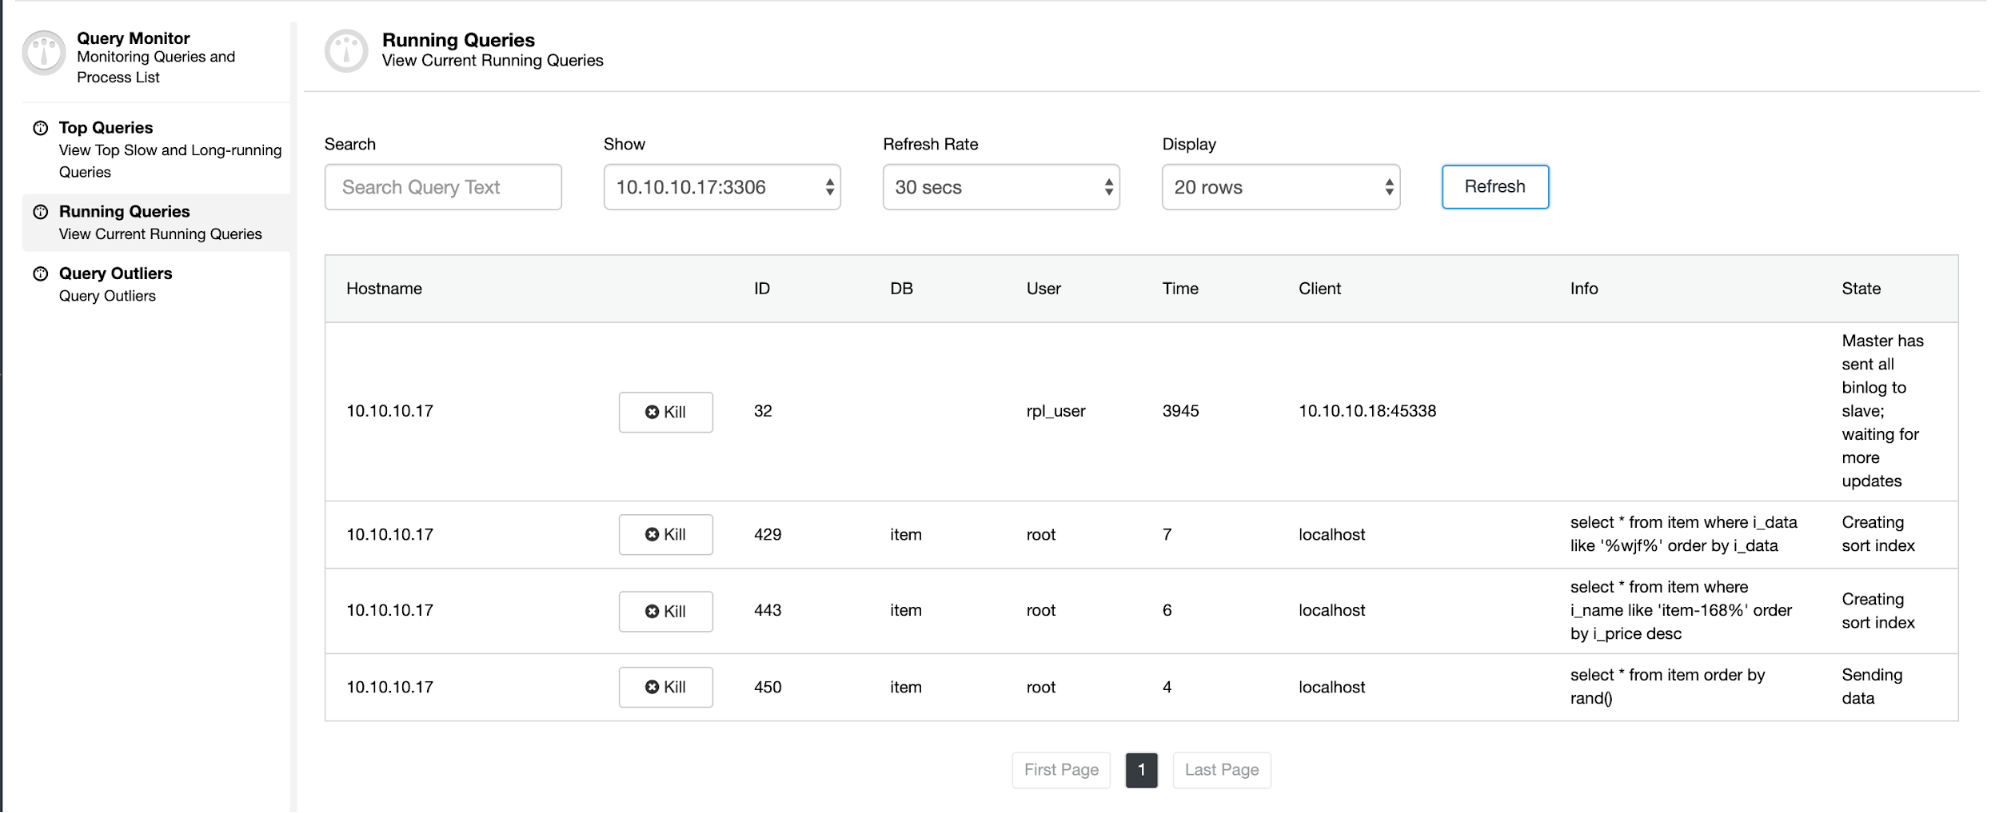
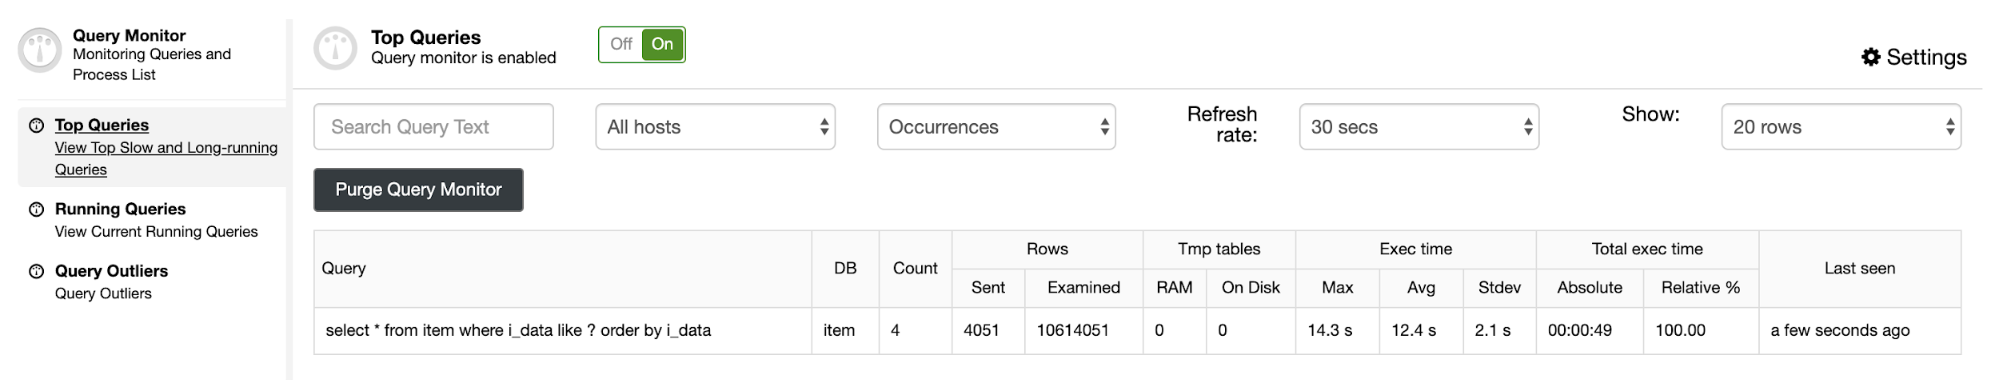
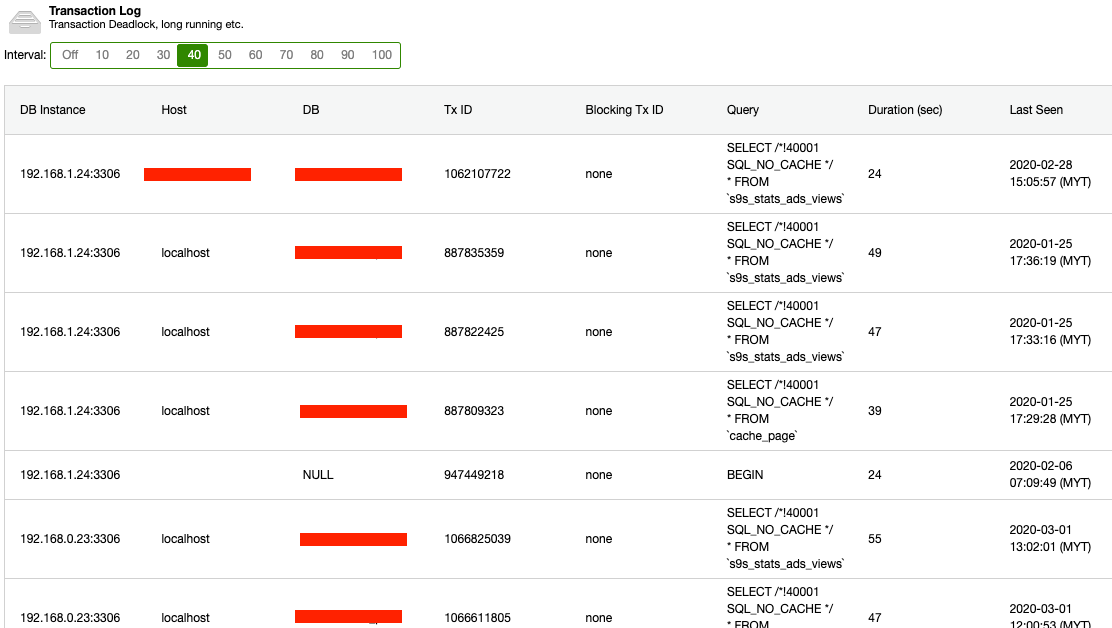
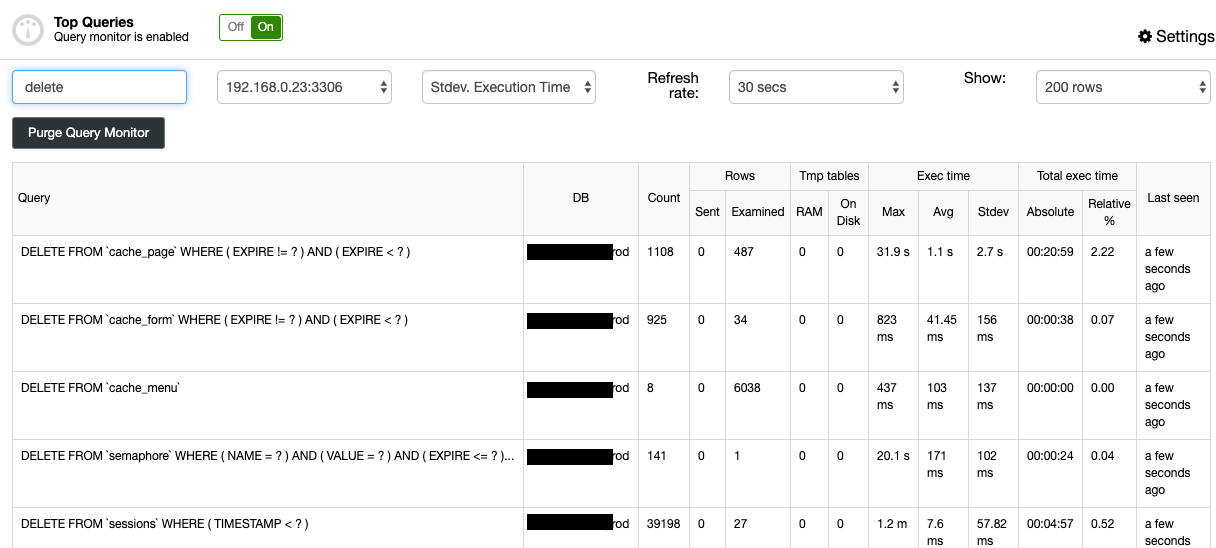
Otherwise, you can use external monitoring tools that can perform query sampling and monitoring so you can filter and audit the queries that come into the server. ClusterControl can be used to collect and summaries all your queries, as shown in the following screenshots where we filter all queries that contain DELETE string:
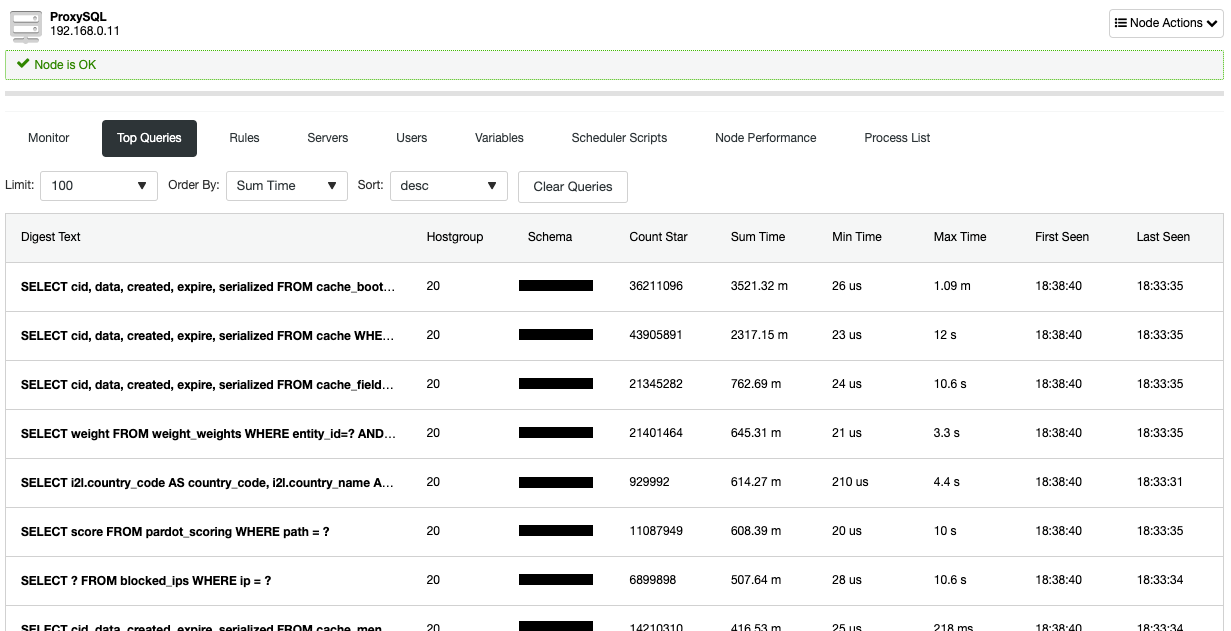
Similar information is also available under ProxySQL's top queries page (if your application is connecting via ProxySQL):
This can be used to track recent changes that have happened to the database server and can also be used for auditing purposes.
Conclusion
Your MySQL and MariaDB servers must be well-protected at all times since it usually contains sensitive data that attackers are looking after. You may also use ClusterControl to manage the security aspects of your database servers, as showcased by this blog post, How to Secure Your Open Source Databases with ClusterControl.