Quantcast
Channel: Severalnines
Viewing all 1476 articles
Browse latest View live

pt-query-digest Alternatives - MySQL Query Management & Monitoring with ClusterControl

$
0
0

When your database workload is over stressed, you first want to look at what queries are running in an attempt to see the pattern of the query. Is it write heavy? Read heavy? Where is the bottleneck? 

Identifying Query Issues

To figure it out you can enable the general log or the slow log to try to capture the queries which are running  and writing to the file. You also can read from the binary log (as binary log captures all the changes in the database) and look at reads directly from the running processlist in the database. You can even capture the query from the network perspective by looking through tcpdump.

What to do next? You can analyze the query that is written to general log file, slow log file, binary log to check if there is something interesting going on (eg. bottleneck in the query). 

Percona has a tool to analyze these type queries, named pt-query-digest.  It is included when you install the Percona Toolkit, a collection of utilities tools that help DBA to manage their databases. In this blog we will take a look at this tool and how it compares to the Query Management features of ClusterControl.

Installation Procedure

Percona repositories support two packages Linux Distribution for setup, which is Debian-based and RPM-based package distribution. The installation are just simple as shown below :

Debian-based package (Ubuntu, Debian)

Configure Percona package repositories by download the package

wget https://repo.percona.com/apt/percona-release_latest.generic_all.deb

And then install the downloaded package using dpkg

sudo dpkg -i percona-release_latest.generic_all.deb

After that, just run the installation from package manager

sudo apt-get install percona-toolkit

RPM-based package (RHEL, CentOS, Oracle Enterprise Linux, Amazon AMI)

Configure Percona package repositories by installing the rpm package directly.

sudo yum install https://repo.percona.com/yum/percona-release-latest.noarch.rpm 

After that, just run the installation from package manager

sudo apt-get install percona-toolkit

Percona utilities will be installed in your machine, and you just need to use it.

Query Workload Analyze

There are several ways to generate the statistics from the query workload using pt-query-digest, below is the command how to do it using a slow query file, general file, show processlist in database, and read through binary log.

Generate from show processlist database

pt-query-digest --processlist h=localhost,D=sbt,u=sbtest,p=12qwaszx --output slowlog > /tmp/slow_query.log

Generate from the slow query files / general query file

pt-query-digest mysql-slow.log > /tmp/slow_query.log

Generate from binary log. Before you run the pt-query-digest, you need to extract the binary log into readable format using mysqlbinlog. Don’t forget to add --type option and type binlog as the source.

pt-query-digest --type binlog mysql-bin.000001.txt > slow_query.log

After finish generating the file, you will see the report as shown below :

# 12s user time, 170ms system time, 27.44M rss, 221.79M vsz

# Current date: Sun May 10 21:40:47 2020

# Hostname: n2

# Files: mysql-1

# Overall: 94.92k total, 47 unique, 2.79k QPS, 27.90x concurrency ________

# Time range: 2020-05-10 21:39:37 to 21:40:11

# Attribute          total     min     max     avg     95%  stddev  median

# ============     ======= ======= ======= ======= ======= ======= =======

# Exec time           949s     6us      1s    10ms    42ms    42ms     2ms

# Lock time            31s       0      1s   327us    80us    11ms    22us

# Rows sent         69.36k       0     490    0.75    0.99   11.30       0

# Rows examine     196.34k       0     490    2.12    0.99   21.03    0.99

# Rows affecte      55.28k       0      15    0.60    0.99    1.26       0

# Bytes sent        13.12M      11   6.08k  144.93  299.03  219.02   51.63

# Query size        15.11M       5     922  166.86  258.32   83.13  174.84


# Profile

# Rank Query ID                      Response time  Calls R/Call V/M   Ite

# ==== ============================= ============== ===== ====== ===== ===

#    1 0xCE367F5CFFCAF46E816F682E... 162.6485 17.1%   199 0.8173  0.03 SELECT order_line? stock?

#    2 0x360F872745C81781F8F75EDE... 107.4898 11.3% 14837 0.0072  0.02 SELECT stock?

#    3 0xE0CE1933D0392DA3A42FAA7C... 102.2281 10.8% 14866 0.0069  0.03 SELECT item?

#    4 0x492B86BCB2B1AE1278147F95...  98.7658 10.4% 14854 0.0066  0.04 INSERT order_line?

#    5 0x9D086C2B787DC3A308043A0F...  93.8240  9.9% 14865 0.0063  0.02 UPDATE stock?

#    6 0x5812BF2C6ED2B9DAACA5D21B...  53.9681  5.7%  1289 0.0419  0.05 UPDATE customer?

#    7 0x51C0DD7AF0A6D908579C28C0...  44.3869  4.7%   864 0.0514  0.03 SELECT customer?

#    8 0xFFFCA4D67EA0A788813031B8...  41.2123  4.3%  3250 0.0127  0.01 COMMIT

#    9 0xFDDEE3813C59881488D9C47F...  36.0707  3.8%  1180 0.0306  0.02 UPDATE customer?

#   10 0x8FBBE0AFA061755CCC1C27AB...  31.6417  3.3%  1305 0.0242  0.03 UPDATE orders?

#   11 0x8AA6EB56551923DB9A49E40A...  23.3281  2.5%  1522 0.0153  0.04 SELECT customer? warehouse?

#   12 0xF34C10B3DA8DB048A630D4C7...  21.1662  2.2%  1305 0.0162  0.03 UPDATE order_line?

#   13 0x59DBA67188951C532AFC2598...  20.8006  2.2%  1503 0.0138  0.33 INSERT new_orders?

#   14 0xDADBEB0FBFA537F5D8722F42...  17.2802  1.8%  1290 0.0134  0.03 SELECT customer?

#   15 0x597A805ADA793440507F3334...  16.4394  1.7%  1516 0.0108  0.03 INSERT orders?

#   16 0x1B1EA568857A6AAC6544B44A...  13.9560  1.5%  1309 0.0107  0.05 SELECT new_orders?

#   17 0xCE3EDD98779478DE17154DCE...  12.1470  1.3%  1322 0.0092  0.05 INSERT history?

#   18 0x9DFD75E88091AA333A777668...  11.6842  1.2%  1311 0.0089  0.05 SELECT orders?

# MISC 0xMISC                         39.6393  4.2% 16334 0.0024   0.0 <29 ITEMS>


# Query 1: 6.03 QPS, 4.93x concurrency, ID 0xCE367F5CFFCAF46E816F682E53C0CF03 at byte 30449473

# This item is included in the report because it matches --limit.

# Scores: V/M = 0.03

# Time range: 2020-05-10 21:39:37 to 21:40:10

# Attribute    pct   total     min     max     avg     95%  stddev  median

# ============ === ======= ======= ======= ======= ======= ======= =======

# Count          0     199

# Exec time     17    163s   302ms      1s   817ms   992ms   164ms   816ms

# Lock time      0     9ms    30us   114us    44us    84us    18us    36us

# Rows sent      0     199       1       1       1       1       0       1

# Rows examine  39  76.91k     306     468  395.75  441.81   27.41  381.65

# Rows affecte   0       0       0       0       0       0       0       0

# Bytes sent     0  15.54k      79      80   79.96   76.28       0   76.28

# Query size     0  74.30k     382     384  382.35  381.65       0  381.65

# String:

# Databases    sbt

# Hosts        localhost

# Last errno   0

# Users        sbtest

# Query_time distribution

#   1us

#  10us

# 100us

#   1ms

#  10ms

# 100ms  ################################################################

#    1s  ####

#  10s+

# Tables

#    SHOW TABLE STATUS FROM `sbt` LIKE 'order_line6'\G

#    SHOW CREATE TABLE `sbt`.`order_line6`\G

#    SHOW TABLE STATUS FROM `sbt` LIKE 'stock6'\G

#    SHOW CREATE TABLE `sbt`.`stock6`\G

# EXPLAIN /*!50100 PARTITIONS*/

SELECT COUNT(DISTINCT (s_i_id))

                        FROM order_line6, stock6

                       WHERE ol_w_id = 1

                         AND ol_d_id = 1

                         AND ol_o_id < 3050

                         AND ol_o_id >= 3030

                         AND s_w_id= 1

                         AND s_i_id=ol_i_id

                         AND s_quantity < 18\G


# Query 2: 436.38 QPS, 3.16x concurrency, ID 0x360F872745C81781F8F75EDE9DD44246 at byte 30021546

# This item is included in the report because it matches --limit.

# Scores: V/M = 0.02

# Time range: 2020-05-10 21:39:37 to 21:40:11

# Attribute    pct   total     min     max     avg     95%  stddev  median

# ============ === ======= ======= ======= ======= ======= ======= =======

# Count         15   14837

# Exec time     11    107s    44us   233ms     7ms    33ms    13ms     3ms

# Lock time      1   522ms    15us   496us    35us    84us    28us    23us

# Rows sent     20  14.49k       1       1       1       1       0       1

# Rows examine   7  14.49k       1       1       1       1       0       1

# Rows affecte   0       0       0       0       0       0       0       0

# Bytes sent    28   3.74M     252     282  264.46  271.23    8.65  258.32

# Query size    19   3.01M     209     215  213.05  212.52    2.85  212.52

# String:

# Databases    sbt

# Hosts        localhost

# Last errno   0

# Users        sbtest

# Query_time distribution

#   1us

#  10us  #

# 100us  ##

#   1ms  ################################################################

#  10ms  #############

# 100ms  #

#    1s

#  10s+

# Tables

#    SHOW TABLE STATUS FROM `sbt` LIKE 'stock9'\G

#    SHOW CREATE TABLE `sbt`.`stock9`\G

# EXPLAIN /*!50100 PARTITIONS*/

SELECT s_quantity, s_data, s_dist_01 s_dist

                                                      FROM stock9

                                                    WHERE s_i_id = 60407 AND s_w_id= 2 FOR UPDATE\G

As you can see on the above pt-query-digest report result, we can divided into 3 parts.

Summary Report 

There is much information you can find in the summary report, starting from the hostname server, the date you execute the command, information related to  the query were logged, QPS, and time frame capture. Beside that, you also can see statistics of timing on each Attribute. 

# 12s user time, 170ms system time, 27.44M rss, 221.79M vsz

# Current date: Sun May 10 21:40:47 2020

# Hostname: n2

# Files: mysql-1

# Overall: 94.92k total, 47 unique, 2.79k QPS, 27.90x concurrency ________

# Time range: 2020-05-10 21:39:37 to 21:40:11

# Attribute          total     min     max     avg     95%  stddev  median

# ============     ======= ======= ======= ======= ======= ======= =======

# Exec time           949s     6us      1s    10ms    42ms    42ms     2ms

# Lock time            31s       0      1s   327us    80us    11ms    22us

# Rows sent         69.36k       0     490    0.75    0.99   11.30       0

# Rows examine     196.34k       0     490    2.12    0.99   21.03    0.99

# Rows affecte      55.28k       0      15    0.60    0.99    1.26       0

# Bytes sent        13.12M      11   6.08k  144.93  299.03  219.02   51.63

# Query size        15.11M       5     922  166.86  258.32   83.13  174.84

Query Profiling Based on Rank 

You can see useful information in the profiling query.

# Profile

# Rank Query ID                      Response time  Calls R/Call V/M   Ite

# ==== ============================= ============== ===== ====== ===== ===

#    1 0xCE367F5CFFCAF46E816F682E... 162.6485 17.1%   199 0.8173  0.03 SELECT order_line? stock?

#    2 0x360F872745C81781F8F75EDE... 107.4898 11.3% 14837 0.0072  0.02 SELECT stock?

There is a lot of information such as the queries running, response time of the query (including the percentage calculation), how many calls the query is making, and reads per call.

Query Distribution

Query distribution statistics describe detailed information based on query profiling rank, you can see the QPS concurrency, statistics information related to the query Attribute. 

# Query 1: 6.03 QPS, 4.93x concurrency, ID 0xCE367F5CFFCAF46E816F682E53C0CF03 at byte 30449473

# This item is included in the report because it matches --limit.

# Scores: V/M = 0.03

# Time range: 2020-05-10 21:39:37 to 21:40:10

# Attribute    pct   total     min     max     avg     95%  stddev  median

# ============ === ======= ======= ======= ======= ======= ======= =======

# Count          0     199

# Exec time     17    163s   302ms      1s   817ms   992ms   164ms   816ms

# Lock time      0     9ms    30us   114us    44us    84us    18us    36us

# Rows sent      0     199       1       1       1       1       0       1

# Rows examine  39  76.91k     306     468  395.75  441.81   27.41  381.65

# Rows affecte   0       0       0       0       0       0       0       0

# Bytes sent     0  15.54k      79      80   79.96   76.28       0   76.28

# Query size     0  74.30k     382     384  382.35  381.65       0  381.65

# String:

# Databases    sbt

# Hosts        localhost

# Last errno   0

# Users        sbtest

# Query_time distribution

#   1us

#  10us

# 100us

#   1ms

#  10ms

# 100ms  ################################################################

#    1s  ####

#  10s+

# Tables

#    SHOW TABLE STATUS FROM `sbt` LIKE 'order_line6'\G

#    SHOW CREATE TABLE `sbt`.`order_line6`\G

#    SHOW TABLE STATUS FROM `sbt` LIKE 'stock6'\G

#    SHOW CREATE TABLE `sbt`.`stock6`\G

# EXPLAIN /*!50100 PARTITIONS*/

SELECT COUNT(DISTINCT (s_i_id))

                        FROM order_line6, stock6

                       WHERE ol_w_id = 1

                         AND ol_d_id = 1

                         AND ol_o_id < 3050

                         AND ol_o_id >= 3030

                         AND s_w_id= 1

                         AND s_i_id=ol_i_id

                         AND s_quantity < 18\G

There is also information regarding query time distribution, host, user, and database.

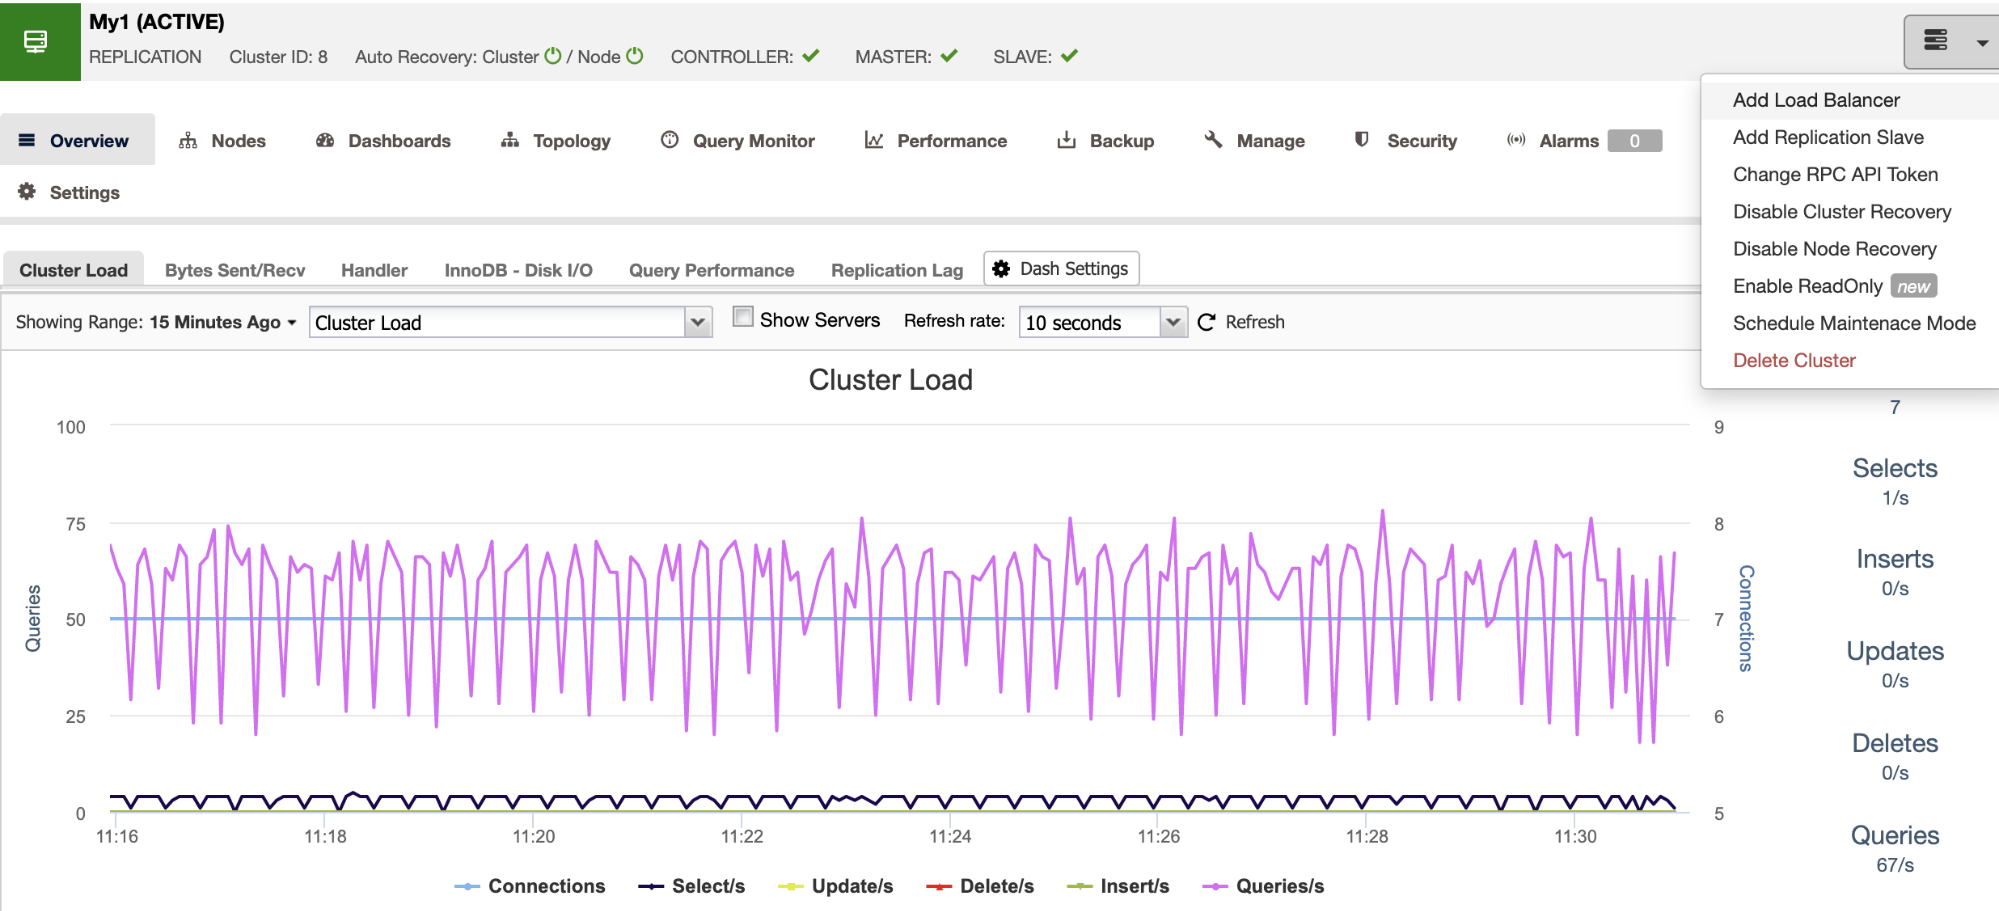
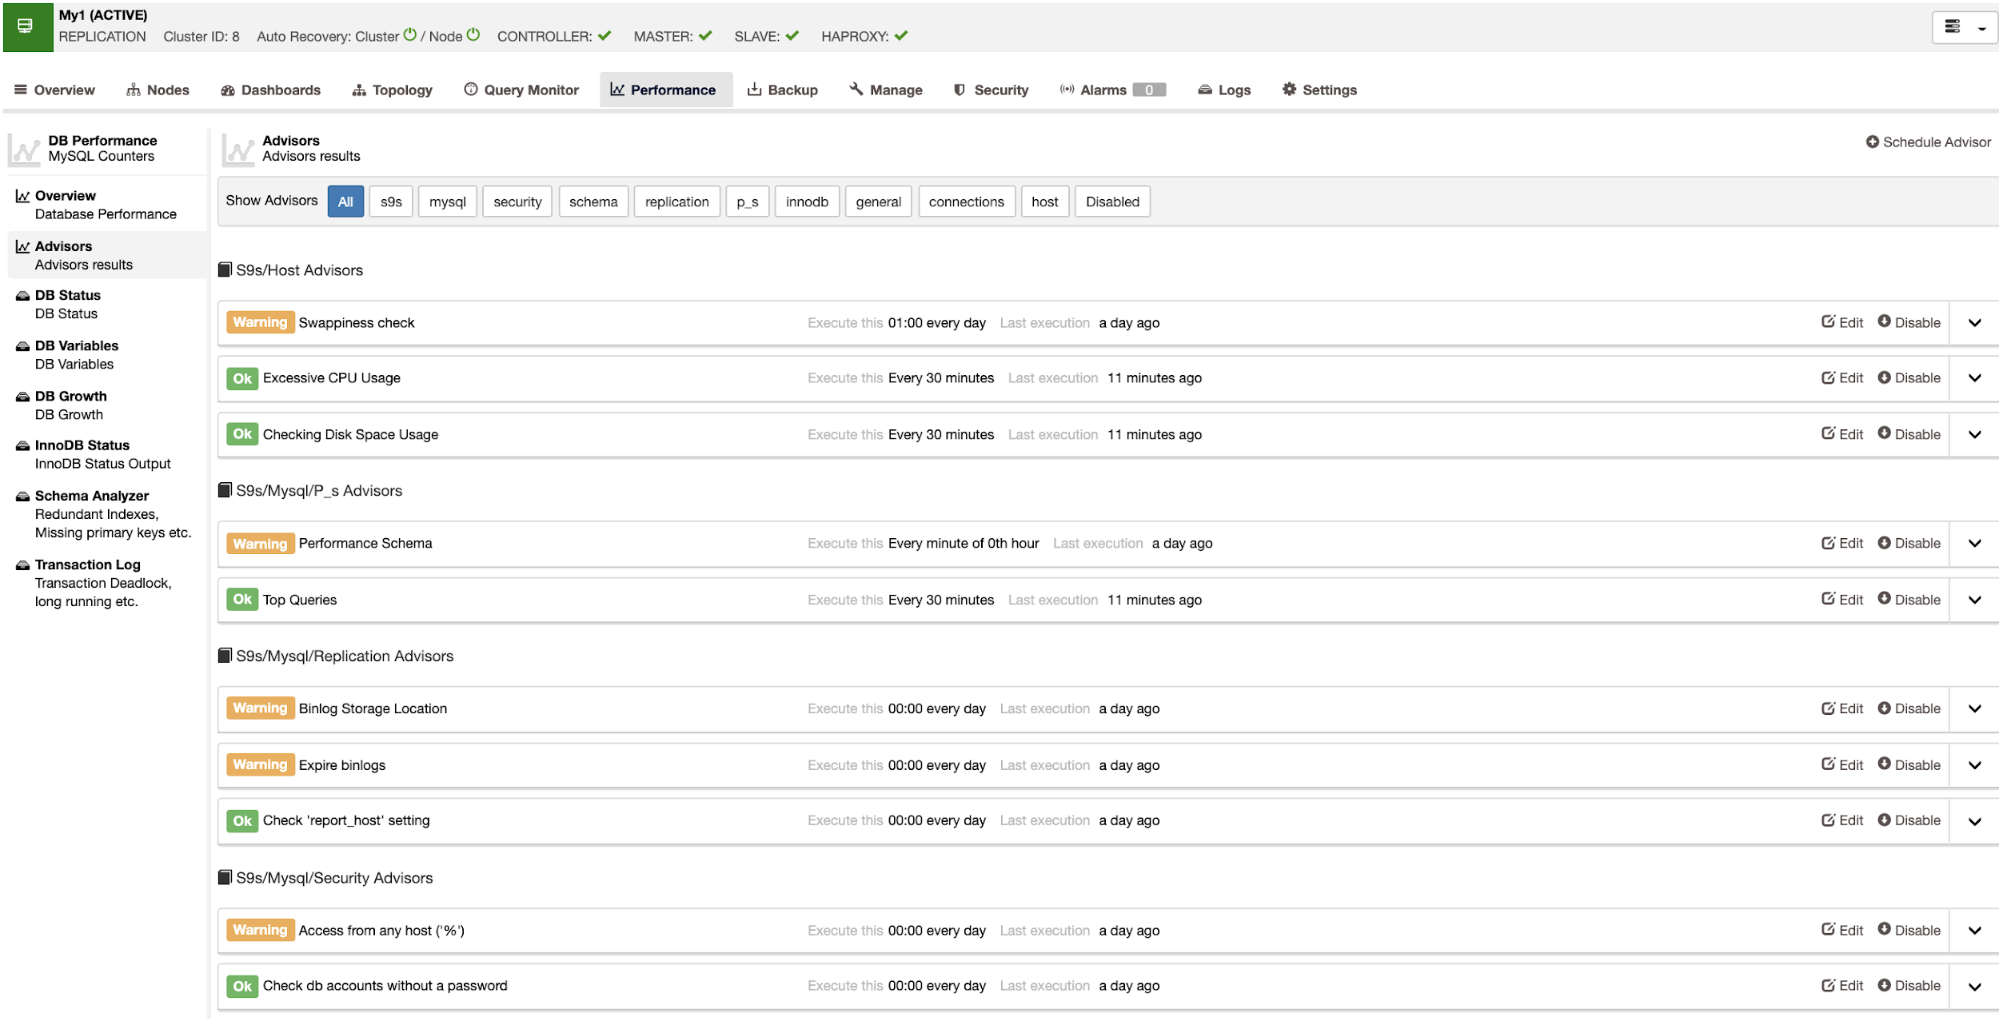
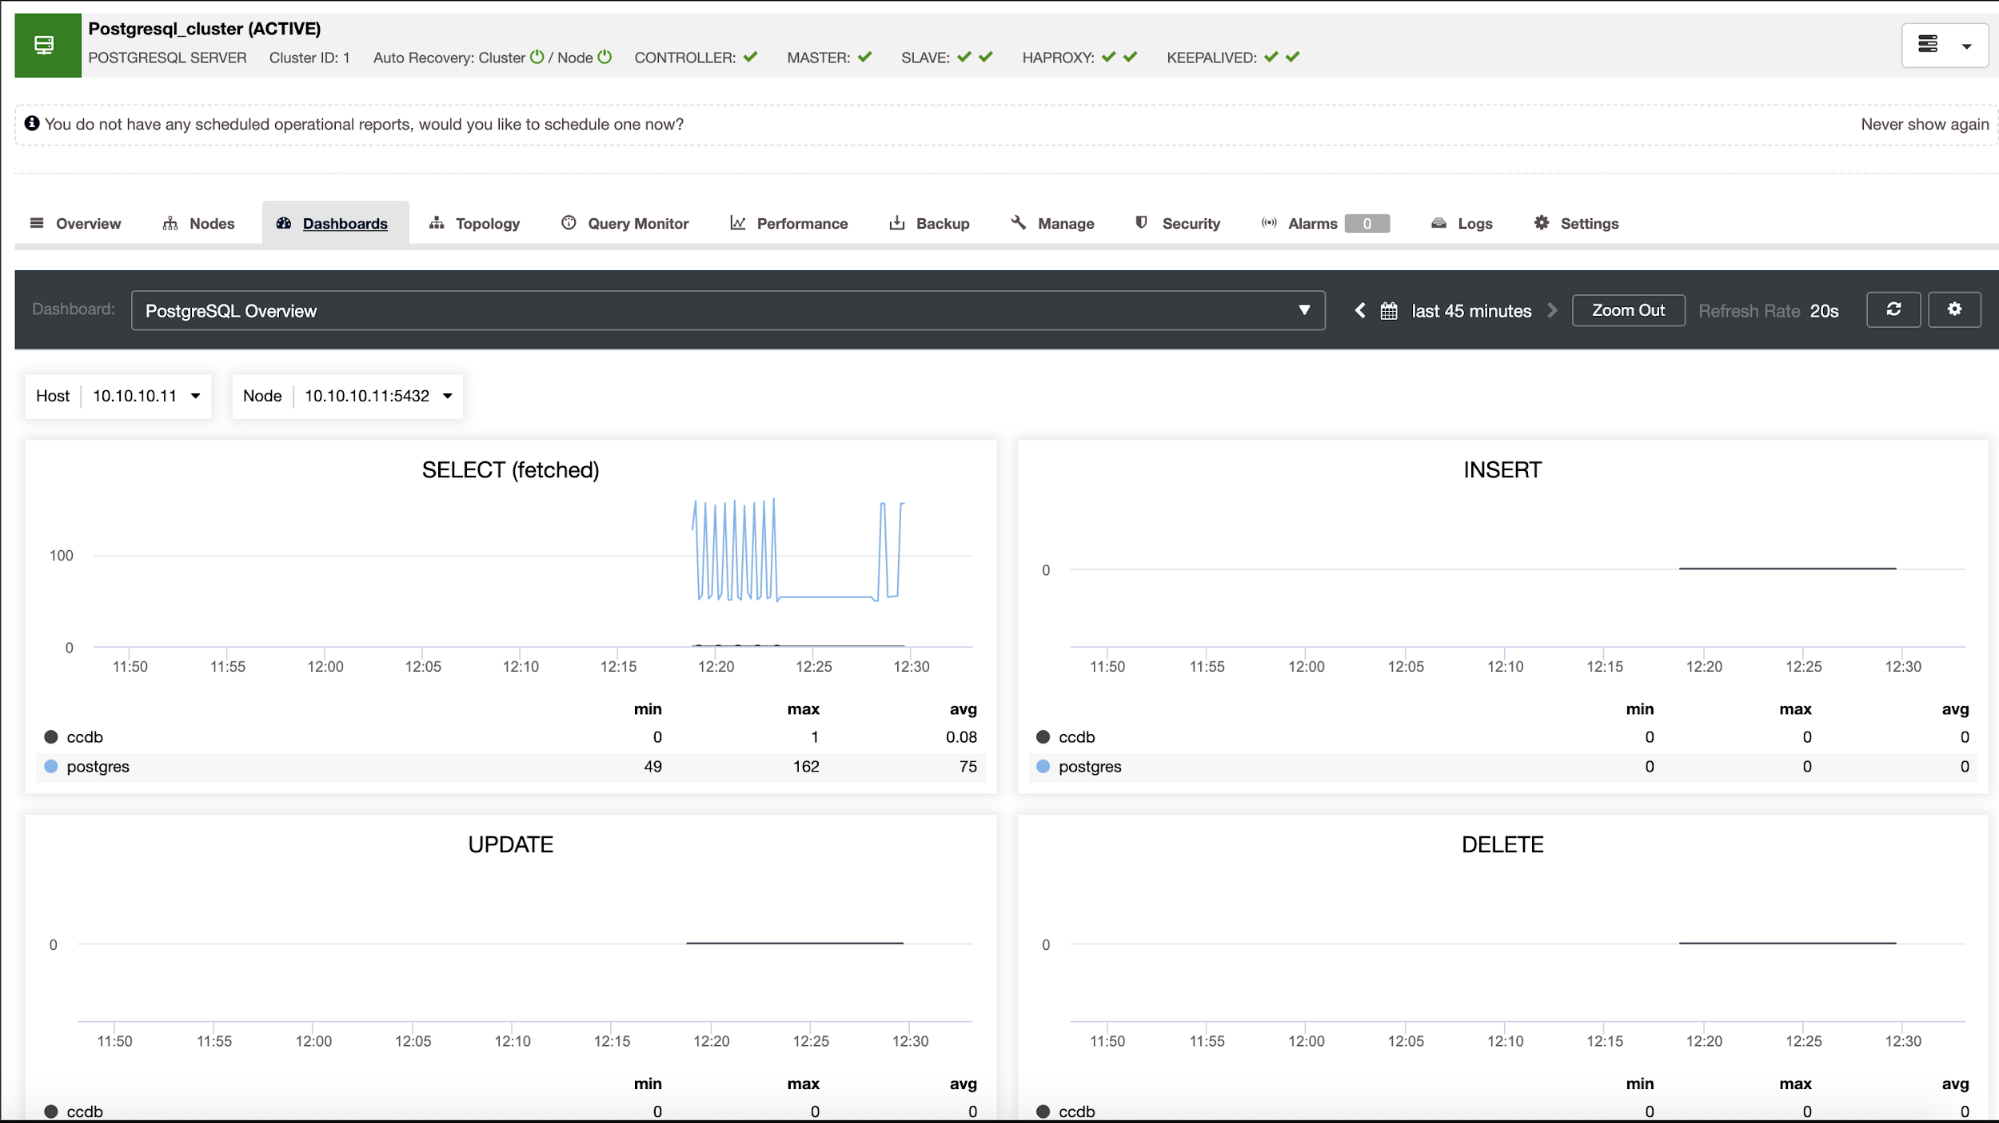
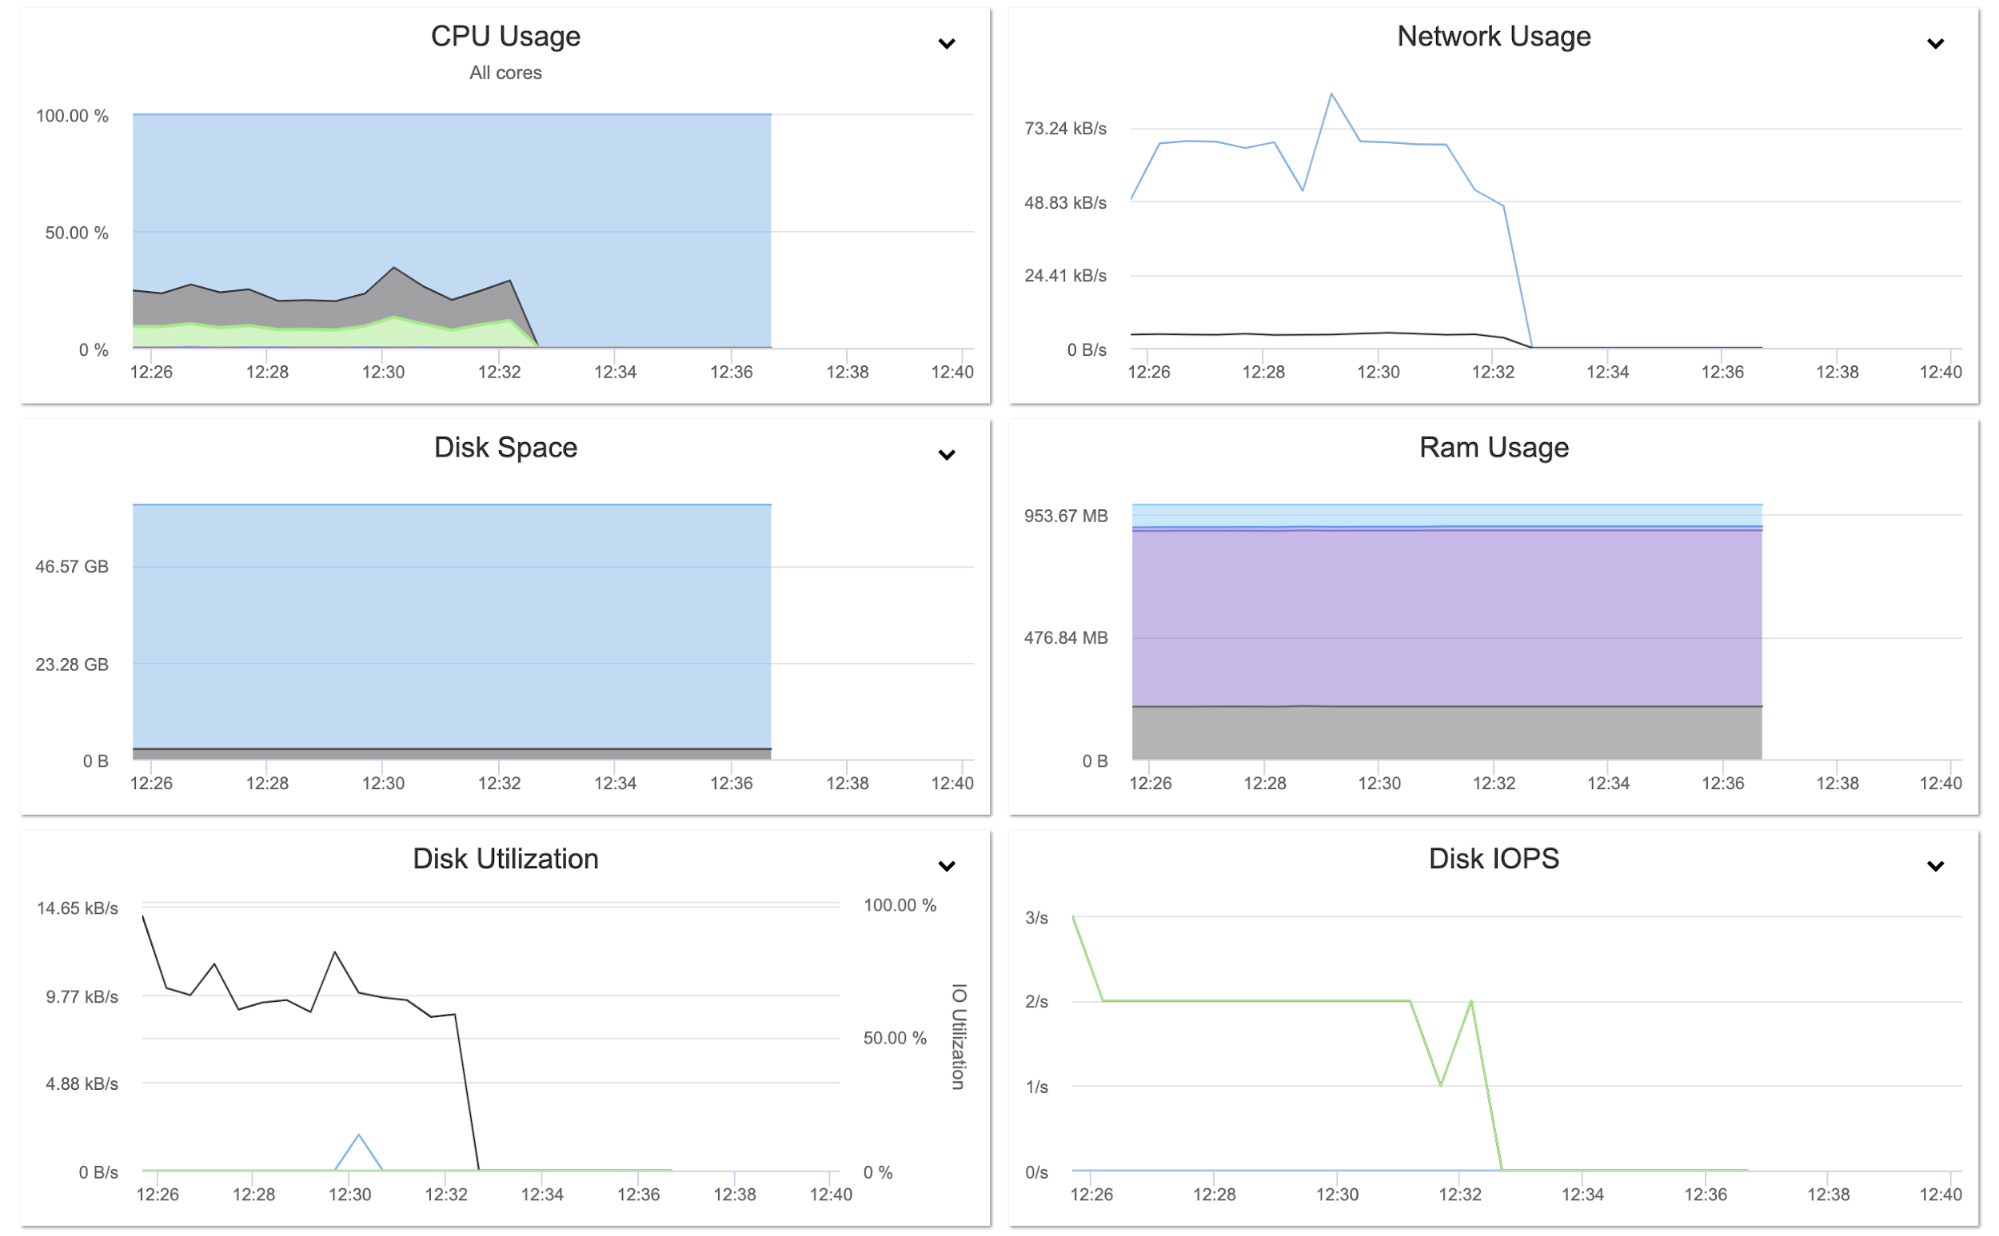
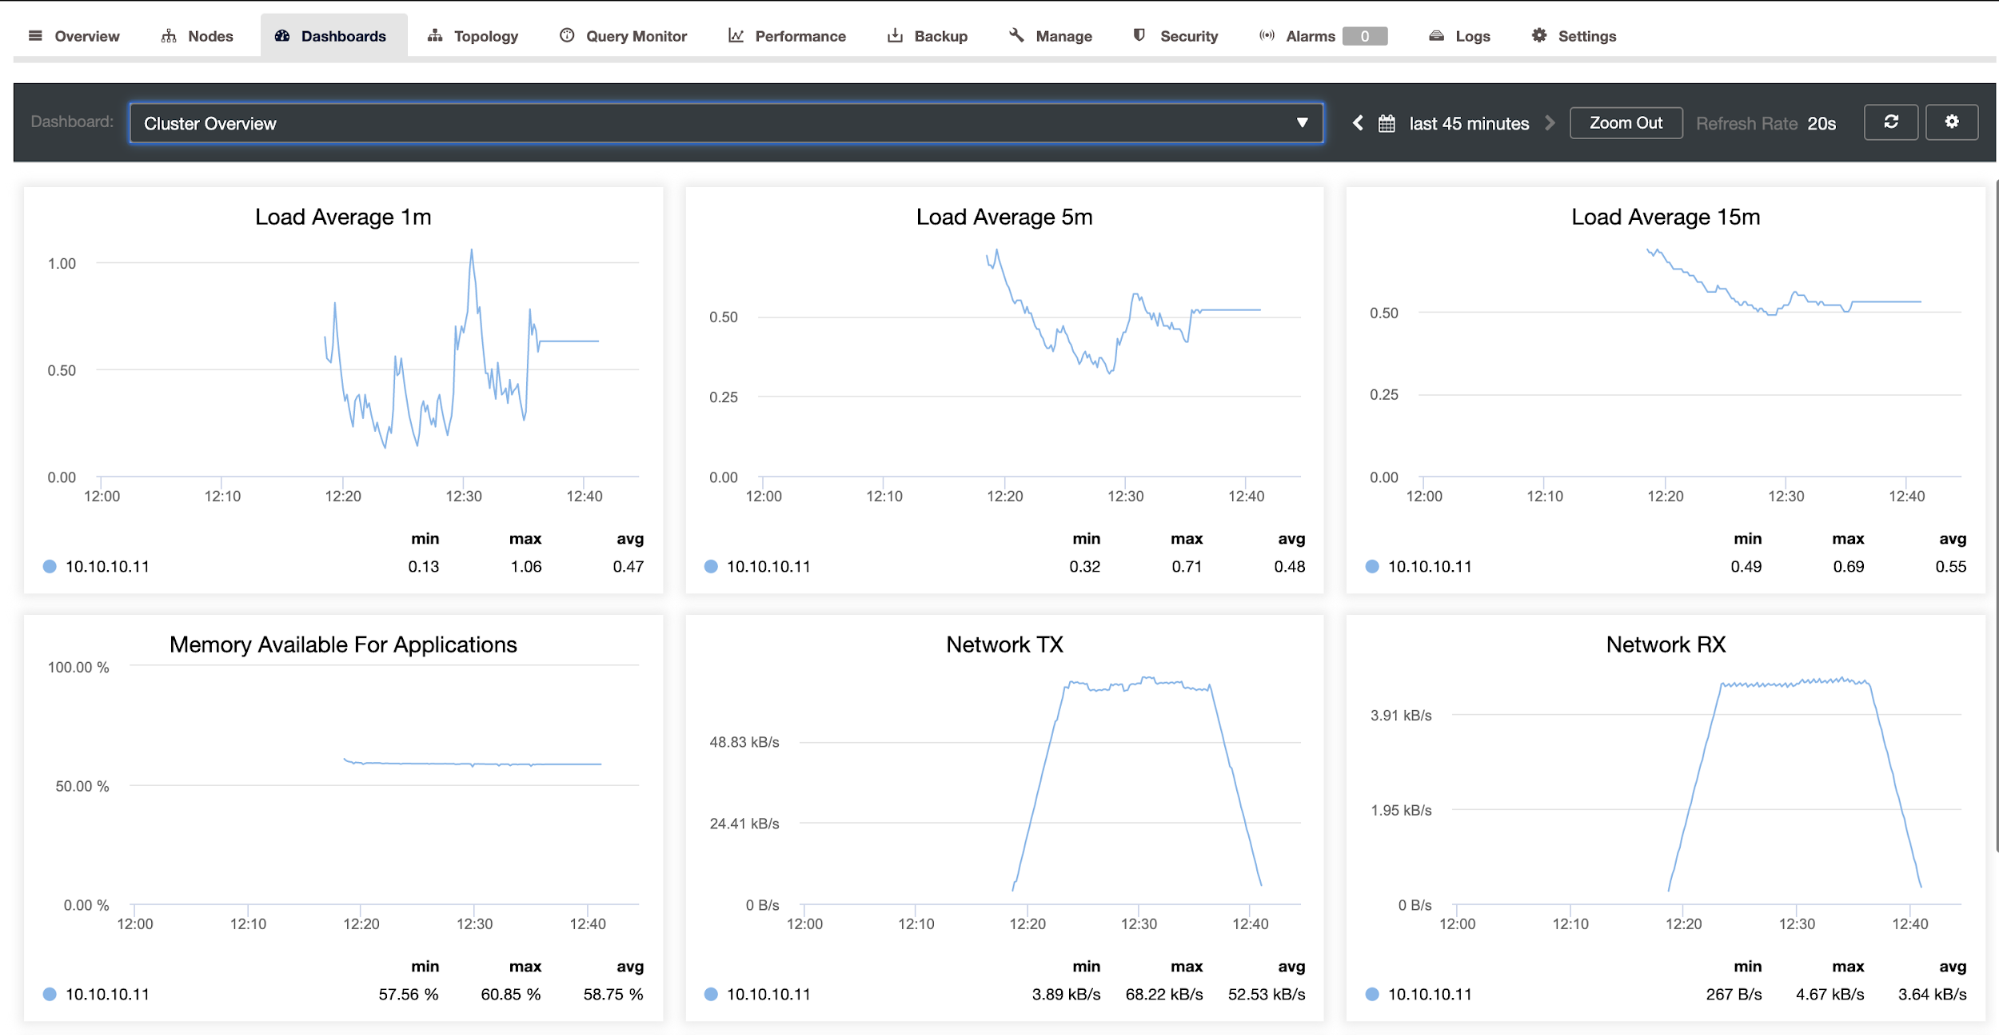
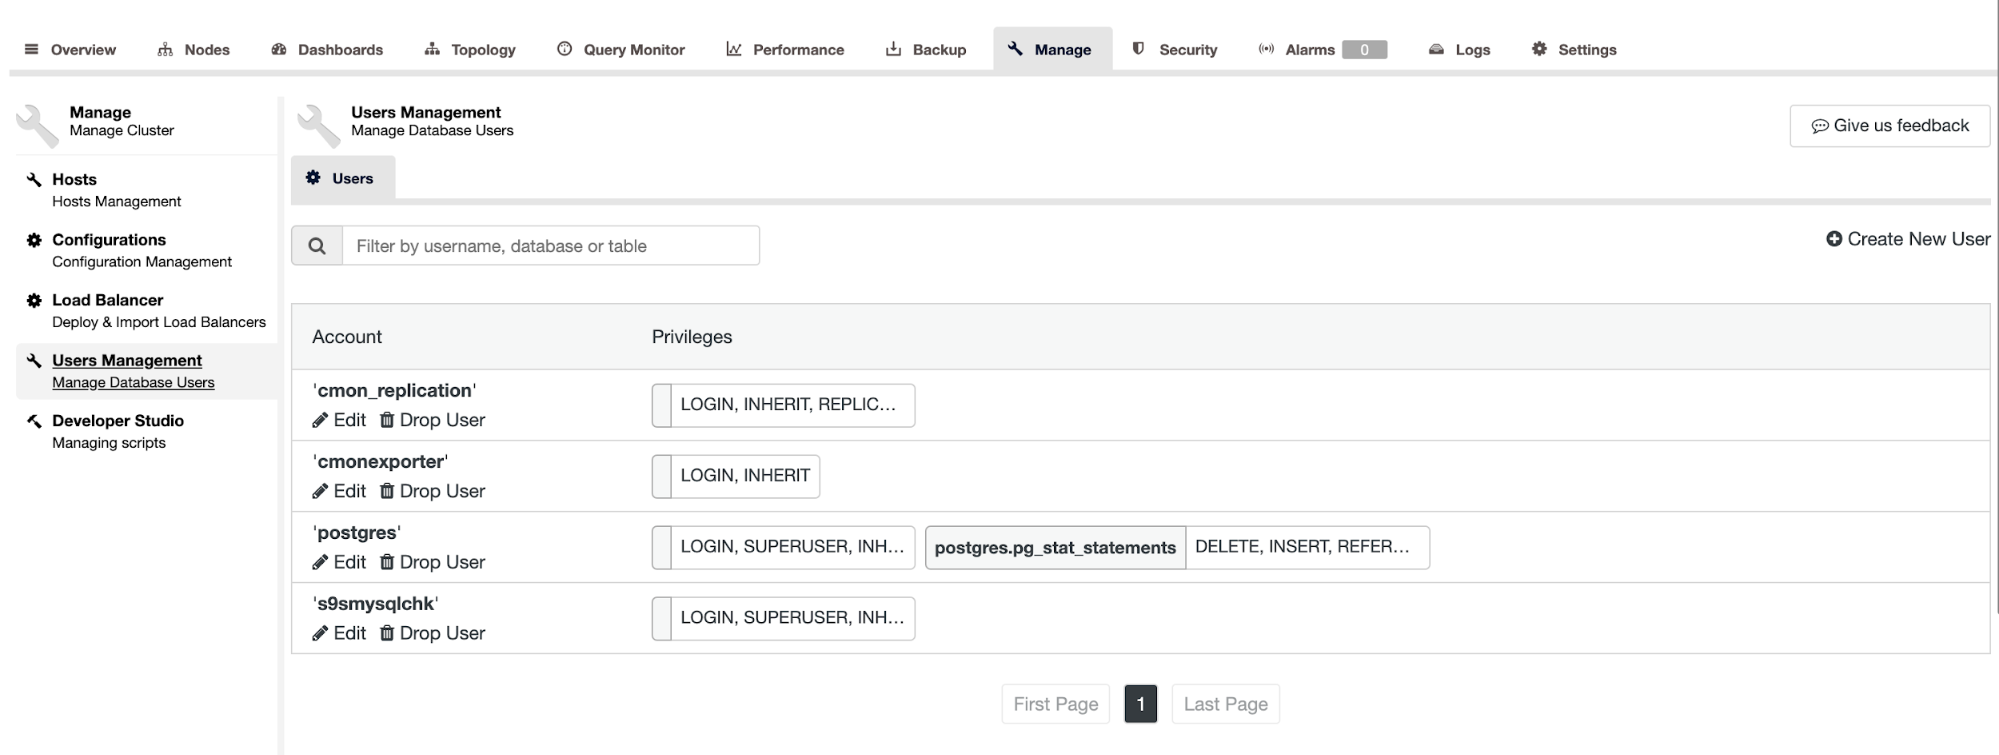
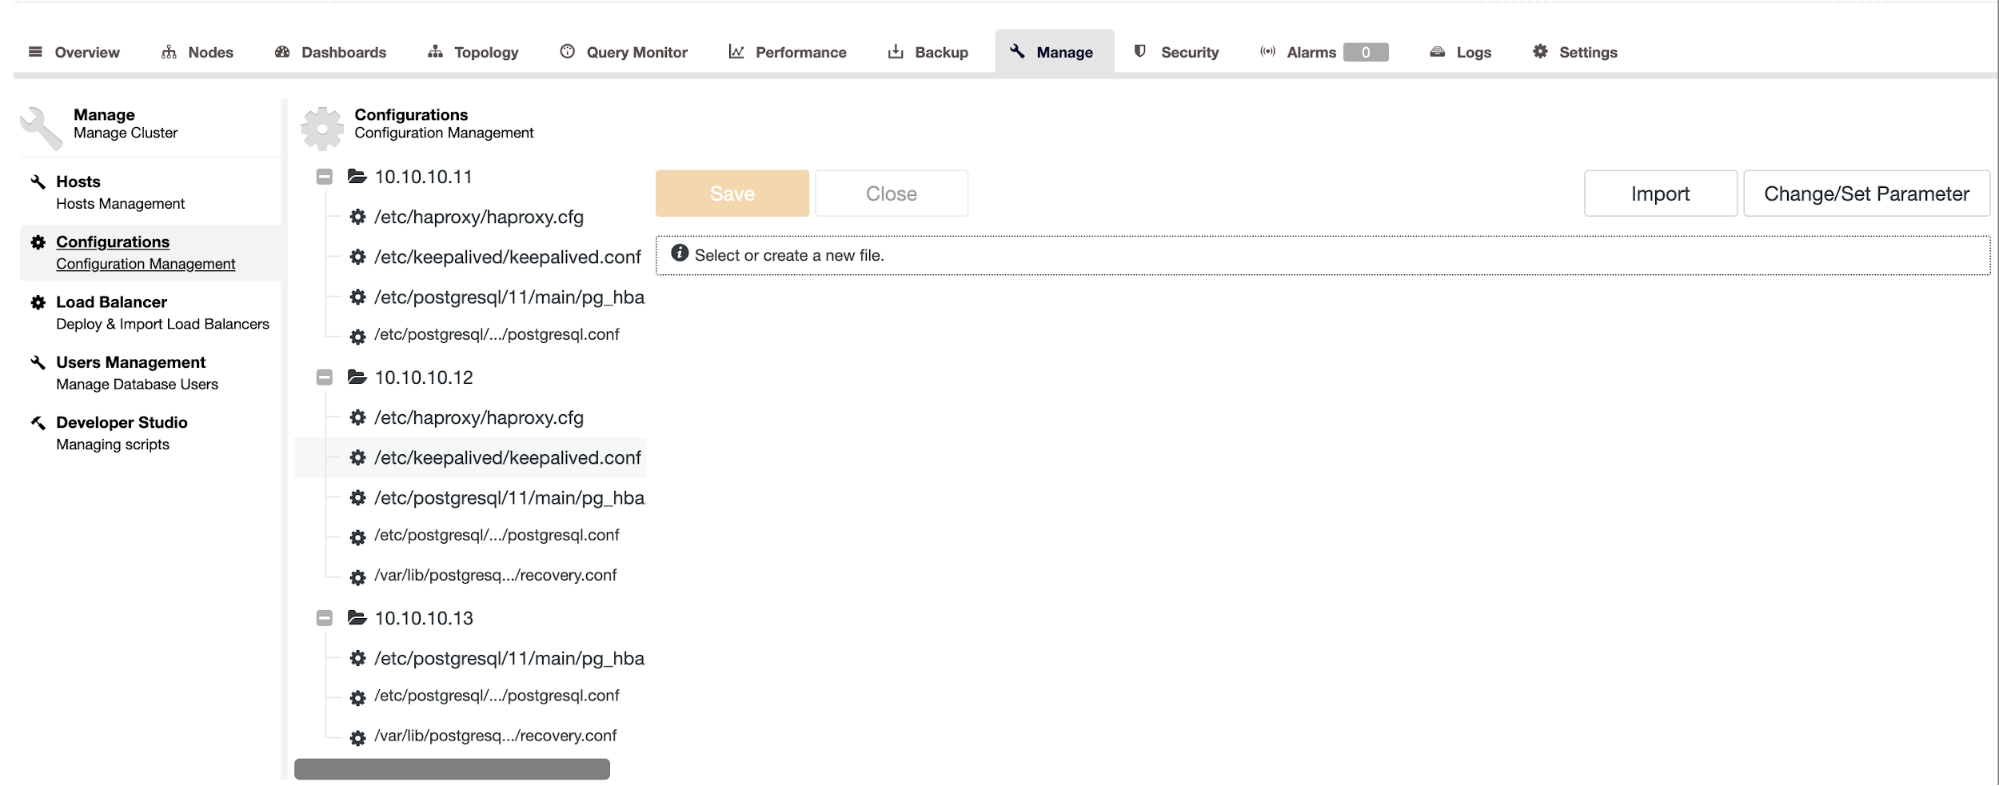
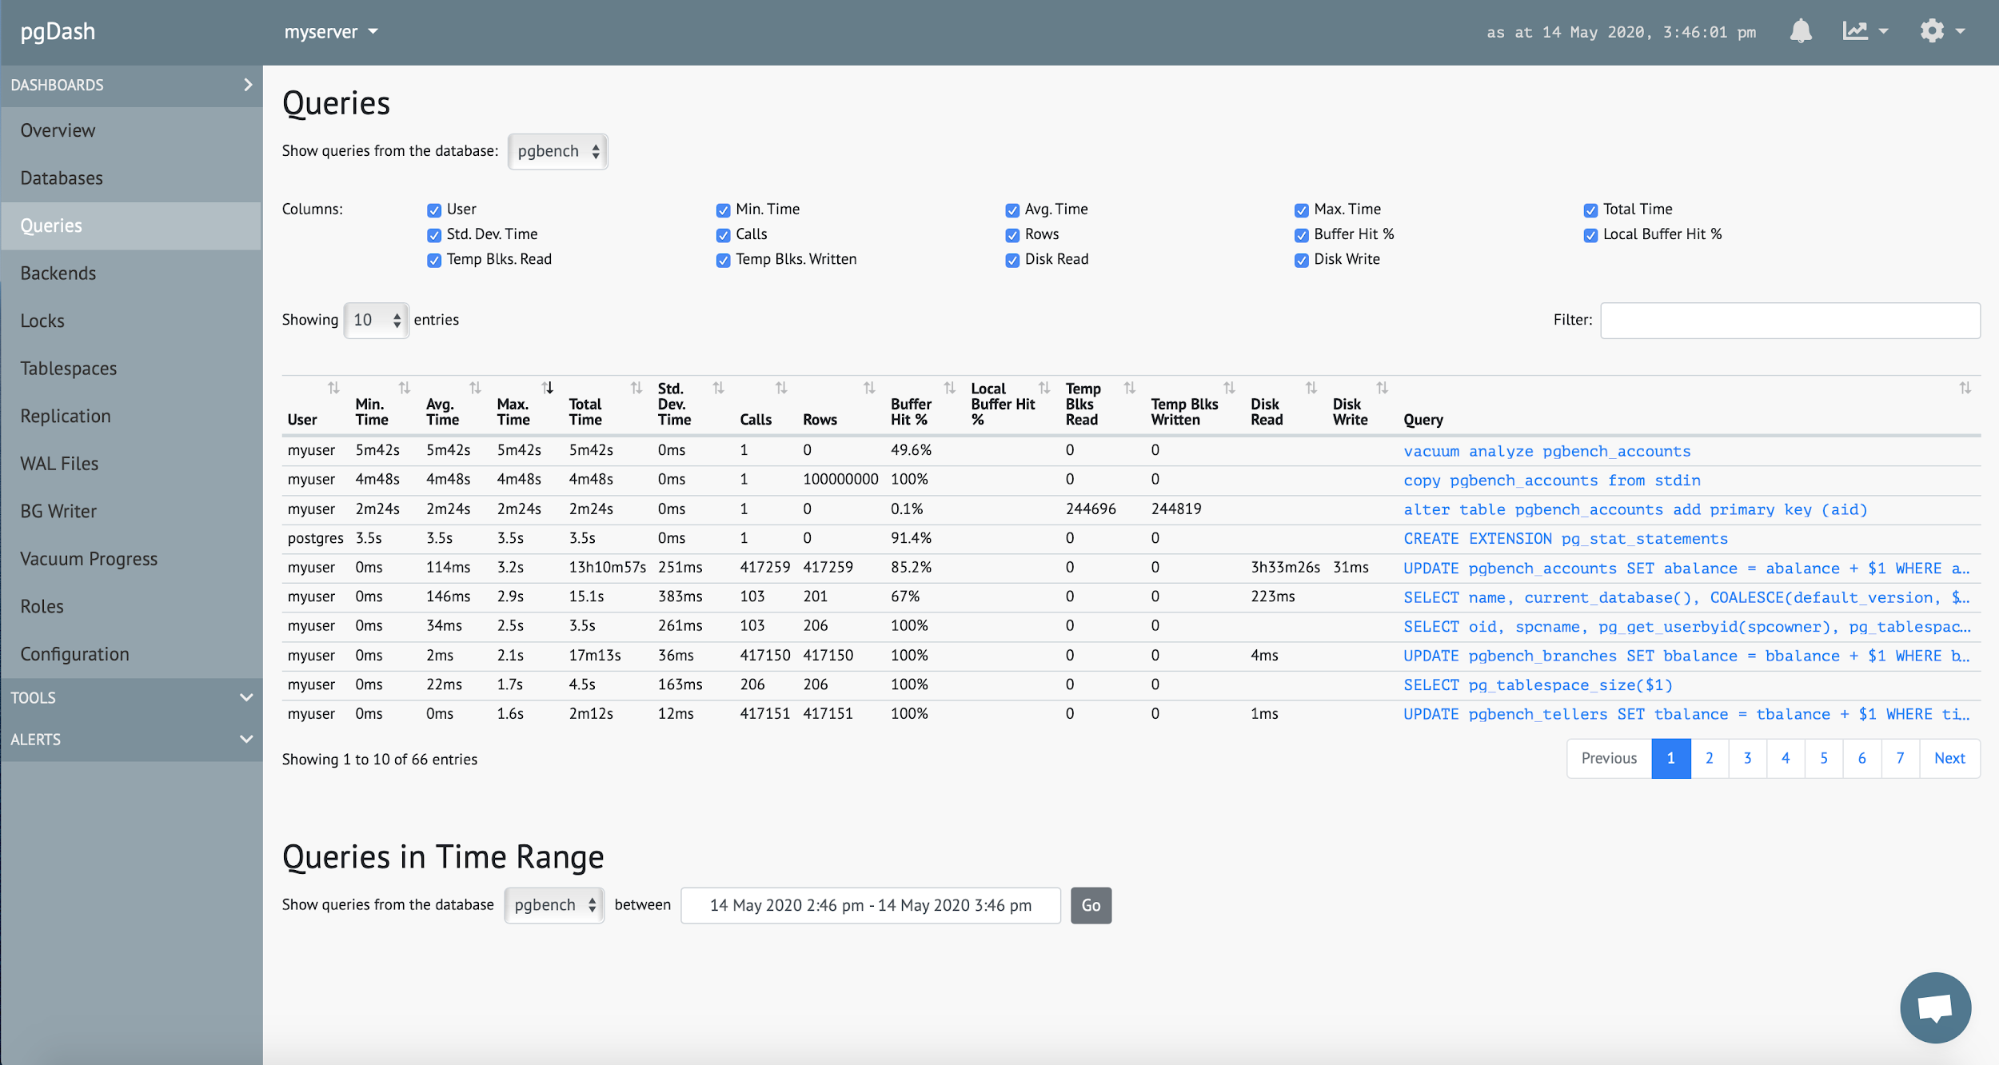
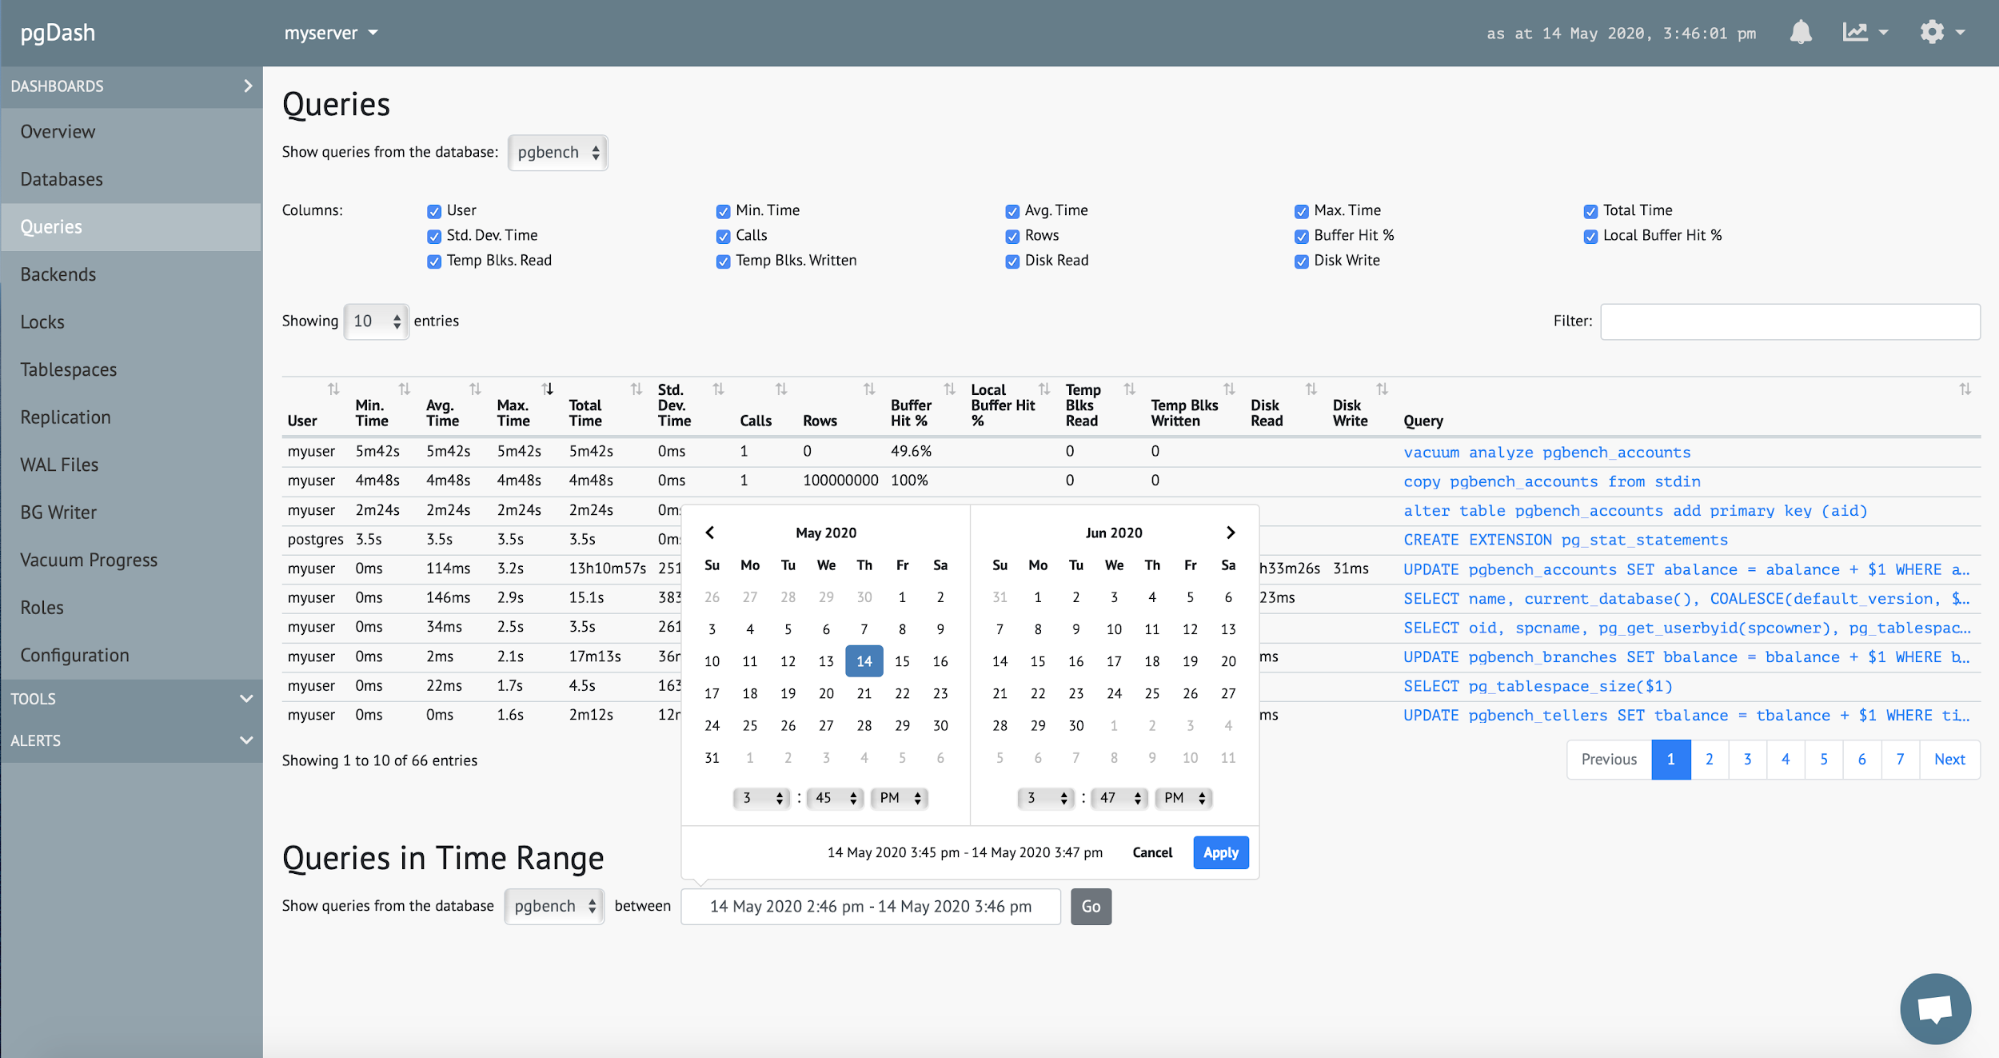
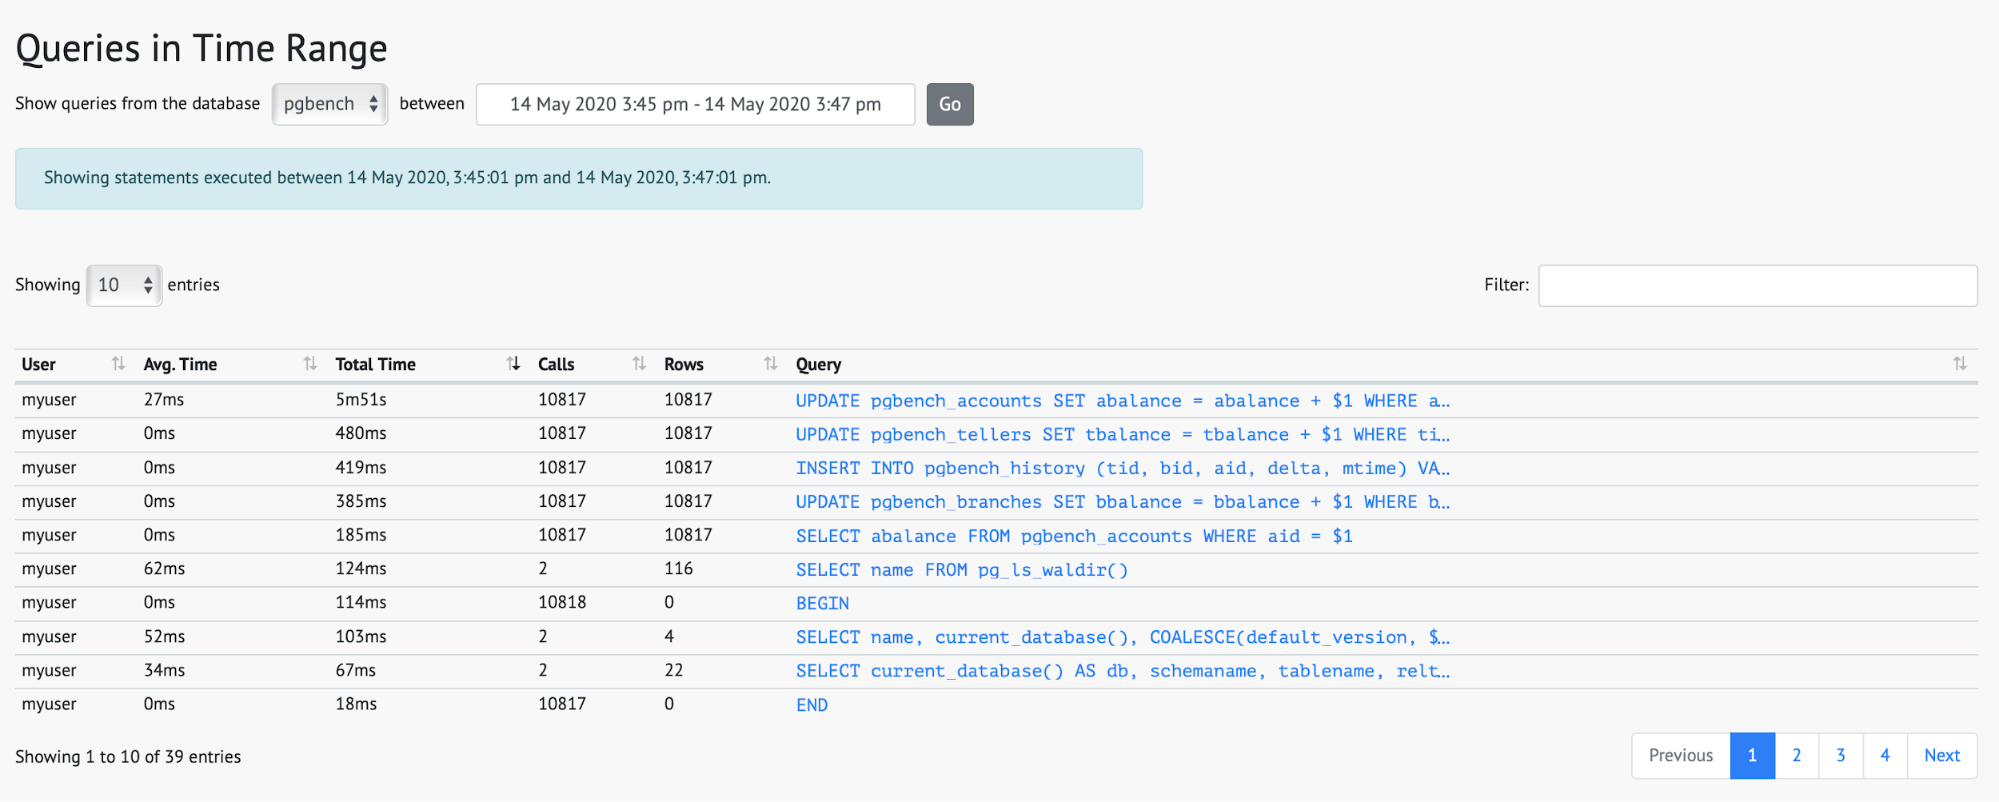
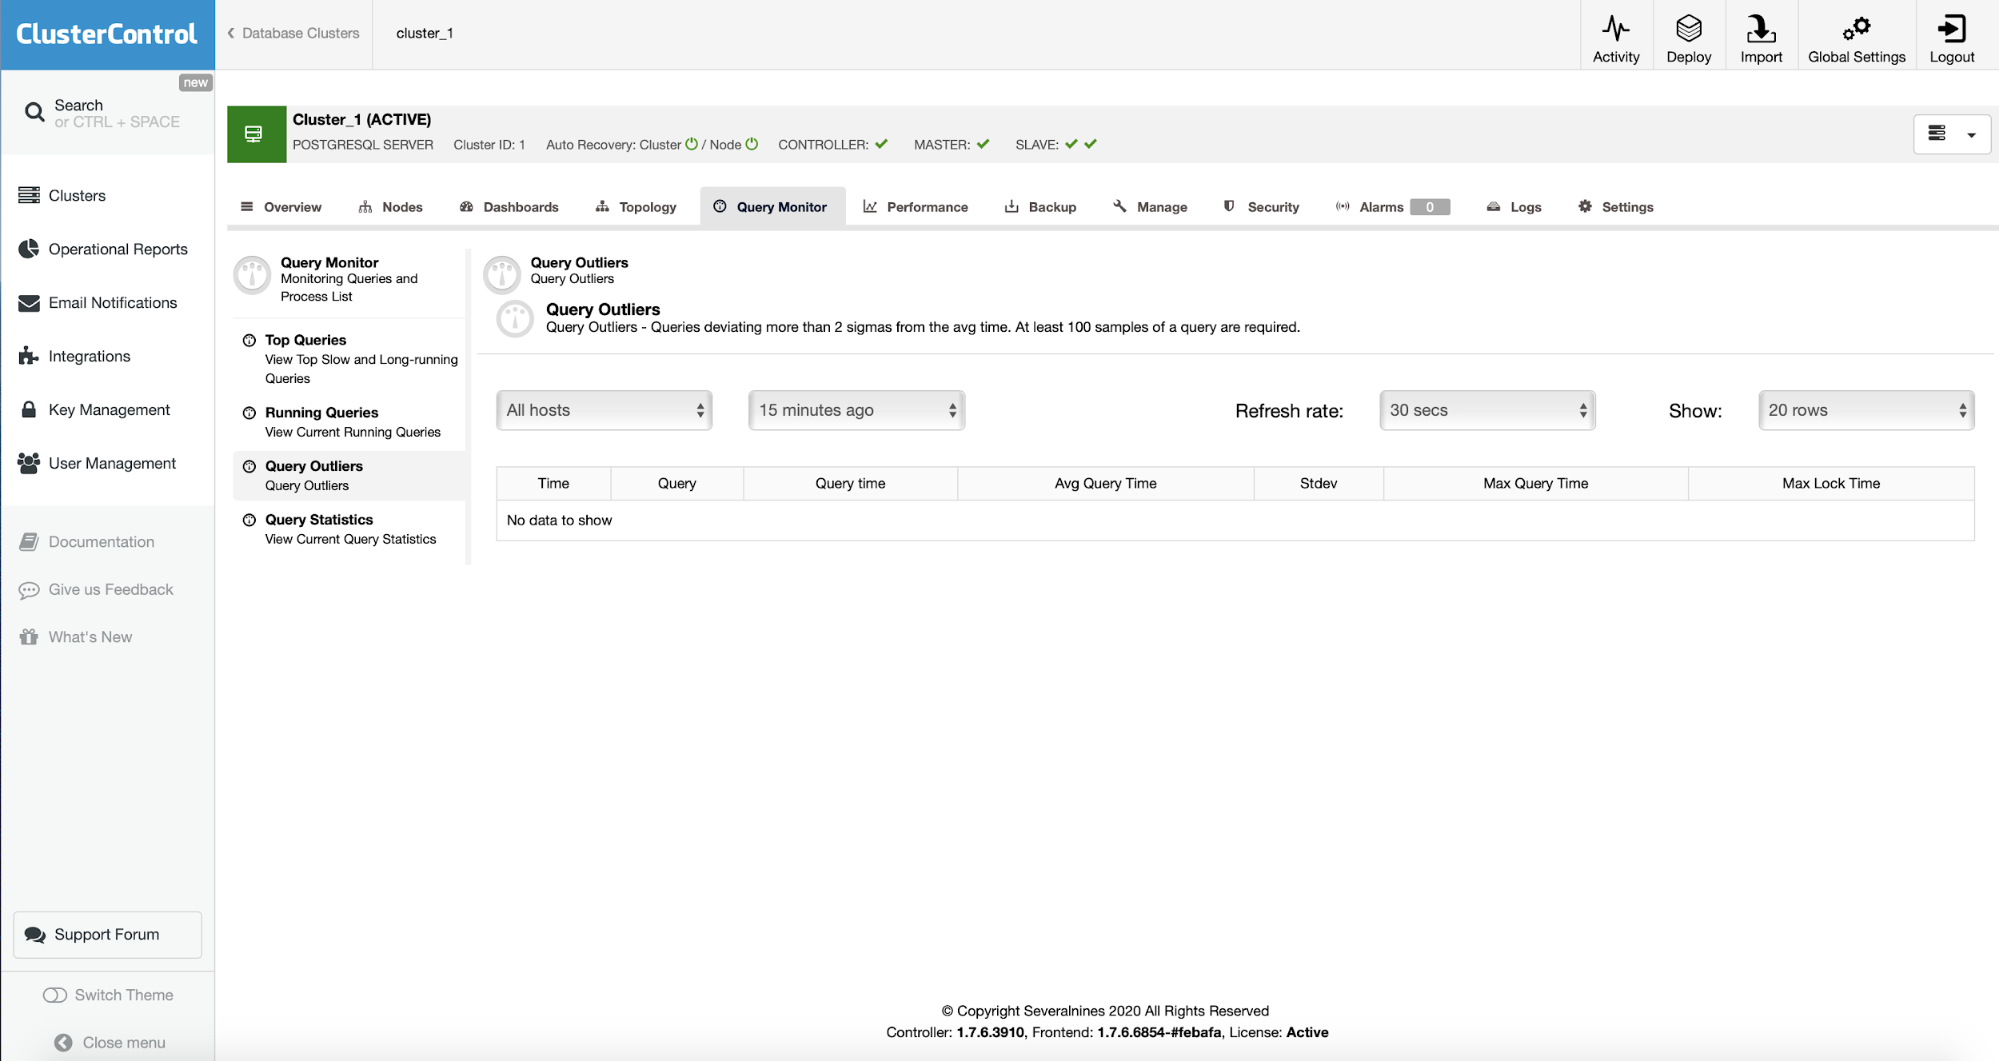
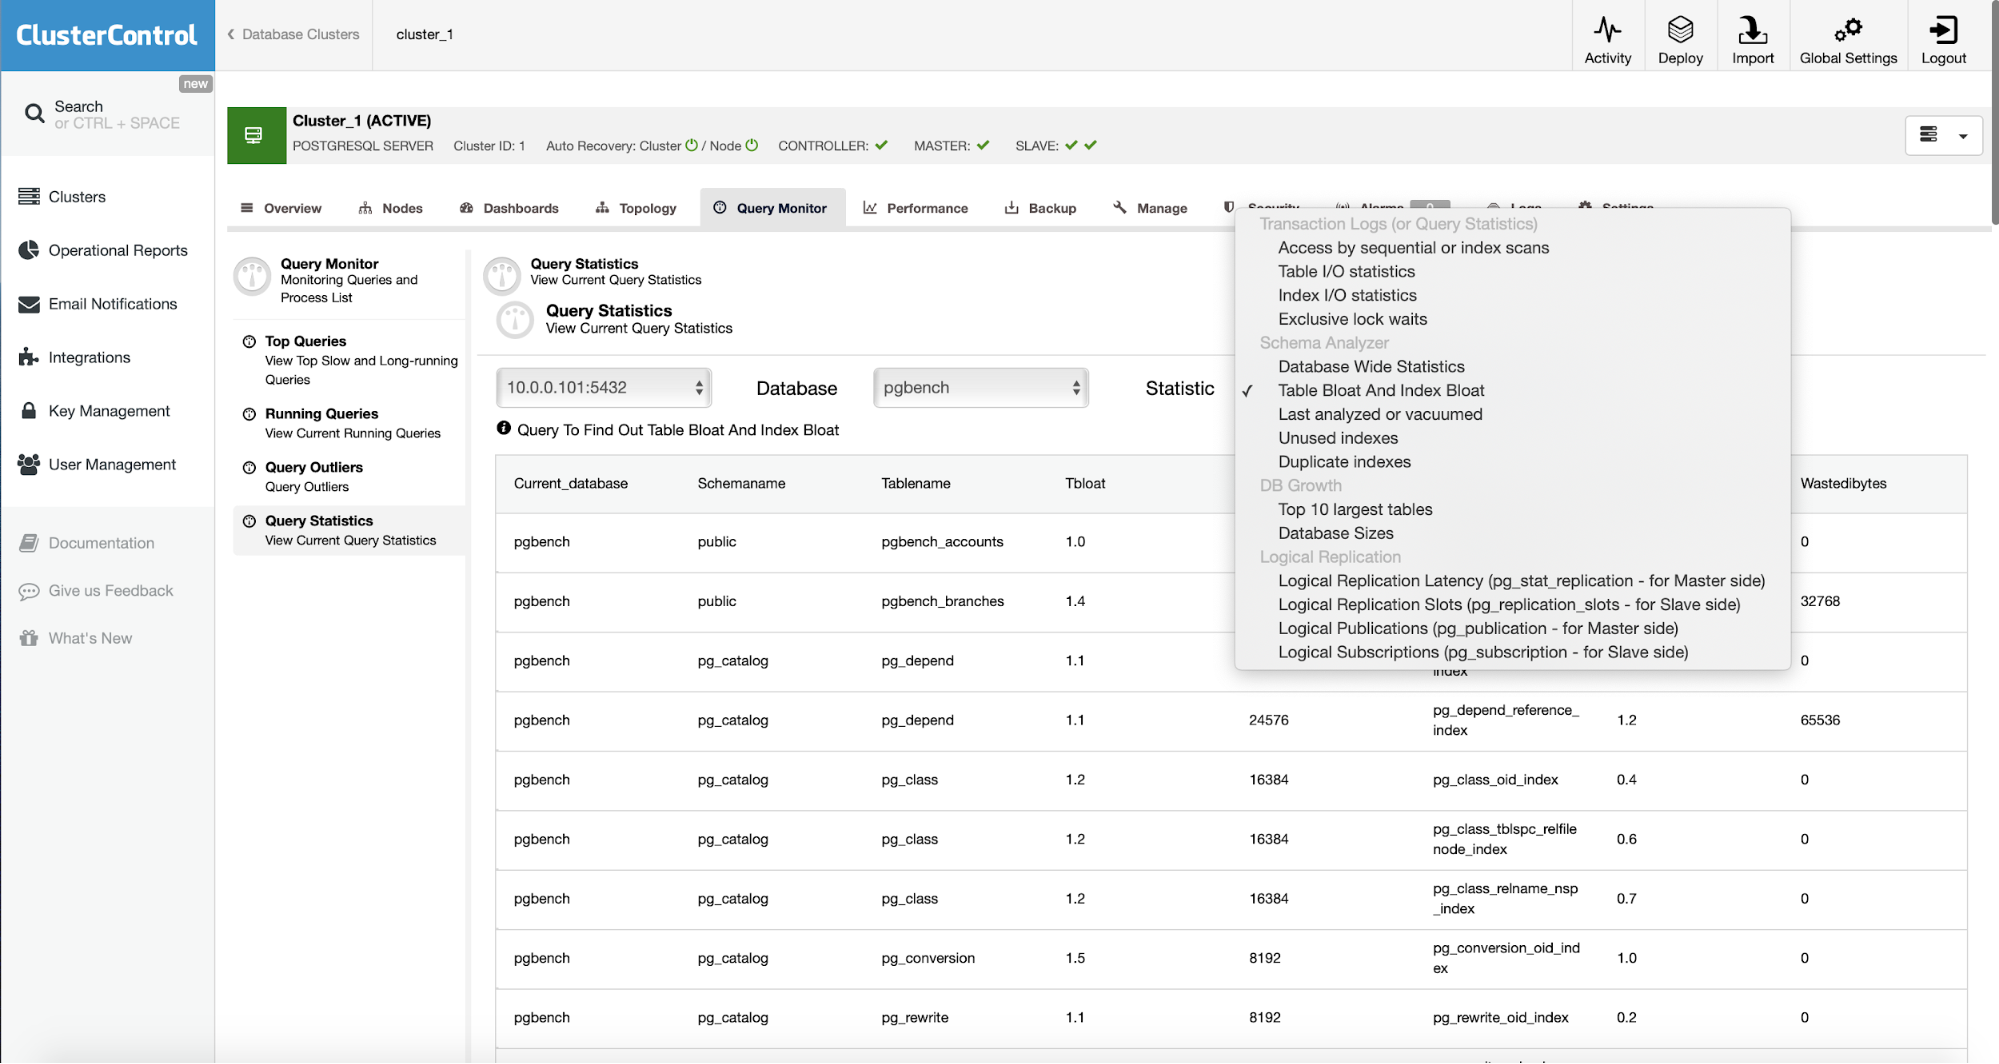
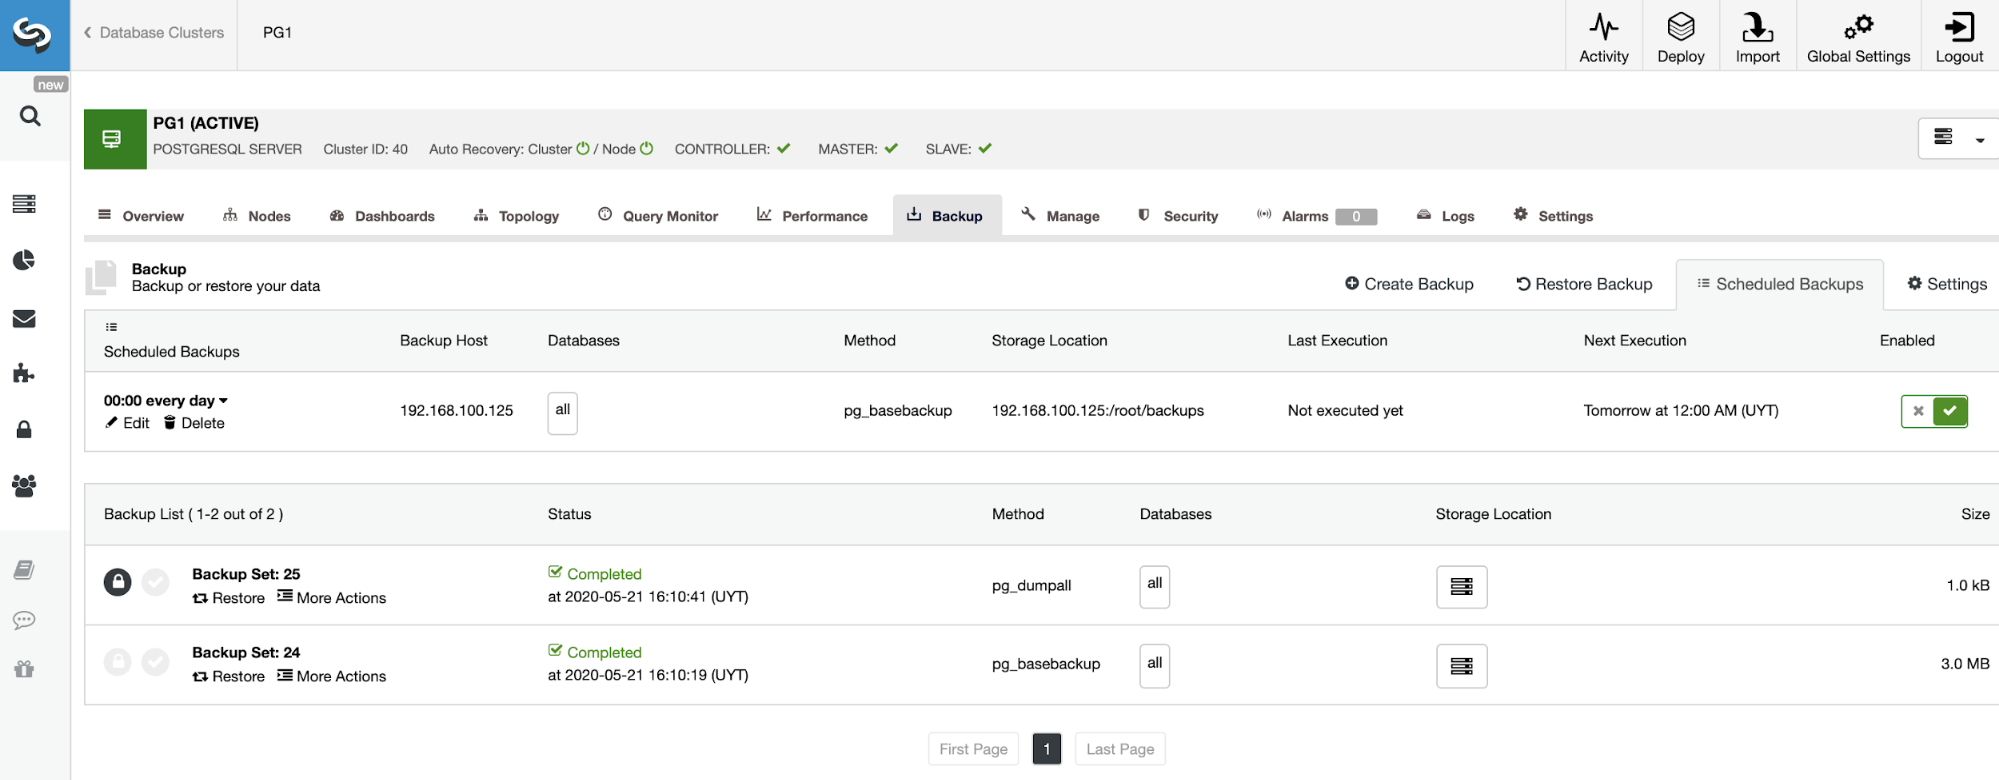
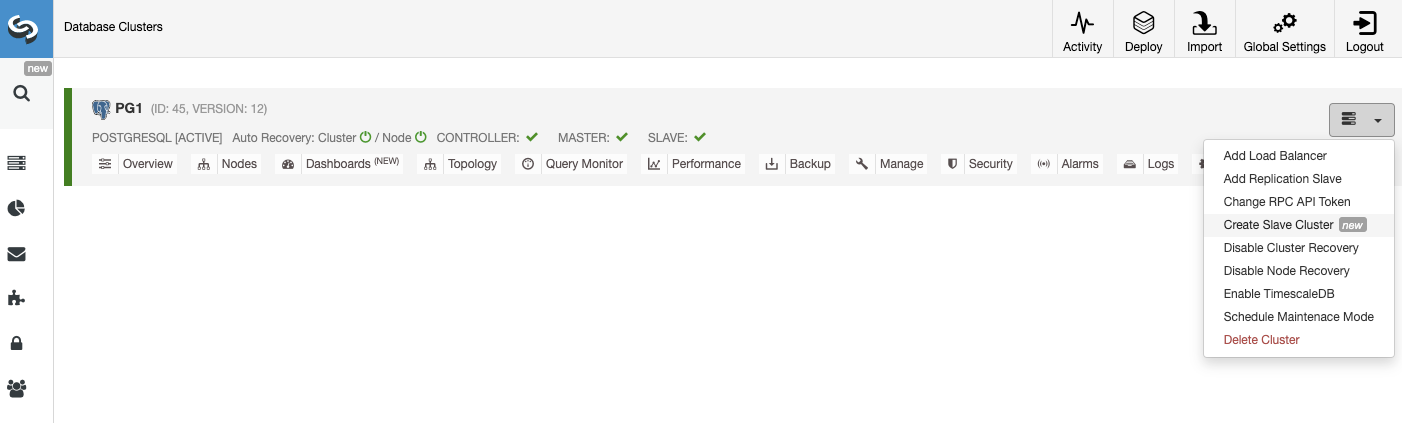
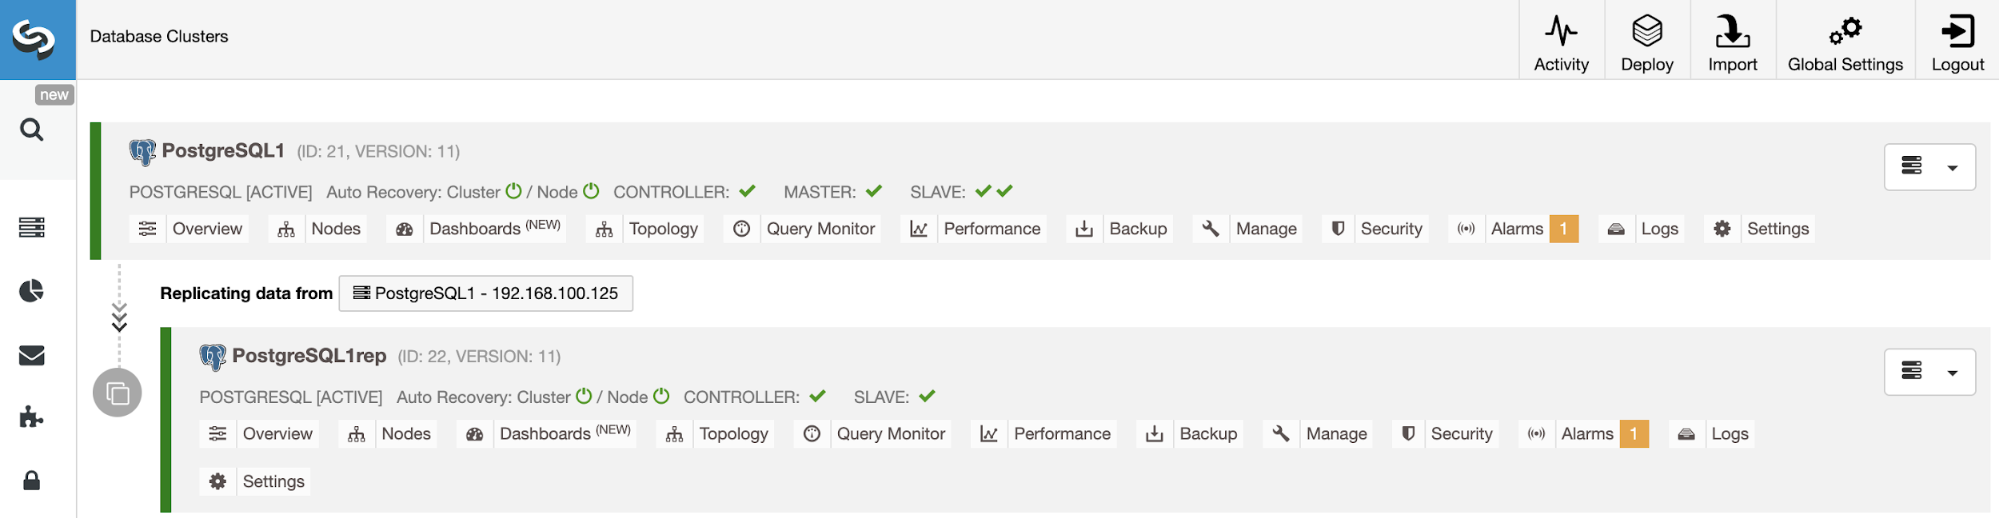
Query Monitoring with ClusterControl

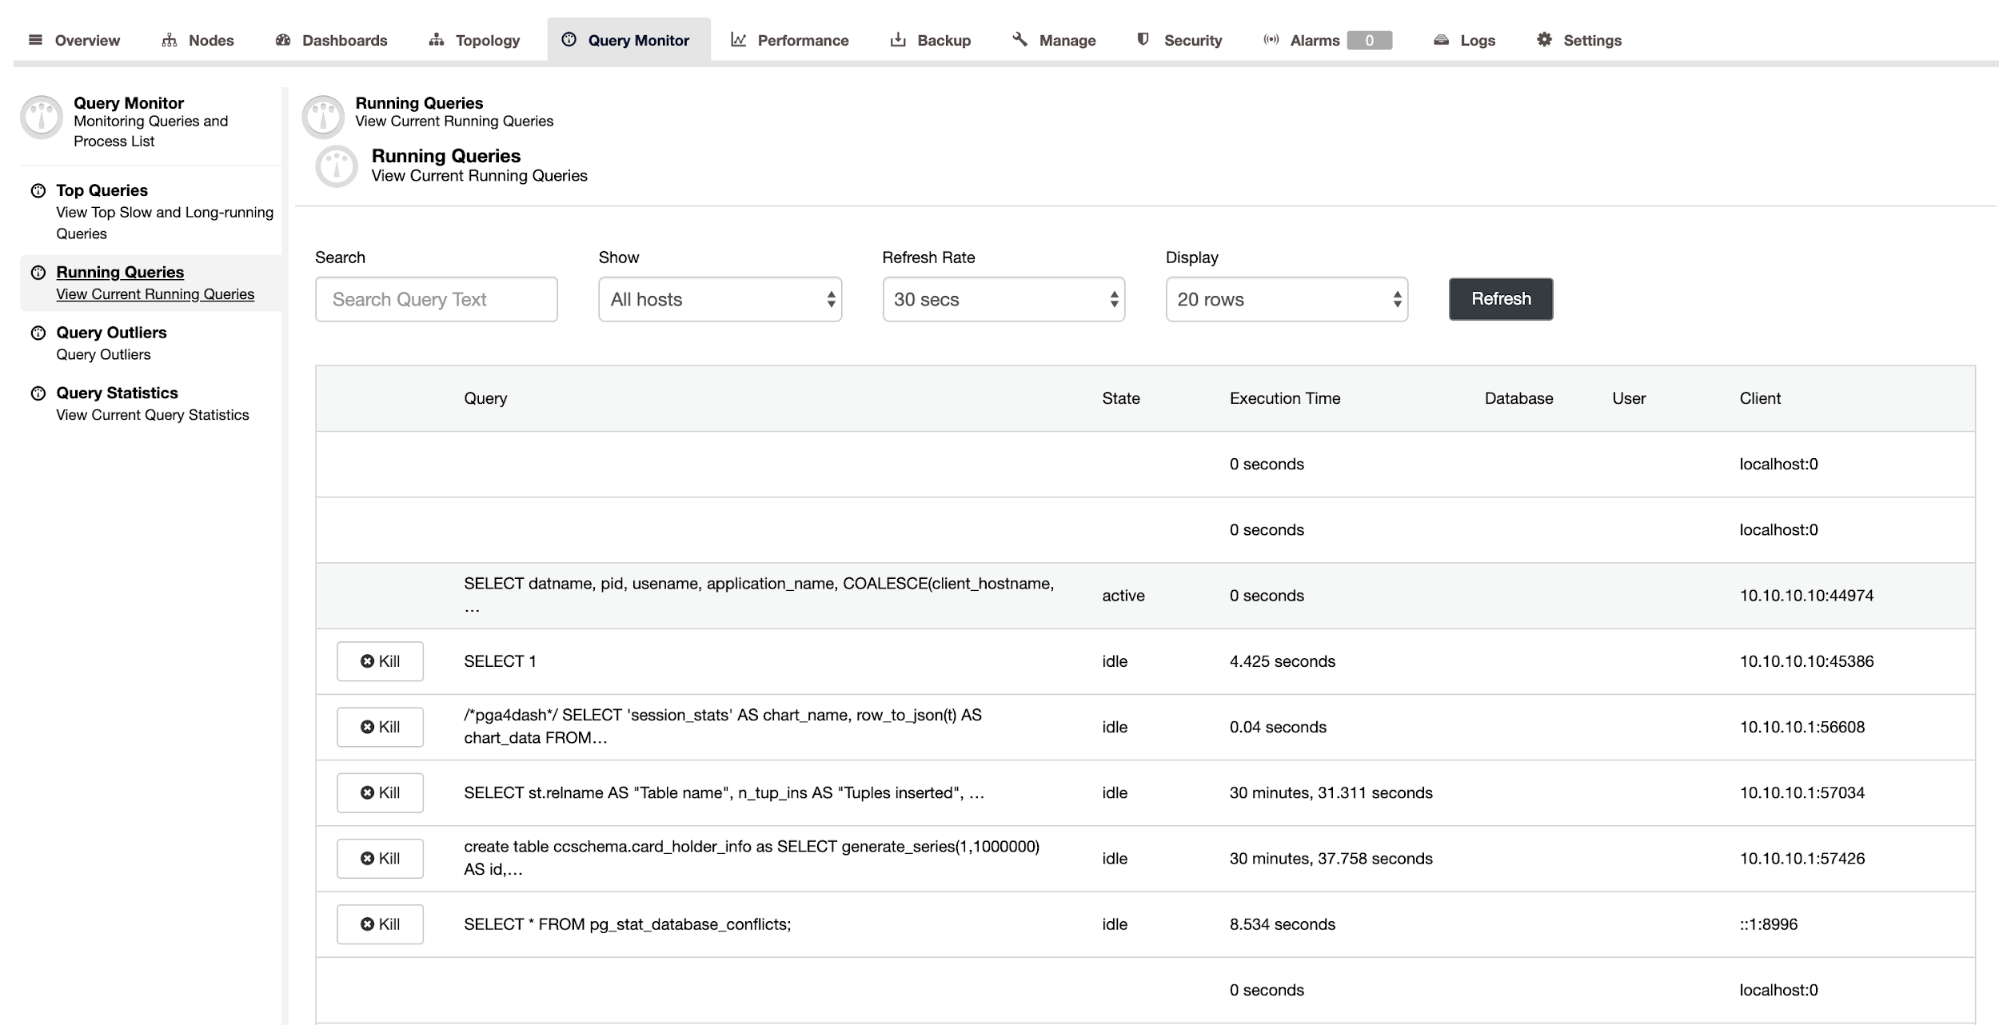
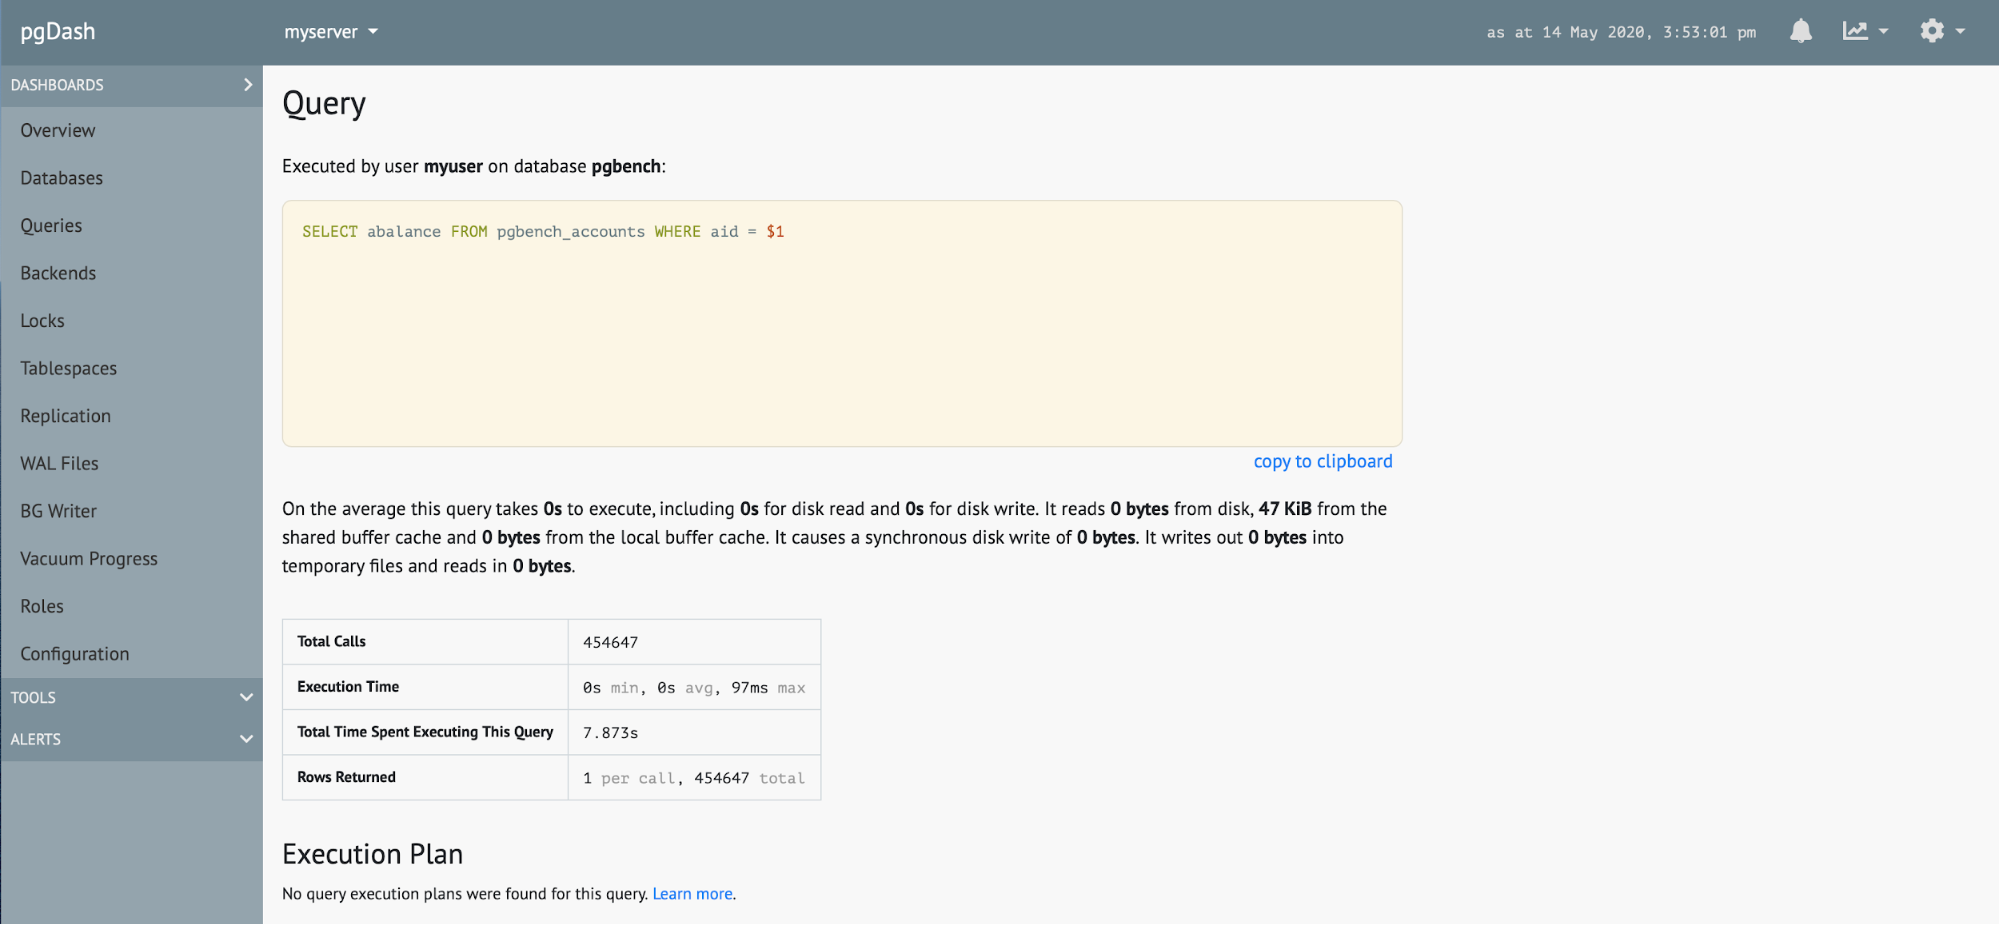
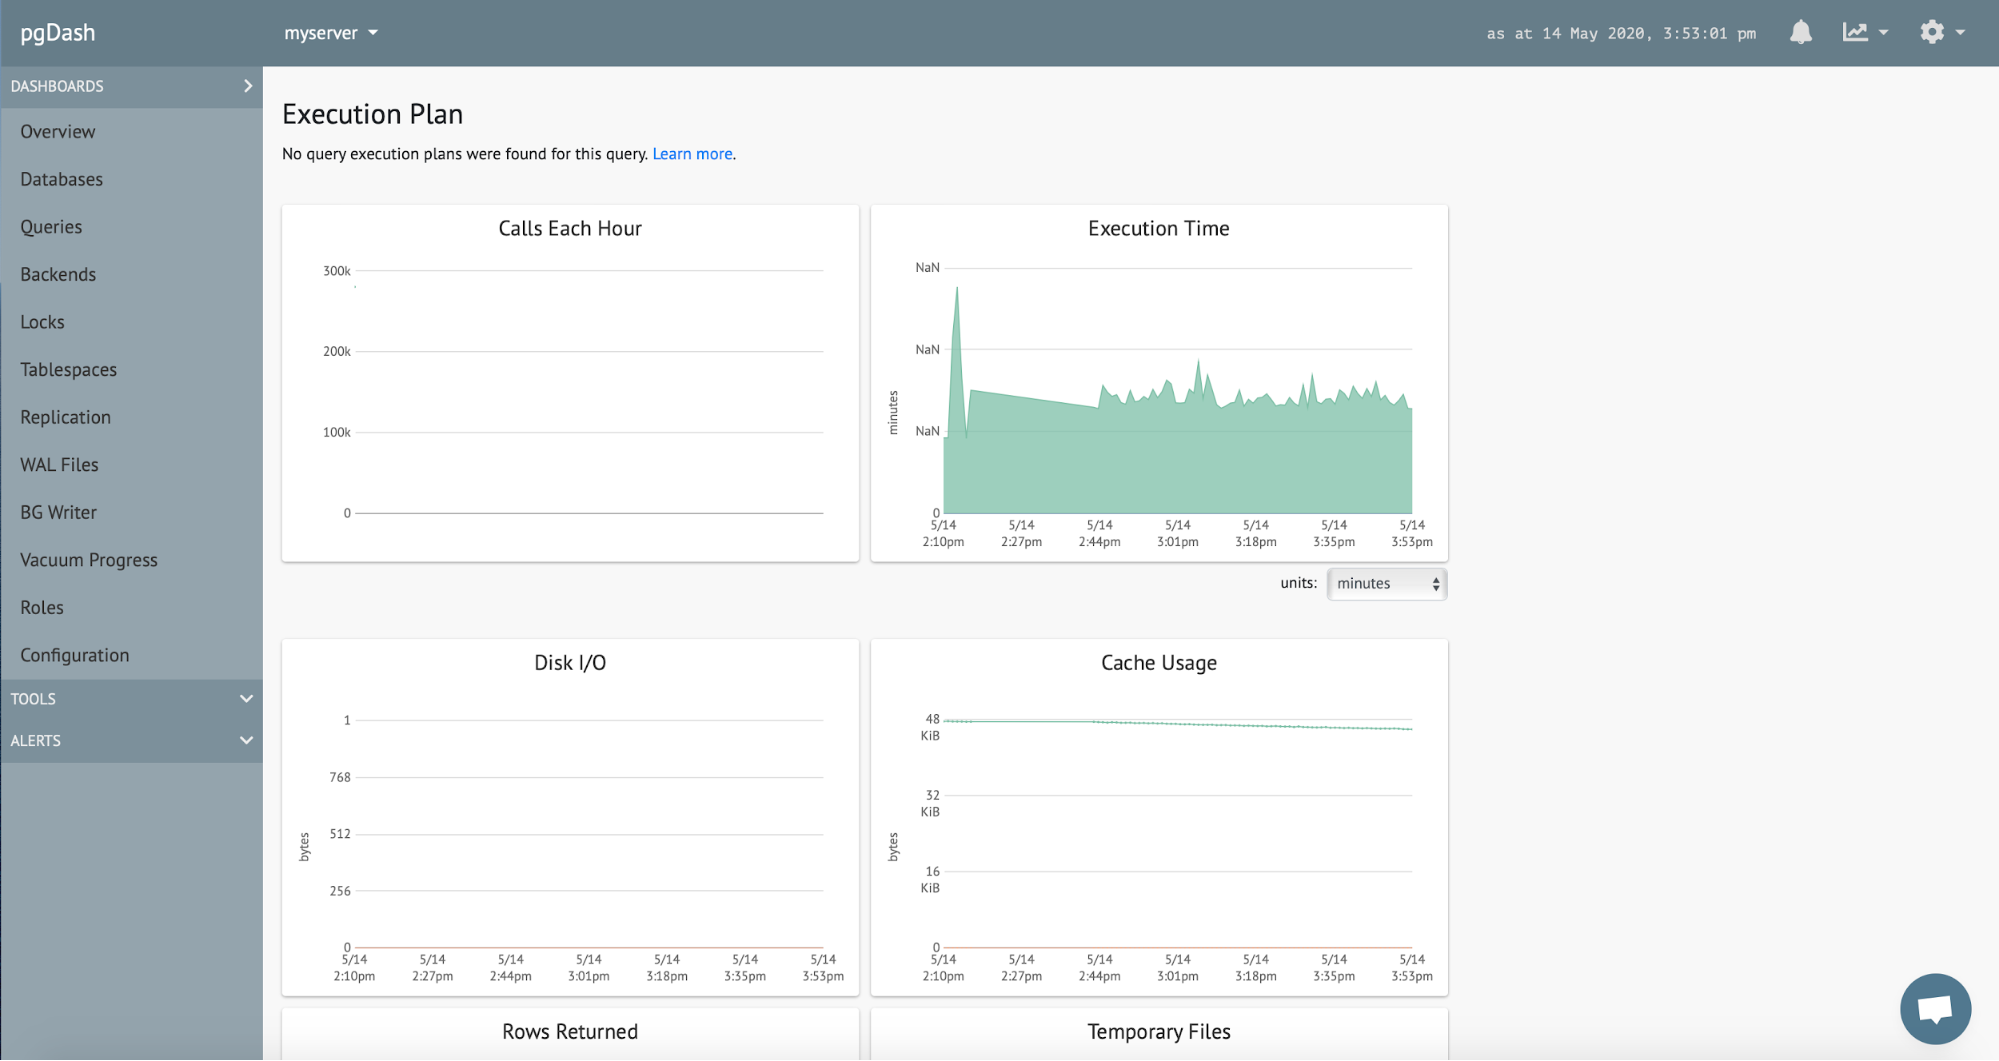
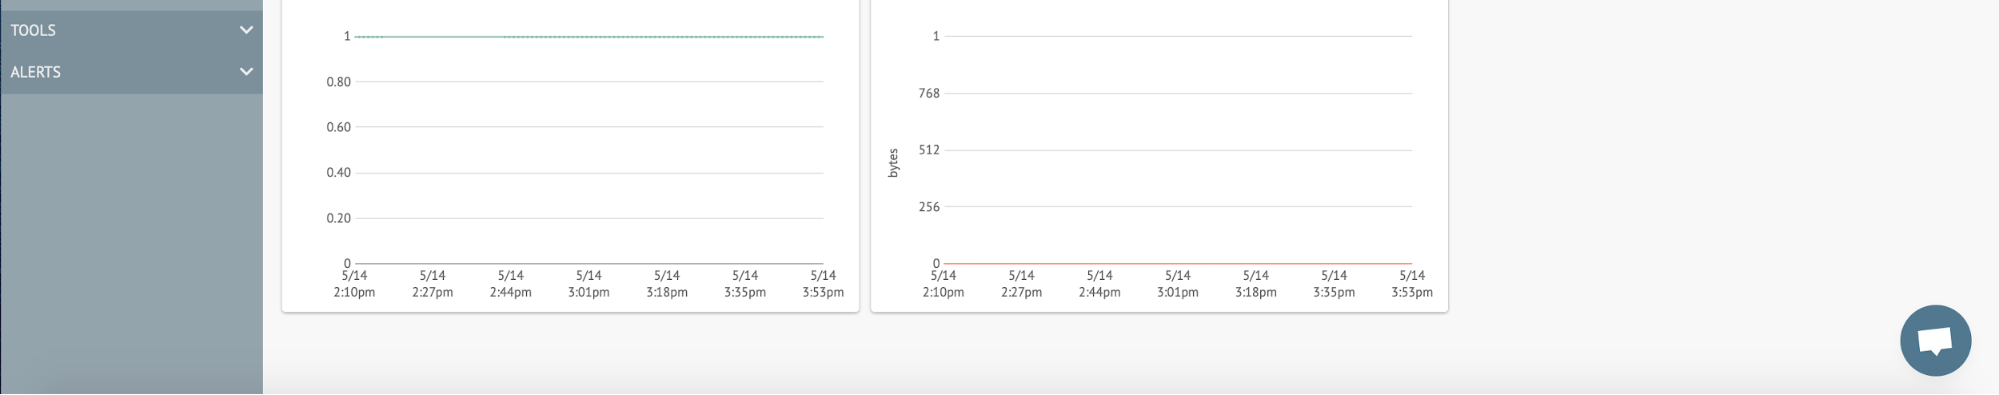
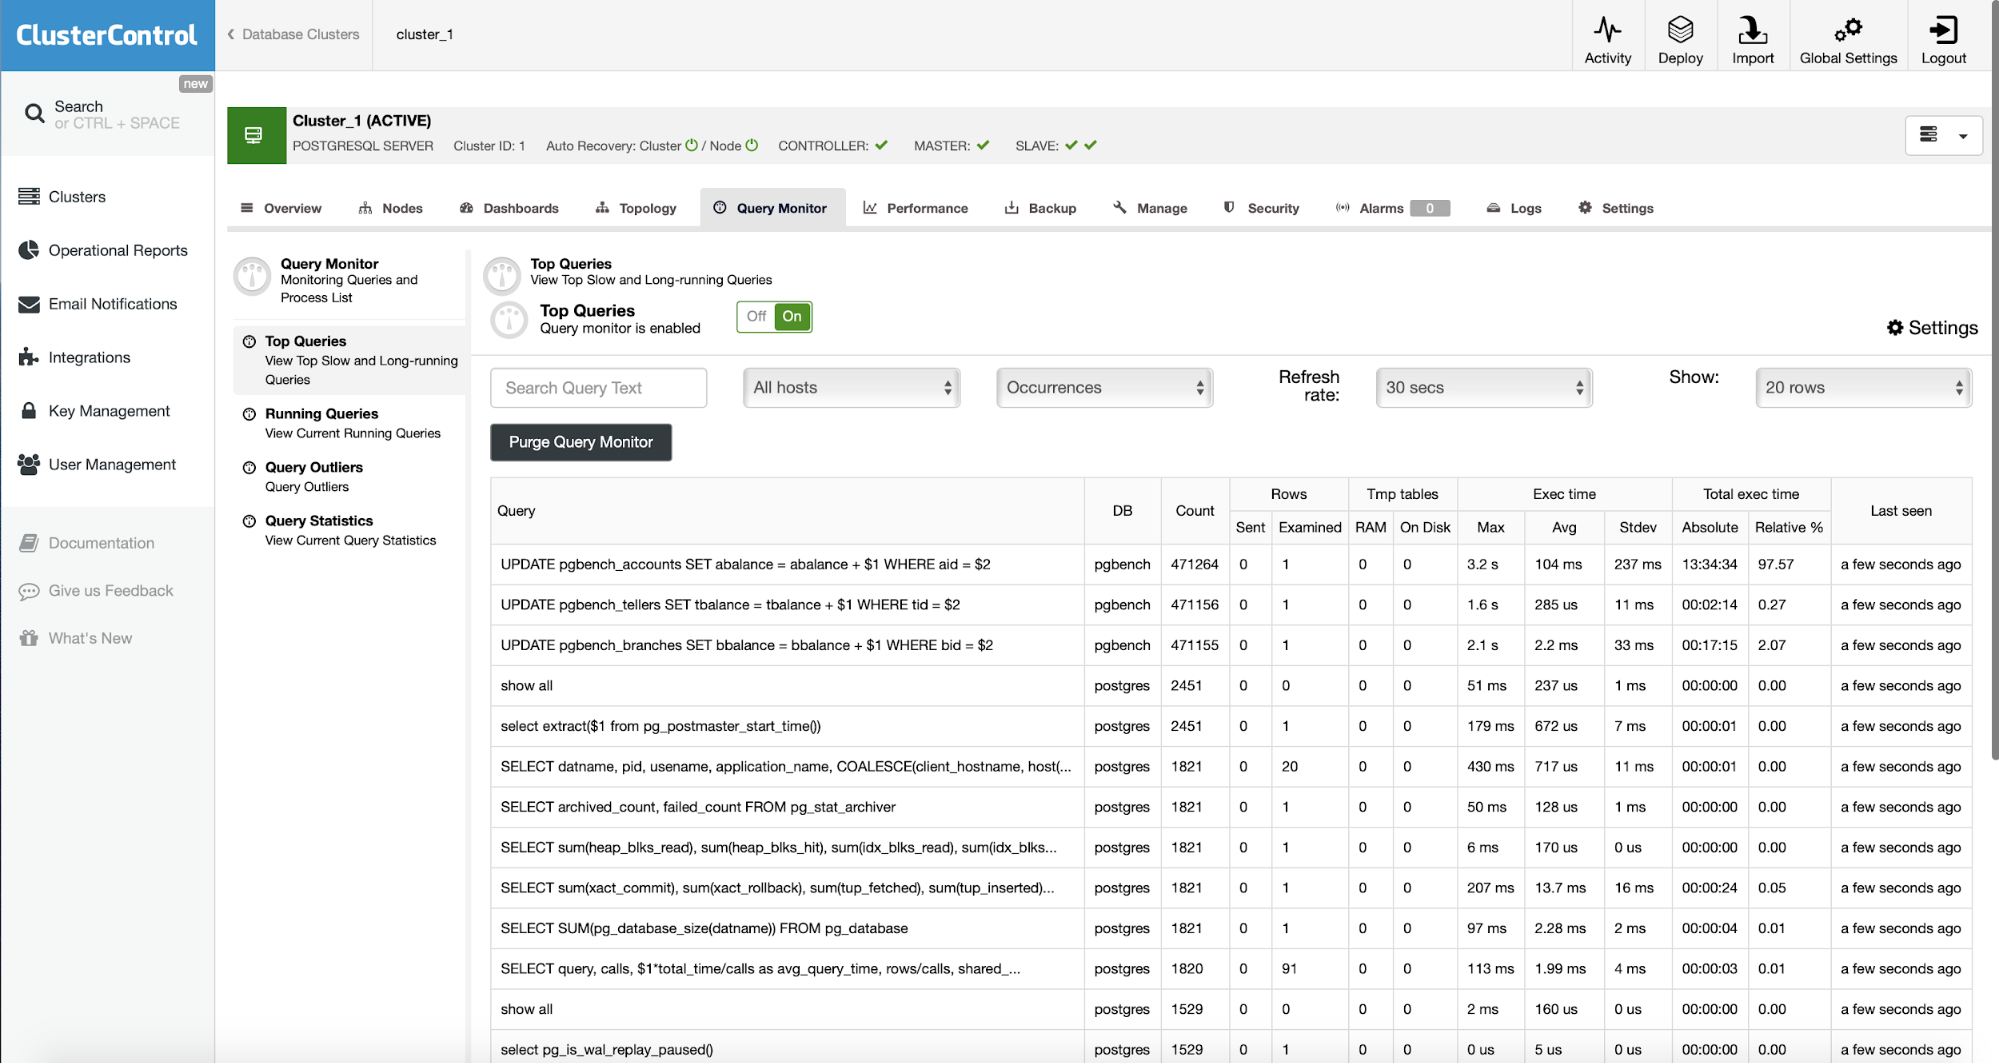
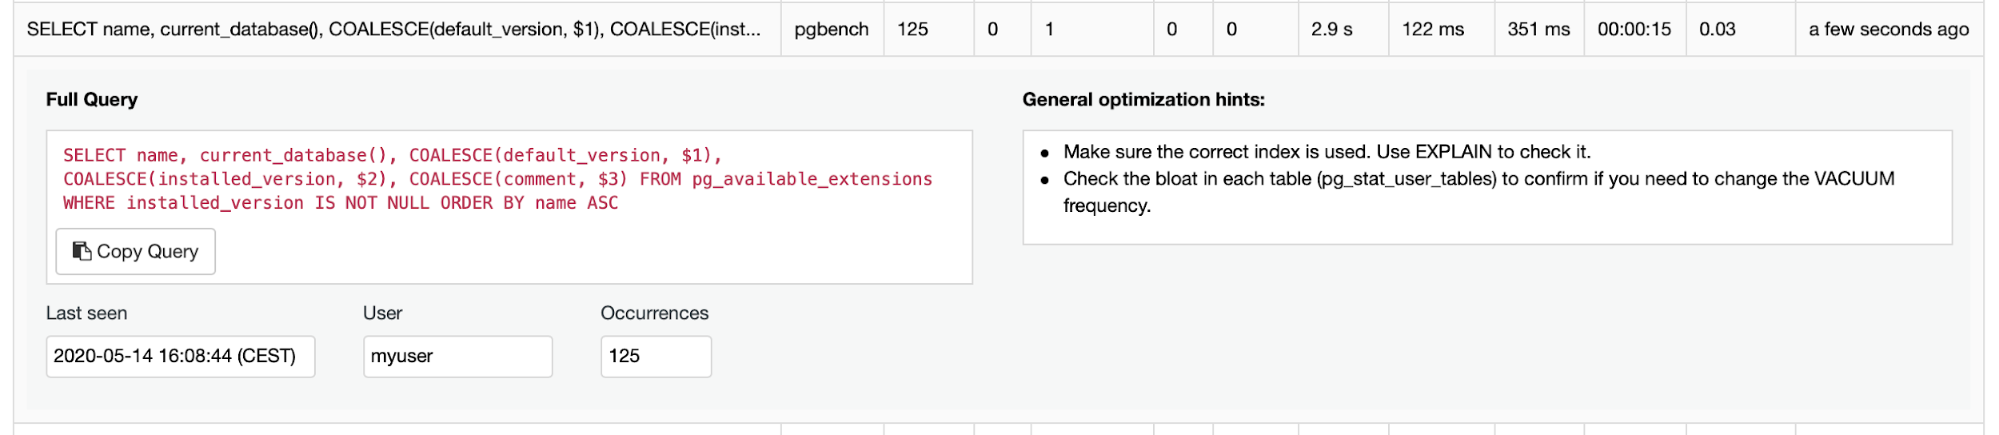
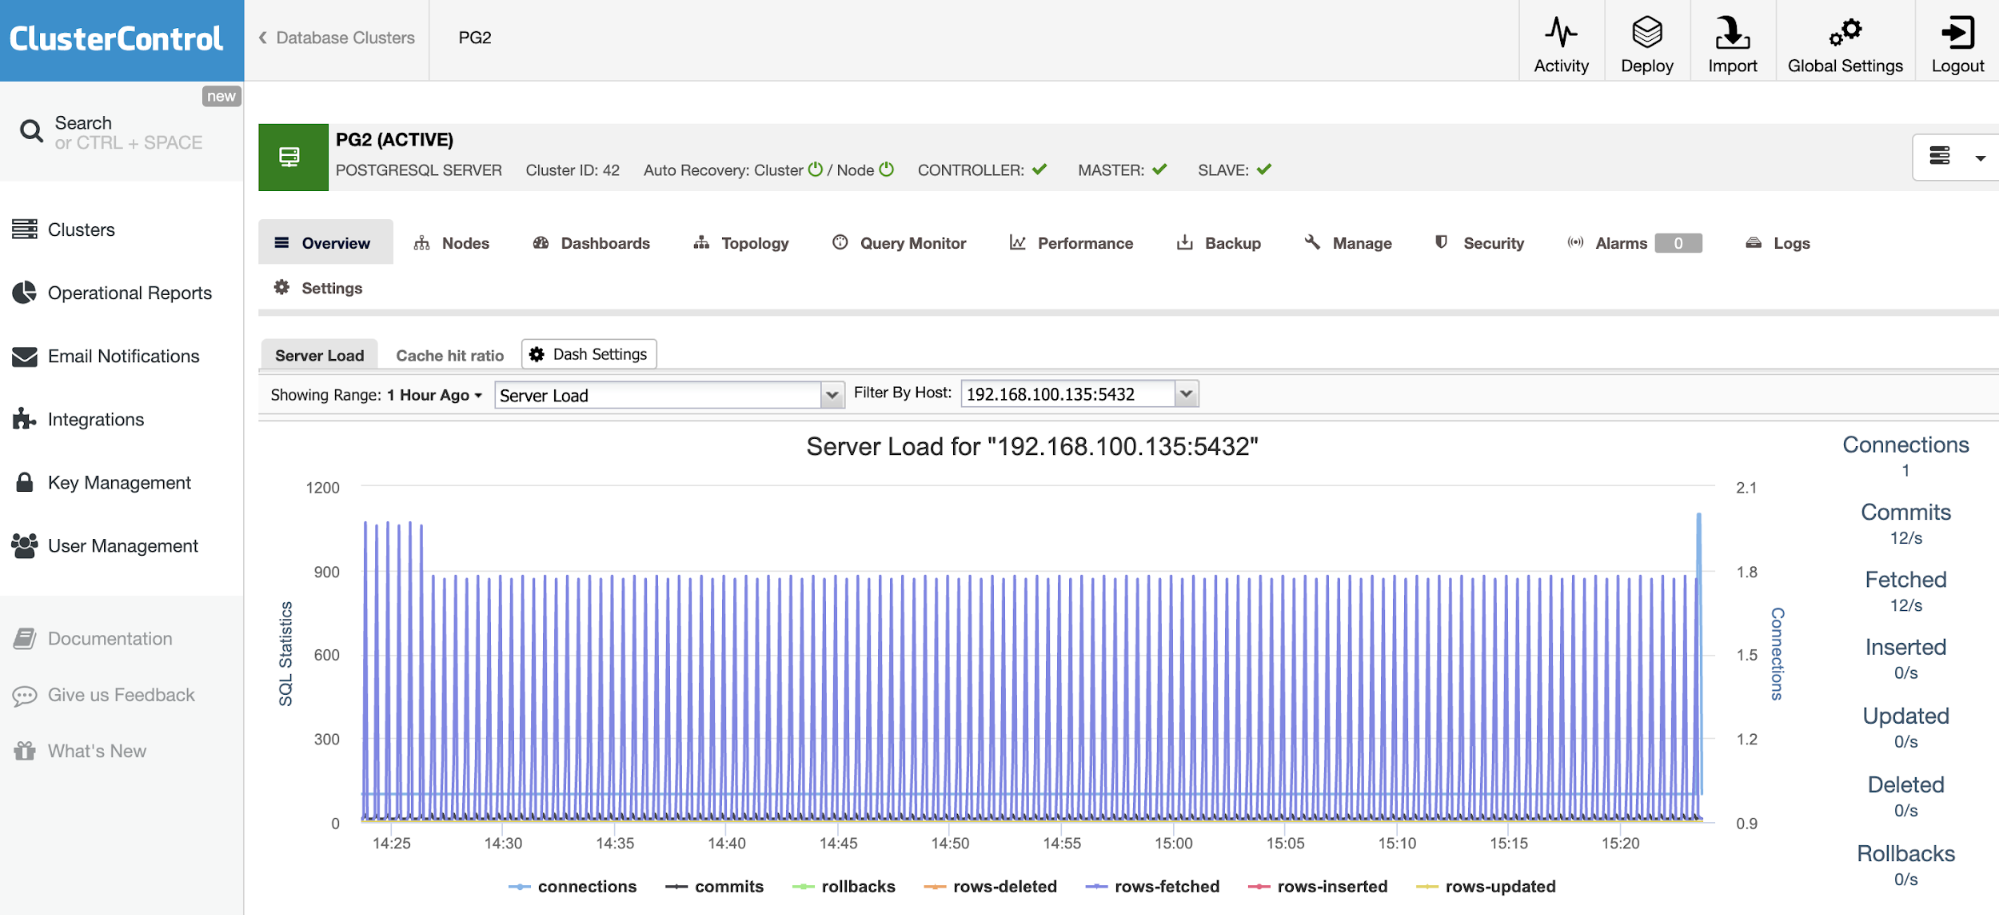
ClusterControl has a Query Monitoring feature you can find in the Query Monitor tab as shown below.

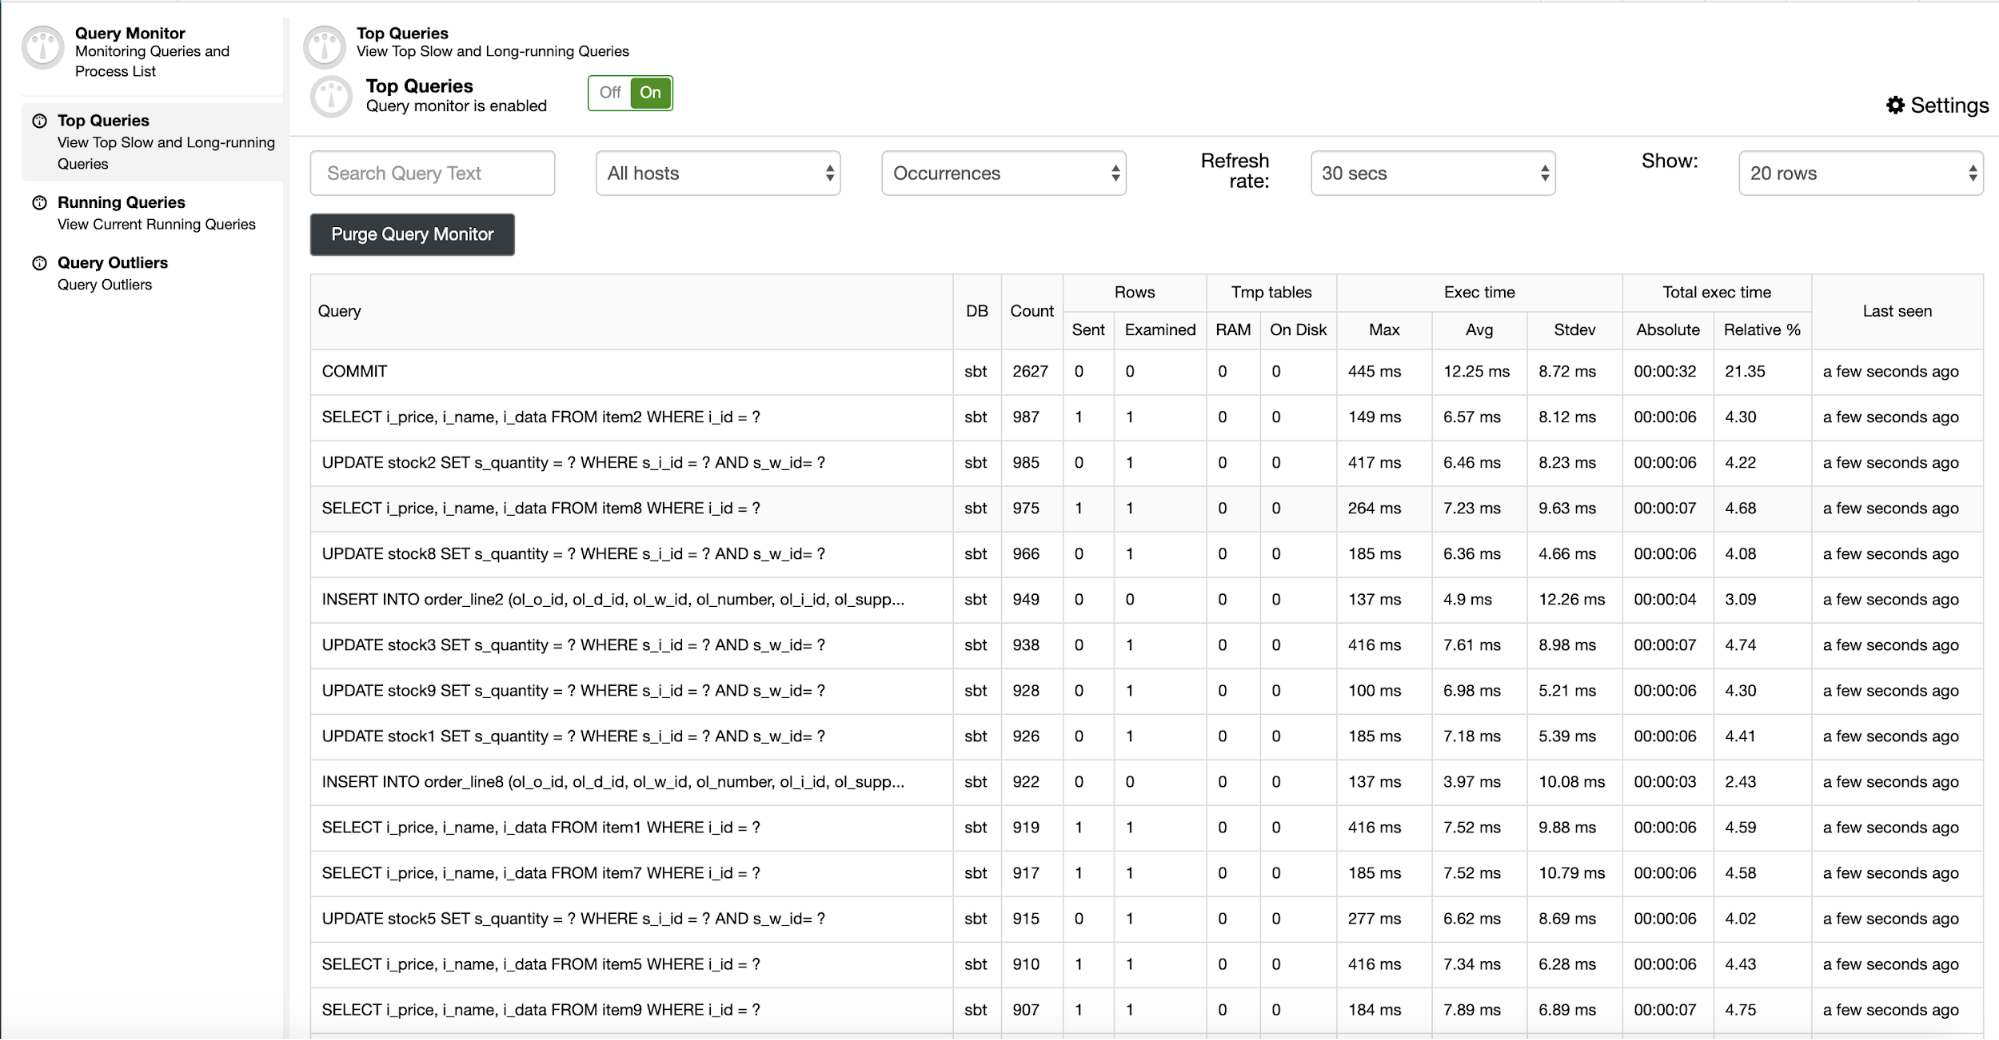
You can see information related to the query that is executed in the database, including statistical information and execution time. You can also configure the Query Monitor Setting which is still on the same page. There is an option to enable the slow query and queries not using index by clicking on Settings

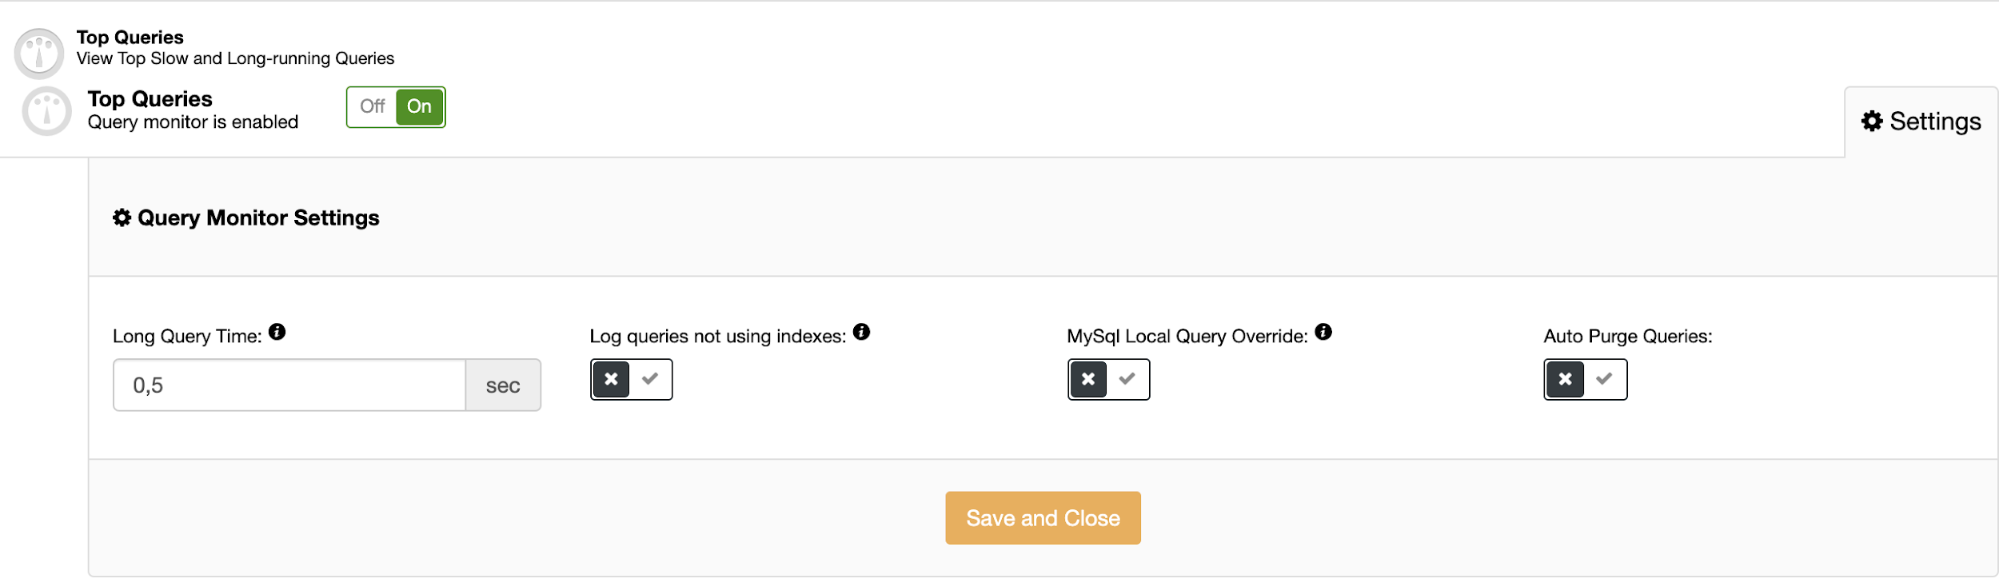
You just need to set the Long Query Time, which is the threshold of the query that categorizes for long based on execution time. Also there is an option to enable the query that is not using indexes.

Conclusion

Monitoring and analyzing the query workload can be beneficial so you know and understand your database workload, both pt-query-digest and the ClusterControl Query Monitor provide information related to the query running in the database to help you achieve that understanding.


Progress Reporting Enhancements in PostgreSQL 12

$
0
0

In PostgreSQL, many DDL commands can take a very long time to execute. PostgreSQL has the ability to report the progress of DDL commands during command execution. Since PostgreSQL 9.6, it has been possible to monitor the progress of running manual VACUUM and autovacuum using a dedicated system catalog (called pg_stat_progress_vacuum).

PostgreSQL 12 has added support for monitoring the progress of a few more commands like CLUSTER, VACUUM FULL,CREATE INDEX, and REINDEX.

Currently, the progress reporting facility is available only for command as below.

  • VACUUM command
  • CLUSTER command
  • VACUUM FULL command
  • CREATE INDEX command
  • REINDEX command

Why is the Progress Reporting Feature in PostgreSQL Important?

This feature is very important for operators when doing some long-running operations, because it is possible to not blindly wait for an operation to finish. 

This is a very useful feature to get some insight like:

  • How much total work there is
  • How much work already done 

Progress reporting feature is also useful when doing performance workload analysis, this is also proving to be useful in evaluating VACUUM job processing for tuning system-level parameters or relation level once depending on load pattern. 

Supported Commands and system catalog

DDL Command

System Catalog

Supported PostgreSQL Version

VACUUM

pg_stat_progress_vacuum

9.6

VACUUM FULL

pg_stat_progress_cluster

12

CLUSTER

pg_stat_progress_cluster

12

CREATE INDEX

pg_stat_progress_create_index

12

REINDEX

pg_stat_progress_create_index

12

How to Monitor the Progress of the VACUUM Command

Whenever the VACUUM command is running, the pg_stat_progress_vacuum view will contain one row for each backend (including autovacuum worker processes) that is currently vacuuming. The view to check the progress of running VACUUM and VACCUM FULL commands is different because the operation phases of both commands are different.

Operation Phases of the VACUUM Command

  1. Initializing
  2. Scanning heap
  3. Vacuuming indexes
  4. Vacuuming heap
  5. Cleaning up indexes
  6. Truncating heap
  7. Performing final cleanup

This view is available in PostgreSQL 12 which gives the following information:

postgres=# \d pg_stat_progress_vacuum ;

           View "pg_catalog.pg_stat_progress_vacuum"

       Column       |  Type   | Collation | Nullable | Default

--------------------+---------+-----------+----------+---------

 pid                | integer |           |          |

 datid              | oid     |           |          |

 datname            | name    |           |          |

 relid              | oid     |           |          |

 phase              | text    |           |          |

 heap_blks_total    | bigint  |           |          |

 heap_blks_scanned  | bigint  |           |          |

 heap_blks_vacuumed | bigint  |           |          |

 index_vacuum_count | bigint  |           |          |

 max_dead_tuples    | bigint  |           |          |

 num_dead_tuples    | bigint  |           |          |

Example:

postgres=# create table test ( a int, b varchar(40), c timestamp );

CREATE TABLE

postgres=# insert into test ( a, b, c ) select aa, bb, cc from generate_series(1,10000000) aa, md5(aa::varchar) bb, now() cc;

INSERT 0 10000000

​postgres=# DELETE FROM test WHERE mod(a,6) = 0;

DELETE 1666666

Session 1:

postgres=# vacuum verbose test;

[. . . waits for completion . . .]

Session 2:

postgres=# select * from pg_stat_progress_vacuum;

-[ RECORD 1 ]------+--------------

pid                | 22800

datid              | 14187

datname            | postgres

relid              | 16388

phase              | scanning heap

heap_blks_total    | 93458

heap_blks_scanned  | 80068

heap_blks_vacuumed | 80067

index_vacuum_count | 0

max_dead_tuples    | 291

num_dead_tuples    | 18

Progress reporting for CLUSTER and VACUUM FULL

CLUSTER and VACUUM FULL command use the same code paths for the relation rewrite, so you can check the progress of both commands using the view pg_stat_progress_cluster.

This view is available in PostgreSQL 12 and it shows the following information: 

postgres=# \d pg_stat_progress_cluster

           View "pg_catalog.pg_stat_progress_cluster"

       Column        |  Type   | Collation | Nullable | Default

---------------------+---------+-----------+----------+---------

 pid                 | integer |           |          | 

 datid               | oid     |           |          | 

 datname             | name    |           |          | 

 relid               | oid     |           |          | 

 command             | text    |           |          | 

 phase               | text    |           |          | 

 cluster_index_relid | bigint  |           |          | 

 heap_tuples_scanned | bigint  |           |          | 

 heap_tuples_written | bigint  |           |          | 

 heap_blks_total     | bigint  |           |          | 

 heap_blks_scanned   | bigint  |           |          | 

 index_rebuild_count | bigint  |           |          | 

Operation Phases of CLUSTER Command

  1. Initializing
  2. Seq scanning heap
  3. Index scanning heap
  4. Sorting tuples
  5. Writing new heap
  6. Swapping relation files
  7. Rebuilding index
  8. Performing final cleanup

Example:

postgres=# create table test as select a,md5(a::text) as txt, now() as date from generate_series(1,3000000) a;

SELECT 3000000

postgres=# create index idx1 on test(a);

CREATE INDEX

postgres=# create index idx2 on test(txt);

CREATE INDEX

postgres=# create index idx3 on test(date);

CREATE INDEX

Now execute the CLUSTER table command and see the progress in pg_stat_progress_cluster. 

Session 1:

postgres=# cluster verbose test using idx1;

[. . . waits for completion . . .]

Session 2:

postgres=# select * from pg_stat_progress_cluster;

 pid  | datid | datname  | relid | command |      phase       | cluster_index_relid | heap_tuples_scanned | heap_tuples_written | heap_blks_total | heap_blks_scanned | index_rebuild_count 

------+-------+----------+-------+---------+------------------+---------------------+---------------------+---------------------+-----------------+-------------------+---------------------

 1273 | 13586 | postgres | 15672 | CLUSTER | rebuilding index |               15680 |             3000000 |             3000000 |               0 |                 0 |                   2

(1 row)

Progress Reporting for CREATE INDEX and REINDEX

Whenever the CREATE INDEX or REINDEX command is running, the pg_stat_progress_create_index view will contain one row for each backend that is currently creating indexes. The progress reporting feature allows to track also the CONCURRENTLY flavors of CREATE INDEX and REINDEX. The internal execution phases of CREATE INDEX and REINDEX commands are the same, so you can check the progress of both commands using the same view.

postgres=# \d pg_stat_progress_create_index 

        View "pg_catalog.pg_stat_progress_create_index"

       Column       |  Type   | Collation | Nullable | Default

--------------------+---------+-----------+----------+---------

 pid                | integer |           |          | 

 datid              | oid     |           |          | 

 datname            | name    |           |          | 

 relid              | oid     |           |          | 

 phase              | text    |           |          | 

 lockers_total      | bigint  |           |          | 

 lockers_done       | bigint  |           |          | 

 current_locker_pid | bigint  |           |          | 

 blocks_total       | bigint  |           |          | 

 blocks_done        | bigint  |           |          | 

 tuples_total       | bigint  |           |          | 

 tuples_done        | bigint  |           |          | 

 partitions_total   | bigint  |           |          | 

 partitions_done    | bigint  |           |          | 

Operation Phases of CREATE INDEX / REINDEX

  1. Initializing
  2. Waiting for writers before build
  3. Building index
  4. Waiting for writers before validation
  5. Index validation: scanning index
  6. Index validation:  sorting tuples
  7. Index validation: scanning table
  8. Waiting for old snapshots
  9. Waiting for readers before marking dead
  10. Waiting for readers before dropping

Example:

postgres=# create table test ( a int, b varchar(40), c timestamp );

CREATE TABLE


postgres=# insert into test ( a, b, c ) select aa, bb, cc from generate_series(1,10000000) aa, md5(aa::varchar) bb, now() cc;

INSERT 0 10000000


postgres=# CREATE INDEX idx ON test (b);

CREATE INDEX

Session 1:

postgres=# CREATE INDEX idx ON test (b);

[. . . waits for completion . . .]

Session 2:

postgres=# SELECT * FROM pg_stat_progress_create_index;

-[ RECORD 1 ]------+-------------------------------

pid                | 19432

datid              | 14187

datname            | postgres

relid              | 16405

index_relid        | 0

command            | CREATE INDEX

phase              | building index: scanning table

lockers_total      | 0

lockers_done       | 0

current_locker_pid | 0

blocks_total       | 93458

blocks_done        | 46047

tuples_total       | 0

tuples_done        | 0

partitions_total   | 0

partitions_done    | 0


postgres=# SELECT * FROM pg_stat_progress_create_index;

-[ RECORD 1 ]------+---------------------------------------

pid                | 19432

datid              | 14187

datname            | postgres

relid              | 16405

index_relid        | 0

command            | CREATE INDEX

phase              | building index: loading tuples in tree

lockers_total      | 0

lockers_done       | 0

current_locker_pid | 0

blocks_total       | 0

blocks_done        | 0

tuples_total       | 10000000

tuples_done        | 4346240

partitions_total   | 0

partitions_done    | 0

Conclusion

PostgreSQL version 9.6 onward has the ability to report the progress of certain commands during command execution. This is a really nice feature for DBA’s, Developers, and users to check the progress of long running commands. This reporting capability may extend for some other commands in future. You can read more about this new feature in the PostgreSQL documentation.

Manage Engine HAProxy Monitoring Alternatives - ClusterControl HAProxy Monitoring

$
0
0

In a previous blog, we looked at the differences between ManageEngine Applications Manager and ClusterControl, examining the main features of each and comparing them. In this blog we will focus on the monitoring of HAProxy, how to monitor an HAProxynode and compare the specific monitoring features of these two tools.

For this blog, we’ll assume you already have Applications Manager or ClusterControl installed.

HAProxy Monitoring Usage Comparison

Manage Engine Applications Manager

To start monitoring your HAProxy node, it must be installed previously, as you only can import it here. In your Applications Manager server, go to New Monitor -> Add New Monitor. You’ll see all the available options to monitor, so you need to choose the HAProxy option under the Web Server/Services section.

Now you must specify the following information of your HAProxy node: 

  • Display Name: It’ll be used to identify the node.
  • Hostname/IP Address: Of the existing HAProxy node.
  • Admin Port: It’s specified in the HAProxy configuration file.
  • Credentials: Admin credentials if needed.
  • Stats URL: URL to access the HAProxy stats.

Before pressing “Add Monitor”, you can test the credentials to confirm that it’s working correctly.

After you have your HAProxy monitored by Application Manager, you can access it from the Home section.

ClusterControl

In this case, it’s not necessary to have the HAProxy node installed, as you can deploy it using ClusterControl. We’ll assume you have a Database Cluster added into ClusterControl, so if you go to the cluster actions, you’ll see the Add Load Balancer option.

In this step, you can choose if you want to Deploy or Import it.

For the deployment, you must specify the following information:

  • Server Address: IP Address for your HAProxy server.
  • Listen Port (Read/Write): Port for read/write traffic.
  • Listen Port (Read-Only): Port for read-only traffic.
  • Policy: It can be:
    • leastconn: The server with the lowest number of connections receives the connection
    • roundrobin: Each server is used in turns, according to their weights
    • source: The source IP address is hashed and divided by the total weight of the running servers to designate which server will receive the request
  • Build from Source: You can choose Install from a package manager or build from source.
  • And you need to select which servers you want to add to the HAProxy configuration and some additional information like:
  • Role: It can be Active or Backup.
  • Include: Yes or No.
  • Connection address information.

Also, you can configure Advanced Settings like Admin User, Backend Name, Timeouts, and more.

For the import action, you must specify the current HAProxy information, like:

  • Server Address: IP Address for your HAProxy server.
  • Port: HAProxy admin port.
  • Admin User/Admin Password: HAProxy admin credentials.
  • HAProxy Config: HAProxy configuration file location.
  • Stats Socket: HAProxy stats socket.

Most of these values are auto-filled with the default values, so if you’re using a default HAProxy configuration, you shouldn’t change anything.

When you finish the configuration and confirm the deploy or import process, you can follow the progress in the Activity section on the ClusterControl UI.

Monitoring Your HAProxy Node

HAProxy Monitoring with Manage Engine Applications Manager

If you go into the HAProxy node, you’ll see an Availability History section.

In the Performance tab, you’ll have useful information about the HAProxy performance per hour plus a graph showing the Response Time.

If you press on the HAProxy link under the Healthy History section, you’ll access more detailed information about it, with different metrics and graphs.

In the Monitor Information tab, you’ll see the data added during the import process.

Then, you have the Listener, Frontend, Backend, and Server tabs, where you have metrics about each section, like Session Utilization, Transaction Details, Response Times, and even more.

Finally, in the Configuration tab, you’ll see some HAProxy configuration values like max connections and version.

HAProxy Monitoring with ClusterControl

When you have your HAProxy node added into ClusterControl, you can go to ClusterControl -> Select Cluster -> Nodes -> HAProxy node, and check the current status.

You can also check the Topology section, to have a complete overview of the environment.

But if you want to see more detailed information about your HAProxy node, you have the Dashboards section.

Here, you can’t only see all the necessary metrics to monitor the HAProxy node, but also to monitor all the environment using the different Dashboards.

Alarms & Notifications

Manage Engine Applications Manager Notifications

As we mentioned in the previous related blog, this system has its own alarm system where you must configure actions to be run when the alarm is generated.

You can configure alarms and actions, and you can also integrate it with their own Alarm System called AlarmsOne (a different product).

ClusterControl Notifications

It also has an alarm system using advisors. ClusterControl comes with some predefined advisors, but you can modify it or even create a new one using the Developer Studio integrated tool.

It has integration with 3rd party tools like Slack or PagerDuty, so you can receive notifications there too.

Command Line Monitoring

Applications Manager CLI

Unfortunately, this system doesn’t have a command-line tool that allows you to monitor applications or databases from the command line.

ClusterControl CLI (s9s)

For scripting and automating tasks, or even if you just prefer the command line, ClusterControl has the s9s tool. It's a command-line tool for managing your database cluster.

$ s9s node --cluster-id=8 --list --long

STAT VERSION    CID CLUSTER HOST            PORT COMMENT

coC- 1.7.6.3910   8 My1     192.168.100.131 9500 Up and running.

?o-- 2.12.0       8 My1     192.168.100.131 9090 Process 'prometheus' is running.

soM- 8.0.19       8 My1     192.168.100.132 3306 Up and running.

soS- 8.0.19       8 My1     192.168.100.133 3306 Up and running.

ho-- 1.8.15       8 My1     192.168.100.134 9600 Process 'haproxy' is running.

Total: 5

With this tool, you can perform all the tasks that you have in the ClusterControl UI, and even more. You can check the documentation to have more examples and information about the usage of this powerful tool.

Conclusion

As you could see, both systems are useful to monitor an HAProxy node. They have graphs, metrics, and alarms to help you to know the current status of your HAProxy node. The main differences between them are the possibility of ClusterControl to deploy the HAProxy node itself, avoiding manual tasks, and also the ClusterControl CLI feature, that allows you to import/deploy, manage, or monitor everything from the command line.

Apart from that, both solutions are a good way to keep your systems monitored all the time

proxysql-admin Alternatives - ClusterControl ProxySQL GUI

$
0
0

ProxySQL is a very popular proxy in MySQL environments. It comes with a nice set of features including read/write splitting, query caching and query rewriting. ProxySQL stores its configuration in SQLite database, configuration changes can be applied on runtime and are performed through SQL commands. This increases the learning curve and could be a blocker for some people that would like to just install it and get it running. 

This is a reason why a couple of tools exist that can help you to manage ProxySQL. Let’s take a look at one of them, proxysql-admin, and compare it with features available for ProxySQL in ClusterControl.

proxysql-admin

Proxysql-admin is a tool that comes included in the ProxySQL when installed from Percona repositories. It is dedicated to making the setup of Percona XtraDB Cluster in ProxySQL easier. You can define the setup in the configuration file (/etc/proxysql-admin.cnf) or through arguments to the proxysql-admin command. It is possible to:

  1. Configure hostgroups (reader, writer, backup writer, offline) for PXC
  2. Create monitoring user in ProxySQL and PXC
  3. Create application user in ProxySQL and PXC
  4. Configure ProxySQL (maximum running connections, maximum transactions behind)
  5. Synchronize users between PXC and ProxySQL
  6. Synchronize nodes between PXC and ProxySQL
  7. Create predefined (R/W split) query rules for users imported from PXC
  8. Configure SSL for connections from ProxySQL to the backend databases
  9. Define a single writer or round robin access to the PXC

As you can see, this is by no means a complex tool, it focuses on the initial setup. Let’s take a look at couple examples.

root@vagrant:~# proxysql-admin --enable


This script will assist with configuring ProxySQL for use with

Percona XtraDB Cluster (currently only PXC in combination

with ProxySQL is supported)


ProxySQL read/write configuration mode is singlewrite


Configuring the ProxySQL monitoring user.

ProxySQL monitor user name as per command line/config-file is proxysql-monitor


The monitoring user is already present in Percona XtraDB Cluster.


Would you like to enter a new password [y/n] ? n


Monitoring user 'proxysql-monitor'@'10.%' has been setup in the ProxySQL database.


Configuring the Percona XtraDB Cluster application user to connect through ProxySQL

Percona XtraDB Cluster application user name as per command line/config-file is proxysql_user


Application user 'proxysql_user'@'10.%' already present in PXC.


Adding the Percona XtraDB Cluster server nodes to ProxySQL


Write node info

+------------+--------------+------+--------+

| hostname   | hostgroup_id | port | weight |

+------------+--------------+------+--------+

| 10.0.0.152 | 10           | 3306 | 1000   |

+------------+--------------+------+--------+


ProxySQL configuration completed!


ProxySQL has been successfully configured to use with Percona XtraDB Cluster


You can use the following login credentials to connect your application through ProxySQL


mysql --user=proxysql_user -p --host=localhost --port=6033 --protocol=tcp

Above shows the initial setup. As you can see, a singlewriter (default) mode was used, monitoring and application users have been configured and the whole server configuration was prepared.

root@vagrant:~# proxysql-admin --status


mysql_galera_hostgroups row for writer-hostgroup: 10

+--------+--------+---------------+---------+--------+-------------+-----------------------+------------------+

| writer | reader | backup-writer | offline | active | max_writers | writer_is_also_reader | max_trans_behind |

+--------+--------+---------------+---------+--------+-------------+-----------------------+------------------+

| 10     | 11     | 12            | 13      | 1      | 1           | 2                     | 100              |

+--------+--------+---------------+---------+--------+-------------+-----------------------+------------------+


mysql_servers rows for this configuration

+---------------+-------+------------+------+--------+--------+----------+---------+-----------+

| hostgroup     | hg_id | hostname   | port | status | weight | max_conn | use_ssl | gtid_port |

+---------------+-------+------------+------+--------+--------+----------+---------+-----------+

| writer        | 10    | 10.0.0.153 | 3306 | ONLINE | 1000   | 1000     | 0       | 0         |

| reader        | 11    | 10.0.0.151 | 3306 | ONLINE | 1000   | 1000     | 0       | 0         |

| reader        | 11    | 10.0.0.152 | 3306 | ONLINE | 1000   | 1000     | 0       | 0         |

| backup-writer | 12    | 10.0.0.151 | 3306 | ONLINE | 1000   | 1000     | 0       | 0         |

| backup-writer | 12    | 10.0.0.152 | 3306 | ONLINE | 1000   | 1000     | 0       | 0         |

+---------------+-------+------------+------+--------+--------+----------+---------+-----------+

Here is the output of the default configuration of the PXC nodes in ProxySQL.

ClusterControl

ClusterControl is, in comparison to the proxysql-admin, a way more complex solution. It can deploy a ProxySQL load balancer and preconfigure it according to the user requirements.

When deploying you can define administrator user and password, monitoring user and you can as well import one of the existing MySQL users (or create a new one if this is what you need) for the application to use. It is also possible to import ProxySQL configuration from other ProxySQL that you already have in the cluster. It makes the deployment faster and more efficient.

What is also important to mention is that ClusterControl can deploy ProxySQL in both MySQL and Galera Clusters. It can be used with MySQL, Percona and MariaDB flavours of MySQL.

Once deployed, ClusterControl gives you options to fully manage ProxySQL via an easy to use GUI.

You can monitor your ProxySQL instance.

You can check the heavier queries executed through ProxySQL. It is also possible to create a query rule based on the exact query.

ClusterControl configures ProxySQL for a read/write split. It is also possible to add custom query rules based on your requirements and application configuration. 

Compared to proxysql-admin, ClusterControl gives you full control over the server configuration. You can add new servers, you can move them around host groups as you want. You can create new hostgroups (and then, for example, create new query rules for them).

It is also possible to manage users in ProxySQL. You can edit existing users, import new users that exist in the backend database.

Bulk import is also possible to accomplish. You can also create new users on both ProxySQL and backend databases.

ClusterControl can also be used to reconfigure ProxySQL. You can modify all of the variables through a simple UI with search option.

As you can see, ClusterControl comes with in-depth management features for ProxySQL. It allows you to deploy and manage ProxySQL instances with ease.

Press Release: Backup Ninja Provides the Simplest and Most Cost-Effective Solution Against Ransomware

$
0
0

The low-cost, cloud-based solution to backing up open source databases enables startups, small businesses and individual professionals to enjoy enterprise-level peace of mind.

PRESS RELEASE  UPDATED: MAY 20, 2020 10:00 EDT

STOCKHOLM, May 20, 2020 (Newswire.com) - Among the countless number of malware threats affecting businesses, ransomware is the biggest offender, costing organizations over $7.5 billion in 2019 alone. Cyber-attacks affect more than just large companies, and Backup Ninja, a product of Severalnines, is the most simple, secure and cost-effective solution for small businesses to combat these threats. The software enables users to backup the world’s most popular open source databases locally or in the cloud, providing a safe and secure backup to minimize the impact caused by ransomware.

Ransomware attacks are costly, and small businesses suffer disproportionately due to less resources or a lack of sophisticated security tools and management. As the prevalence of ransomware increases, so too have the ransom demands; in 2019, ransom dollar amounts increased 37%. The downtime, often caused by a company’s unwillingness or inability to pay, can cost up to 23 times more than the ransom amount itself, and in 2019 those costs have soared over 200%.

”Small businesses are attractive targets because they have information that cybercriminals want, and they typically lack the security infrastructure of larger businesses,” said the U.S. Small Business Association (sba.gov) “According to a recent SBA survey, 88% of small business owners felt their business was vulnerable to a cyberattack. Yet many businesses can’t afford professional IT solutions; they have limited time to devote to cybersecurity, or they don’t know where to begin”

For cybercriminals, there’s no more cost-effective option to hold a business hostage. It’s highly transmissible, as many clients often unknowingly spread the malware onto other devices, and many of the vulnerabilities that are preyed upon are of the company’s own doing. Weak passwords, poor access management, a lack of security training, and aggressive phishing email campaigns are all avenues of opportunity that cybercriminals regularly exploit for monetary gain.

Backup Ninja aims to provide an equally cost-cost effective but far more simple and sophisticated solution to combat ransomware through its safe and secure backup software. Whether stored locally or in the cloud, database integrity is always preserved to ensure a seamless restoration of data. If the threat of troublesome malware should arise, businesses won’t have to pay any ransoms, and downtime is kept to an absolute minimum.

Backup Ninja uses advanced TLS encryption for operations and encrypts stored databases using AES-256 encryption,” said Vinay Joosery, CEO of Severalnines. “Backup Ninja is simple enough for the smallest website database and feature-rich enough to support enterprise-grade requirements. Any application can take advantage of our service, as long as we offer support for the database you are using in your application.”

Businesses can protect themselves, maintain productivity, as well as profitability, with Backup Ninja, and never have to pay to retrieve their own data again.

For more information, visit Backup Ninja.

About Severalnines

Severalnines provides automation and management software for open source database clusters. We help companies deploy their databases in any environment and manage all the operational aspects to achieve high-scale availability. Severalnines' products are used by System Administrators, Developers, and DBAs of all skill levels to provide a fully complete database lifecycle; freeing them from the complexity and learning curves that are typically associated with highly-available database setups. 

The company has enabled tens of thousands of deployments to date via its popular product ClusterControl for customers like ABSA Bank, BT, Cisco, HP, IBM Research, NHS, Orange, Ping Identity, Technicolor, and VodafoneZiggo. Severalnines is a private company headquartered in Stockholm, Sweden with employees operating remotely around the world. To see who is using Severalnine’s products, visit, https://severalnines.com/about-us/customers ​

Contact:

Forrest Lymburner
forrest@severalnines.com
+1 347-809-3407

pg_restore Alternatives - PostgreSQL Backup and Automatic Recovery with ClusterControl

$
0
0

While there are various ways to recover your PostgreSQL database, one of the most convenient approaches to restore your data from a logical backup. Logical backups play a significant role for Disaster and Recovery Planning (DRP). Logical backups are backups taken, for example using pg_dump or pg_dumpall, which generate SQL statements to obtain all table data that is written to a binary file. 

It is also recommended to run periodic logical backups in case your physical backups fail or are unavailable. For PostgreSQL, restoring can be problematic if you are unsure of what tools to use. The backup tool pg_dump is commonly paired with the restoration tool pg_restore

pg_dump and pg_restore act in tandem if disaster occurs and you need to recover your data. While they serve the primary purpose of dump and restore, it does require you to perform some extra tasks when you need to recover your cluster and do a failover (if your active primary or master dies due to hardware failure or VM system corruption). You'll end up to find and utilize third party tools which can handle failover or automatic cluster recovery.

In this blog, we'll take a look at how pg_restore works and compare it to how ClusterControl handles backup and restore of your data in case disaster happens.

Mechanisms of pg_restore

pg_restore is useful when obtaining the following tasks:

  • paired with pg_dump for generating SQL generated files containing data, access roles, database and table definitions
  • restore a PostgreSQL database from an archive created by pg_dump in one of the non-plain-text formats. 
  • It will issue the commands necessary to reconstruct the database to the state it was in at the time it was saved. 
  • has the capability to be selective or even to reorder the items prior to being restored based on the archive file 
  • The archive files are designed to be portable across architectures.
  • pg_restore can operate in two modes. 
    • If a database name is specified, pg_restore connects to that database and restores archive contents directly into the database. 
    • or, a script containing the SQL commands necessary to rebuild the database is created and written to a file or standard output. Its script output has equivalence to the format generated by pg_dump
  • Some of the options controlling the output are therefore analogous to pg_dump options.

Once you have restored the data, it's best and advisable to run ANALYZE on each restored table so the optimizer has useful statistics. Although it acquires READ LOCK, you might have to run this during a low traffic or during your maintenance period.

Advantages of pg_restore

pg_dump and pg_restore in tandem has capabilities which are convenient for a DBA to utilize.

  • pg_dump and pg_restore has the capability to run in parallel by specifying the -j option. Using the -j/--jobs <number-of-jobs> allows you to specify how many running jobs in parallel can run especially for loading data, creating indexes, or create constraints using multiple concurrent jobs. 
  • It's quiet handy to use, you can selectively dump or load specific database or tables
  • It allows and provides a user flexibility on what particular database, schema, or reorder the procedures to be executed based on the list. You can even generate and load the sequence of SQL loosely like prevent acls or privilege in accordance to your needs. There are plenty of options to suit your needs.
  • It provides you capability to generate SQL files just like pg_dump from an archive. This is very convenient if you want to load to another database or host to provision a separate environment.
  • It's easy to understand based on the generated sequence of SQL procedures.
  • It’s a convenient way to load data in a replication environment. You don't need your replica to be restaged since the statements are SQL which were replicated down to the standby and recovery nodes.

Limitations of pg_restore

For logical backups, the obvious limitations of pg_restore along with pg_dump is the performance and speed when utilizing the tools. It might be handy when you want to provision a test or development database environment and load your data, but it's not applicable when your data set is huge. PostgreSQL has to dump your data one by one or execute and apply your data sequentially by the database engine. Although you can make this loosely flexible to speed up like specifying -j or using --single-transaction to avoid impact to your database, loading using SQL still has to be parsed by the engine.

Additionally, the PostgreSQL documentation states the following limitations, with our additions as we observed these tools (pg_dump and pg_restore):

  • When restoring data to a pre-existing table and the option --disable-triggers is used, pg_restore emits commands to disable triggers on user tables before inserting the data, then emits commands to re-enable them after the data has been inserted. If the restore is stopped in the middle, the system catalogs might be left in the wrong state.
  • pg_restore cannot restore large objects selectively; for instance, only those for a specific table. If an archive contains large objects, then all large objects will be restored, or none of them if they are excluded via -L, -t, or other options.
  • Both tools are expected to generate a huge amount of size (files, directory, or tar archive) especially for a huge database.
  • For pg_dump, when dumping a single table or as plain text, pg_dump does not handle large objects. Large objects must be dumped with the entire database using one of the non-text archive formats.
  • If you have tar archives generated by these tools, take note that tar archives are limited to a size less than 8 GB. This is an inherent limitation of the tar file format. Therefore this format cannot be used if the textual representation of a table exceeds that size. The total size of a tar archive and any of the other output formats is not limited, except possibly by the operating system.

Using pg_restore

Using pg_restore is quite handy and easy to utilize. Since it is paired in tandem with pg_dump, both these tools work sufficiently well as long as the target output suits the other. For example, the following pg_dump won't be useful for pg_restore,

[root@testnode14 ~]# pg_dump --format=p --create  -U dbapgadmin -W -d paultest -f plain.sql

Password: 

This result will be a psql compatible which looks like as follows:

[root@testnode14 ~]# less plain.sql 

--

-- PostgreSQL database dump

--


-- Dumped from database version 12.2

-- Dumped by pg_dump version 12.2


SET statement_timeout = 0;

SET lock_timeout = 0;

SET idle_in_transaction_session_timeout = 0;

SET client_encoding = 'UTF8';

SET standard_conforming_strings = on;

SELECT pg_catalog.set_config('search_path', '', false);

SET check_function_bodies = false;

SET xmloption = content;

SET client_min_messages = warning;

SET row_security = off;


--

-- Name: paultest; Type: DATABASE; Schema: -; Owner: postgres

--


CREATE DATABASE paultest WITH TEMPLATE = template0 ENCODING = 'UTF8' LC_COLLATE = 'en_US.UTF-8' LC_CTYPE = 'en_US.UTF-8';


ALTER DATABASE paultest OWNER TO postgres;

But this will fail for pg_restore as there's no plain format to follow:

[root@testnode14 ~]# pg_restore -U dbapgadmin --format=p -C -W -d postgres plain.sql 

pg_restore: error: unrecognized archive format "p"; please specify "c", "d", or "t"

[root@testnode14 ~]# pg_restore -U dbapgadmin --format=c -C -W -d postgres plain.sql 

pg_restore: error: did not find magic string in file header

Now, let's go to more useful terms for pg_restore.

pg_restore: Drop and Restore

Consider a simple usage of pg_restore which you have drop a database, e.g.

postgres=# drop database maxtest;

DROP DATABASE

postgres=# \l+

                                                                    List of databases

   Name    |  Owner   | Encoding |   Collate   |    Ctype    |   Access privileges   |  Size   | Tablespace |                Description                 

-----------+----------+----------+-------------+-------------+-----------------------+---------+------------+--------------------------------------------

 paultest  | postgres | UTF8     | en_US.UTF-8 | en_US.UTF-8 |                       | 83 MB   | pg_default | 

 postgres  | postgres | UTF8     | en_US.UTF-8 | en_US.UTF-8 |                       | 8209 kB | pg_default | default administrative connection database

 template0 | postgres | UTF8     | en_US.UTF-8 | en_US.UTF-8 | =c/postgres          +| 8049 kB | pg_default | unmodifiable empty database

           |          |          |             |             | postgres=CTc/postgres |         |            | 

 template1 | postgres | UTF8     | en_US.UTF-8 | en_US.UTF-8 | postgres=CTc/postgres+| 8193 kB | pg_default | default template for new databases

           |          |          |             |             | =c/postgres           |         |            | 

(4 rows)

Restoring it with pg_restore it very simple,

[root@testnode14 ~]# sudo -iu postgres pg_restore  -C  -d postgres /opt/pg-files/dump/f.dump 

The -C/--create here states that create the database once it's encountered in the header. The -d postgres points to the postgres database but it doesn't mean it will create the tables to postgres database. It requires that the database has to exist. If -C is not specified, table(s) and records will be stored to that database referenced with -d argument.

Restoring Selectively By Table

Restoring a table with pg_restore is easy and simple. For example, you have two tables namely "b" and "d" tables. Let's say you run the following pg_dump command below,

[root@testnode14 ~]# pg_dump --format=d --create  -U dbapgadmin -W -d paultest -f pgdump_inserts

Password:

Where the contents of this directory will look like as follows,

[root@testnode14 ~]# ls -alth pgdump_inserts/

total 16M

-rw-r--r--. 1 root root  14M May 15 20:27 3696.dat.gz

drwx------. 2 root root   59 May 15 20:27 .

-rw-r--r--. 1 root root 2.5M May 15 20:27 3694.dat.gz

-rw-r--r--. 1 root root 4.0K May 15 20:27 toc.dat

dr-xr-x---. 5 root root  275 May 15 20:27 ..

If you want to restore a table (namely "d" in this example),

[root@testnode14 ~]# pg_restore -U postgres -Fd  -d paultest -t d pgdump_inserts/

Shall have,

paultest=# \dt+

                   List of relations

 Schema | Name | Type  |  Owner   | Size  | Description

--------+------+-------+----------+-------+-------------

 public | d    | table | postgres | 51 MB |

(1 row)

pg_restore: Copying Database Tables to a Different Database

You may even copy the contents of your existing database and have it on your target database. For example, I have the following databases,

paultest=# \l+ (paultest|maxtest)

                                                  List of databases

   Name   |  Owner   | Encoding |   Collate   |    Ctype    | Access privileges |  Size   | Tablespace | Description 

----------+----------+----------+-------------+-------------+-------------------+---------+------------+-------------

 maxtest  | postgres | UTF8     | en_US.UTF-8 | en_US.UTF-8 |                   | 84 MB   | pg_default | 

 paultest | postgres | UTF8     | en_US.UTF-8 | en_US.UTF-8 |                   | 8273 kB | pg_default | 

(2 rows)

The paultest database is an empty database while we're going to copy what's inside maxtest database,

maxtest=# \dt+

                   List of relations

 Schema | Name | Type  |  Owner   | Size  | Description

--------+------+-------+----------+-------+-------------

 public | d    | table | postgres | 51 MB |

(1 row)


maxtest=# \dt+

                   List of relations

 Schema | Name | Type  |  Owner   | Size  | Description 

--------+------+-------+----------+-------+-------------

 public | b    | table | postgres | 69 MB | 

 public | d    | table | postgres | 51 MB | 

(2 rows)

To copy it, we need to dump the data from maxtest database as follows,

[root@testnode14 ~]# pg_dump --format=t --create  -U dbapgadmin -W -d maxtest -f pgdump_data.tar

Password: 

Then load or restore it as follows,

Now, we got data on paultest database and the tables have been stored accordingly.

postgres=# \l+ (paultest|maxtest)

                                                 List of databases

   Name   |  Owner   | Encoding |   Collate   |    Ctype    | Access privileges |  Size  | Tablespace | Description 

----------+----------+----------+-------------+-------------+-------------------+--------+------------+-------------

 maxtest  | postgres | UTF8     | en_US.UTF-8 | en_US.UTF-8 |                   | 153 MB | pg_default | 

 paultest | postgres | UTF8     | en_US.UTF-8 | en_US.UTF-8 |                   | 154 MB | pg_default | 

(2 rows)

paultest=# \dt+

                   List of relations

 Schema | Name | Type  |  Owner   | Size  | Description 

--------+------+-------+----------+-------+-------------

 public | b    | table | postgres | 69 MB | 

 public | d    | table | postgres | 51 MB | 

(2 rows)

Generate a SQL file With Re-ordering

I have seen a lot of usage with pg_restore but it seems that this feature is not usually showcased. I found this approach very interesting as it allows you to order based on what you don't want to include and then generate an SQL file from the order you want to proceed.

For example, we'll use the sample pgdump_data.tar we have generated earlier and create a list. To do this, run the following command:

[root@testnode14 ~]# pg_restore  -l pgdump_data.tar  > my.list

This will generate a file as shown below:

[root@testnode14 ~]# cat my.list 

;

; Archive created at 2020-05-15 20:48:24 UTC

;     dbname: maxtest

;     TOC Entries: 13

;     Compression: 0

;     Dump Version: 1.14-0

;     Format: TAR

;     Integer: 4 bytes

;     Offset: 8 bytes

;     Dumped from database version: 12.2

;     Dumped by pg_dump version: 12.2

;

;

; Selected TOC Entries:

;

204; 1259 24811 TABLE public b postgres

202; 1259 24757 TABLE public d postgres

203; 1259 24760 SEQUENCE public d_id_seq postgres

3698; 0 0 SEQUENCE OWNED BY public d_id_seq postgres

3560; 2604 24762 DEFAULT public d id postgres

3691; 0 24811 TABLE DATA public b postgres

3689; 0 24757 TABLE DATA public d postgres

3699; 0 0 SEQUENCE SET public d_id_seq postgres

3562; 2606 24764 CONSTRAINT public d d_pkey postgres

Now, let's re-order it or shall we say I have removed the creation of SEQUENCE and also the creation of the constraint. This would look like as follows,

TL;DR

...

;203; 1259 24760 SEQUENCE public d_id_seq postgres

;3698; 0 0 SEQUENCE OWNED BY public d_id_seq postgres

TL;DR

….

;3562; 2606 24764 CONSTRAINT public d d_pkey postgres

To generate the file in SQL format, just do the following:

[root@testnode14 ~]# pg_restore -L my.list --file /tmp/selective_data.out pgdump_data.tar 

Now, the file /tmp/selective_data.out will be a SQL generated file and this is readable if you use psql, but not pg_restore. What's great about this is you can generate an SQL file in accordance to your template on which data only can be restored from an existing archive or backup taken using pg_dump with the help of pg_restore.

PostgreSQL Restore with ClusterControl 

ClusterControl does not utilize pg_restore or pg_dump as part of it’s featureset. We use pg_dumpall to generate logical backups and, unfortunately, the output is not compatible with pg_restore. 

There are several other ways to generate a backup in PostgreSQL as seen below.

There's no such mechanism where you can selectively store a table, a database, or copy from one database to another database.

ClusterControl does support Point-in-Time Recovery (PITR), but this doesn't allow you to manage data restore as flexible as with pg_restore. For all the list of backup methods, only pg_basebackup and pgbackrest are PITR capable.

How ClusterControl handles restore is that it has the capability to recover a failed cluster as long as Auto Recovery is enabled as shown below.

Once the master fails, the slave can automatically recover the cluster as ClusterControl performs the failover (which is done automatically). For the data recovery part, your only option is to have a cluster-wide recovery which means it's coming from a full backup. There's no capability to selectively restore on the target database or table you only wanted to restore. If you want to do that, restore the full backup, it's easy to do this with ClusterControl. You can go to the Backup tabs just as shown below,

You'll have a full list of successful and failed backups. Then restoring it can be done by choosing the target backup and clicking the "Restore" button. This will allow you to restore on an existing node registered within ClusterControl, or verify on a stand alone node, or create a cluster from the backup.

Conclusion

Using pg_dump and pg_restore simplifies the backup/dump and restore approach. However, for a large-scale database environment, this might not be an ideal component for disaster recovery. For a minimal selection and restoring procedure, using the combination of pg_dump and pg_restore provides you the power to dump and load your data according to your needs. 

For production environments (especially for enterprise architectures) you might use the ClusterControl approach to create a backup and restore with automatic recovery. 

A combination of approaches is also a good approach. This helps you lower your RTO and RPO and at the same time leverage on the most flexible way to restore your data when needed.

pgAdmin Alternatives - PostgreSQL Database Management GUI ClusterControl

$
0
0

There are many tools used in Database Administration that help simplify the management of open source databases. The advantage of using these types of applications is the availability menus from various objects in the database (such as tables, indexes, sequences, procedures, views, triggers) so that you do not have to use the command line when using a native database client. You just simply browse the menu, and it will immediately appear on the screen.

In this blog, we will review one of the third party Database Management applications for PostgreSQL called pgAdmin. It is an open source database management tool that is useful for database administration, ranging from creating tables, indexes, views, triggers, stored procedures. Besides that, pgAdmin can also monitor the database for  information related to Sessions, Transactions per Seconds, and Locking.

pgAdmin Monitoring

There are some metrics in pgAdmin that can be valuable insight to understand the current state of the database. Here’s the display metrics on pgAdmin.

In the Dashboard, you can monitor information related to incoming connections to the database through Server Sessions. Information related to commit transactions, rollbacks and total transactions per second in the database can be seen in the Transactions per Seconds screen. Tuples in contains information related to total tuples insert, update, delete in the database. Tuples out contain tuples information that is returned to the client from the database. Tuples itself is a term in PostgreSQL for rows. Metrics Block I / O contains information related to Disk information, both total read and fetched blocks from the database cache.

Server activity contains information related to running sessions, locking that occurs in the database, prepared statements from queries, and database configuration. As shown in the picture below.

In Properties, you can see information related to the PostgreSQL database that is being accessed, such as the database name, server type, database version, ip address, and the username used.

The SQL contains information related to the generated SQL script created from a selected object as follows:

The information in the highlighted object is displayed in great detail, as it contains a script to reconstruct an object.

In the Statistics tab, the information related to statistics collected from each object running in the database are displayed on the menu.

As an example, the above table contains information regarding Tuples (inserted, updated, deleted, live, dead). There is also information related to vacuum and auto-analyze. 

Vacuum runs to clean dead tuples in the database and reclaim disk storage used by dead tuples. While auto-analyze functions to generate statistics on objects so the optimizer can precisely determine the execution plan of a query.

ClusterControl PostgreSQL Monitoring

ClusterControl has various metrics related to the PostgreSQL database which can be found on the Overview, Nodes, Dashboard, Query Monitor, and Performance tabs. The following metrics display in ClusterControl.

The Overview section contains information related to server load metrics ranging from connection, number of insert, delete, update, commit & rollback and connection. In addition, there is information such as health nodes, the replication status of the PostgreSQL database, and also information related to server utilization as shown in the figure below.

The Nodes tab provides graph-related information on the server side starting from CPU Utilization, Memory, Disk Usage, Network, and Swap Usage.

The Dashboard has several metrics options such as System Overview, Cluster Overview, and PostgreSQL Overview. For each option there are various metrics that are related to the running system condition. For example, in the PostgreSQL Overview metrics, there is information ranging from Load averages from the database, Memory Available, and Network transmission and receiving as shown below.

The Query Monitor contains information related to running queries that run on the database. We can find out what queries are running, how long is the execution time, source client address information, and the state of the session. Besides that, there is a Kill session feature, where we can terminate the session that causes the database to experience delays. The following is the display from Query Monitor:  

In addition to running queries, we can also view Query Statistics information, starting from Access by Sequential or index scan, Table I / O Statistics, Index I / O Statistics, Database Size, Top 10 Largest Tables.

The Performance tab contains information related to database variables and the value currently running, besides that there is an Advisor to provide input related to the follow-up of the warning that occurred.

The growth of databases and tables can also be monitored on the DB Growth menu, you can predict storage needs or other actions that will be performed by analyzing the metrics of the growth of these databases and tables.

PostgreSQL Administration Tasks with pgAdmin

pgAdmin has various features for database administration and objects that are in the database ranging from creating tables, indexes, users, and tablespaces. The various features of pgAdmin are very useful for both Developer and DBA, because they make it very easy to manage database objects. Following is the appearance of the Menu Tree in pgAdmin.

You can just do right click on the object to be highlighted, then there will be actions that can be done from that object. For example, highlighting Database, then you can create a new database like this:

There will be a dialog box to fill in the database name information, the owner of the database to be created, the encoding that will be used, the tablespace that will be used by the database, security access to the database.

What users have the right to access, and what privileges will be given.

PostgreSQL Administration Tasks with ClusterControl

ClusterControl can also create users and privileges that will be given to User Management as shown in the following figure.

With ClusterControl you can deploy highly available PostgreSQL databases. You can also change the configuration related to the database parameters and the ACL ip address that has the right to access the database in the Configuration menu.


Dealing with Slow Queries in MongoDB

$
0
0

When in production, an application should provide a timely response to the user for the purpose of improving user interaction with your application. At times, however, database queries may start to lag hence taking a longer latency for a response to reach the user or rather the throughput operation terminated due to surpassing the set average timeout. 

In this blog we are going to learn how you can identify these problems in MongoDB, ways to fix them whenever they arise and what are the possible strategies to undertake so that this may not happen again.

More often, what leads to slow query responses is  degraded CPU capacity that is unable to withstand the underlying working set. Working set in this case is the amount of data and indexes that will be subjected to a throughput instance hence active at that moment. This is especially considered in capacity planning when one expects the amount of data involved to increase over time and the number of users engaging with your platform.

Identifying a Slow Query Problem

There are two ways you can identify slow queries in MongoDB.

  1. Using the Profiler
  2. Using db.currentOp() helper

Using the MongoDB Profiler

Database profiler in MongoDB is a mechanism for collecting detailed information about Database Commands executed against a running mongod instance that is: throughput operations (Create, Read, Update and Delete) and the configuration & administration commands.

The profiler utilizes a capped collection named system.profile where it writes all the data. This means, when the collection is full in terms of size, the older documents are deleted to give room for new data.

The Profiler is off by default but depending on the profiling level one can enable it on a per-database or per instance. The possible profiling levels are:

  • 0 - the profiler is off hence does not collect any data.
  • 1 - the profiler collects data for operations that take longer than the value of slowms
  • 2- the  profiler collects data for all operations.

 However, enabling profiling generates a performance impact on the database and disk usage especially when the profiling level is set to 2 . One should consider any performance implications before enabling and configuring the profiler on a production deployment.

To set the profiling, we use the db.setProfilingLevel() helper such as:

db.setProfilingLevel(2)

A sample document that will be stored in the system.profile collection will be:

{ "was" : 0, "slowms" : 100, "sampleRate" : 1.0, "ok" : 1 }

The “ok”:1 key-value pair indicates that the operation succeeded whereas slowms is the threshold time in milliseconds an operation should take and by default is 100ms.

To change this value

db.setProfilingLevel(1, { slowms: 50 })

To query for data against the system.profile collection run:

db.system.profile.find().pretty()

Using db.currentOp()helper

This function lists the current running queries with very detailed information such as how long they have been running. On a running mongo shell, you run the comment for example:

db.currentOp({“secs_running”: {$gte: 5}}) 

Where secs_running is the filtering strategy so that only operations that have taken more than 5 seconds to perform will be returned, reducing the output. This is often used when the CPU’s health can be rated 100% due to adverse performance impact it may implicate  on the database. So by changing the values you will learn which queries are taking long to execute.

The returned documents have the following as the keys of interest:

  • query: what the query entails
  • active:  if the query is still in progress.
  • ns: collection name against which the query is to be executed
  • secs_running:  duration the query has taken so far in seconds

By highlighting which queries are taking long, you have identified what is overloading the CPU.

Interpreting Results and Fixing the Issues

 As we have described above, query latency is very dependent on the amount of data involved which will otherwise lead to inefficient execution plans. This is to say, for example if you don’t use indexes in your collection and want to update certain records, the operation has to go through all the documents rather than filtering for only those that match the query specification. Logically, this will take longer time hence leading to a slow query. You can examine an inefficient execution plan by running:  explain(‘executionStats’) which provides statistics about the performance of the query. From this point you can learn how the query is utilizing the index besides providing a clue if the index is optimal. 

If the explain helper returns

{

   "queryPlanner" : {

         "plannerVersion" : 1,

         ...

         "winningPlan" : {

            "stage" : "COLLSCAN",

            ...

         }

   },

   "executionStats" : {

      "executionSuccess" : true,

      "nReturned" : 3,

      "executionTimeMillis" : 0,

      "totalKeysExamined" : 0,

      "totalDocsExamined" : 10,

      "executionStages" : {

         "stage" : "COLLSCAN",

         ...

      },

      ...

   },

   ...

}

queryPlanner.winningPlan.stage: COLLSCAN key value indicates that the mongod had to scan the entire collection document to identify the results hence it becomes an expensive operation hence leading to slow queries.

executionStats.totalKeysExamined:0means the collection is not utilizing indexing strategy

For a given query, the number of documents involved should be close to zero. If the number of documents is quite large there are two possibilities:

  1. Not using indexing with the collection
  2. Using an index which is not optimal.

To create an index for a collection run the command: 

db.collection.createIndex( { quantity: 1 } )

Where quantity is an example field you have selected to be optimal for the indexing strategy.

If you want to learn more about indexing and which indexing strategy to use, check on this blog

Conclusion

Database performance degradation can be easily portrayed by having slow queries which is the least expectation we would want platform users to encounter. One can identify slow queries in MongoDB by enabling the profiler and configuring it to its some specifications or executing db.currentOp() on a running mongod instance. 

By looking at the time parameters on the returned result, we can identify which queries are lagging. After identifying these queries, we use the explain helper on these queries to get more details for example if the query is using any index. 

Without indexing, the operations become expensive since a lot of documents need to be scanned through before applying the changes. With this setback, the CPU will be overworked hence resulting in slow querying and rising CPU spikes. 

The major mistake that leads to slow queries is inefficient execution planning which can be easily resolved by using an index with the involved collection.


pgDash Diagnostics Alternatives - PostgreSQL Query Management with ClusterControl

$
0
0

Databases are all about queries. You store your data in them and then you have to be able to retrieve it in some way. Here come queries - you write them in some language, structured or not, in that way you define what data you want to retrieve. Ideally, those queries would be fast, after all we don’t want to wait for our data. There are many tools that let you understand how your queries behave and how they perform. In this blog post we will compare pgDash and ClusterControl. In both cases query performance is just a part of the functionality. Without further due let’s take a look at them.

What is pgDash?

pgDash is a tool dedicated to monitoring PostgreSQL and monitoring of the query performance is one of the available functionalities.

pgDash requires pg_stat_statements to get the data. It is possible to show queries on a per database basis. You can define which columns should be visible (by default some of them are not shown, to make the data easier to read). You can see multiple types of data like execution time (average, max, min, total) but also information about temporary blocks, rows accessed, disk access and buffer hit. This creates a nice insight into how a given query performs and what could be the reason why it does not perform in an efficient way. You can sort the data using any column looking for queries that, for example, are the slowest ones or which write the most temporary blocks.

If needed, you can look up queries executed in a defined time window.

The granularity here is one minute.

For every query on the list you can click and see more detailed statistics.

You can see the exact query, some data on it (disk access, shared buffer access, temporary blocks access). It is also possible to enable testing and storing the execution plan for the queries. Finally you can see the graphs showing how the performance of the query changed in time.

Overally, pgDash presents a nice insight into the query performance metrics in PostgreSQL.

ClusterControl PostgreSQL Query Monitoring & Management

ClusterControl comes with Query Monitor which is intended to give users insight into the performance of their queries. Query Monitor can be used for PostgreSQL but also for MySQL and Galera Cluster.

ClusterControl PostgreSQL Query Management

ClusterControl shows data aggregated across all databases and hosts in the cluster. The list of queries contains information about performance-related metrics. Number of occurrences, examined rows, temporary tables, maximum, average and total execution time. The list can be sorted using some of the columns (occurrences, max, average, standard deviation and total execution time).

PostgreSQL Query Management ClusterControl

Each query can be clicked on, it shows full query text, some additional details and the general optimization hints.

ClusterControl also comes with the Query Outliers module.

PostgreSQL Query Outliers - ClusterControl

If there are any queries that deviate from the average performance of that particular query type, they will be shown in this section, allowing the user to better understand which queries behave inconsistently and try to find the root cause for this.

PostgreSQL Table and Index Metrics

On top of data directly related to the query performance, both tools provide information about other internals that may affect query performance. 

pgDash has a “Tools” section in which you can collect information about indexes, table size and bloat:

Similar data is available In ClusterControl, in Query Statistics:

It is possible to check the I/O statistics for table and indexes, table and index bloat, unused or duplicated indexes. You can also check which tables are more likely to be accessed using index or sequential scans. You can as well check the size of the largest tables and databases.

Conclusion

We hope this short blog gives you insight into how ClusterControl compares with pgDash in features related to query performance. Please keep in mind that ClusterControl is intended not only to assist you with performance monitoring but also to build and deploy HA stacks for multiple Open Source databases, perform the configuration management, define and execute backup schedules and many more features. If you are interested in ClusterControl, you can download it for free.

MySQL Workbench Alternatives - ClusterControl’s Point-and-Click GUI

$
0
0

Many would agree that having a graphical user interface is more efficient and less prone to human error when managing or administering a system. Graphical user interface (GUI) greatly helps reduce the steep learning curve required to get up to speed, especially if the software or system is new and complex to the end-user. For MySQL, the installer or packages only comes with a command line interface (CLI) out-of-the-box. However, there is a handful of softwares available in the market that provides a GUI including the one created by the MySQL team themselves called MySQL Workbench.

In this blog post, we are going to look into the graphical user interface aspects of MySQL Workbench and ClusterControl. Both tools have their own advantages and strengths, where some feature sets are overlapping since both tools support management, monitoring, and administration features to certain degrees.

MySQL Workbench GUI

MySQL Workbench is one of the most popular and free Graphical User Interface (GUI) tools to manage and administer a MySQL server. It is a unified visual tool built for database architects, developers, and DBAs. MySQL Workbench provides SQL development tools and data modeling, with comprehensive administration tools for server configuration, user administration, backup, and much more. It's written in C++ and supports Windows, MacOS, Linux (Ubuntu, RHEL, Fedora) and also source code where you compile it by yourself.

MySQL Workbench assumes you have an already running MySQL server, and the user uses it as the graphical user interface to manage your MySQL server. You can perform most of the database management and administration tasks with Workbench like service control, configuration/user/session/connection/data management, as well as SQL development and data modelling. The management features have been covered in the previous blog posts of this series, Database User Management and Configuration Management.

In terms of monitoring, the Performance Dashboard provides quick views of MySQL performance on key server, network, and InnoDB metrics:

You can mouse over the various graphs and visuals to get more information about the sampled values, refreshed every 3 seconds. Note that Workbench does not store the sampling data anywhere thus the graphs are populated from the monitoring collected at the current time you access the dashboard until it is closed.

One of the MySQL Workbench strengths is its data modeling and design feature. It enables you to create models of your database schema graphically, reverse and forward engineer between a schema and a live database, and edit all aspects of your database using the comprehensive editor. The following screenshot shows the entity-relationship (ER) diagram built and visualized with Workbench of Sakila sample database:

Another notable feature is database migration wizard, which allows you to migrate tables and data from a supported database system like Microsoft SQL Server, Microsoft Access, PostgreSQL, Sybase ASE, Sybase SQL Anywhere and SQLite to MySQL:

This tool can save DBA and developer time with its visual, point and click ease of use around all phases of configuring and managing a complex migration process. This migration wizard can also be used to copy databases from one MySQL server to another and also to upgrade to the latest version of MySQL using logical upgrade.

ClusterControl GUI

ClusterControl comes with two user interfaces - GUI and CLI. The graphical user interface, also known as ClusterControl UI is built on top of LAMP stack technologies. Thus, it requires extra steps to prepare, install and configure all the dependencies for a MySQL database server, Apache web server and PHP. To make sure all dependencies are met and configured correctly, it's recommended to install ClusterControl on a clean fresh host using the installer script available on the website. 

Once installed, open your preferred web browser and go to http://ClusterControl_server_IP_address/clustercontrol and start creating the admin user and password. The next step is to either deploy a new database cluster or import an existing database cluster into it.

ClusterControl groups database servers per cluster, even for standalone database nodes. It focuses more on the low-level system administration responsibility on automation, management, monitoring and scaling of your database servers and clusters. One of the cool GUI features is cluster topology visualization, which gives us a high-level look on how the current database architecture looks like, including the load-balancer tier:

The Topology view provides a real-time summary of the cluster/node state, replication data flow and the relationship among members in the cluster. You might know for MySQL replication, the database role and replication flow is very critical, especially after a topology changes event like master failure, slave promotion or switchover happened. 

ClusterControl provides many step-by-step wizards to help users to deploy, manage and configure their database servers. Most of the difficult and complex tasks are configurable via this wizard like deploying a cluster, importing a cluster, adding a new database node, deploying a load balancer, scheduling a backup, restoring a backup and performing backup verification. For example, if you would like to schedule a backup, there are different steps involved depending on the chosen backup method, the chosen backup destination and many other variables. The UI will dynamically get updated according to the chosen options, as highlighted by the following schedule backup screenshot:

In the above screenshot, we can tell that there are 4 major steps to schedule this kind of backup based on the inputs specified in the first (pick whether to create or schedule a backup) and the second step (this page). The third step is about configuring xtrabackup (the chosen backup method on this page), the last step is about configuring the backup destination to cloud (the chosen backup destination on this page). Configuring advanced settings is really not an obstacle using ClusterControl. If you are unsure about all of the advanced options, just accept the default values which commonly suit general purpose backups.

Although the graphical interface is a web-based application, all monitoring and trending components like graphs, histograms, status and variable grids are updated in real-time with customizable range and refresh rate settings to suit your monitoring needs:

Advantages & Disadvantages

MySQL Workbench is relatively easy to install with no dependencies running as a standalone application. It has all the necessary features to manage and administer database objects required for your application. It is free and open source and backed by the team who maintains the MySQL server itself. New MySQL features are usually first supported by MySQL Workbench before the masses adopt it.

On the downside, MySQL Workbench does not support mobile or tablet versions. However, there are other comparable tools available on the respective apps store. The performance monitoring features for MySQL Workbench are useful (albeit simple) highlighting only the common metrics plus the monitoring data is not stored for future reference.

The ClusterControl GUI is a web-based application which is accessible from all devices that can run the supported web browsers whether it's on a normal PC, laptop, smartphones or tablets. It supports managing multiple database vendors, systems and versions and it stores all monitoring data in its database which can be used to track past events with proactive alerting capabilities. In terms of management, ClusterControl offers a basic schema and user management, but far superior for other advanced management features like configuration, automatic recovery, switchover, replication, node scaling, and load balancer management.

On the drawbacks, ClusterControl is dependent on a number of software programs to work smoothly. These include a properly tuned MySQL server, Apache web server, and also PHP modules. It also requires regular software updates to keep up with all the changes introduced by many vendors it supports. ClusterControl end-user targets are Sysadmins and DevOps, therefore it does not have many GUI features to manage the database objects (tables, views, routines, etc) and SQL development like SQL editor, highlighter and formatter.

The following table compares some of the notable graphical user interface features on both tools:

Aspect

MySQL Workbench

ClusterControl

Monitoring

Alerting

No

Management

Deployment

No

Data modelling and design

Yes

No

SQL development

Yes

No

Database migration tool

Yes

No

Step-by-step wizards

Yes

Yes

Topology view

No

Yes

Cost

Community edition (free)
Standard/Enterprise editions (commercial)

Community edition (free)

Enterprise edition (subscription)

As a summary of these MySQL Workbench Alternatives blog series, MySQL Workbench is a better tool to administer your database objects like schema, tables and users while ClusterControl is a better tool to manage your database system and infrastructure. We hope this comparison will help you decide which tool is the best for your MySQL graphical user interface client.
 

pghoard Alternatives - PostgreSQL Backup Management with ClusterControl

$
0
0

Managing backups could be a complex and risky task to do in a manual way. You must know that the backup is working according to your backup policy as you don’t want to be in the situation that you need the backup and it’s not working or it doesn’t exist. That will be a big problem for sure. So, the best here is to use a battle-tested backup management application, to avoid any issue in case of failure.

PGHoard is a PostgreSQL backup daemon and restore system that stores backup data in cloud object stores. It supports PostgreSQL 9.3 or later, until PostgreSQL 11, the latest supported version right now. The current PGHoard version is 2.1.0, released in May 2019 (1 year ago).

ClusterControl is an agentless management and automation software for database clusters. It helps deploy, monitor, manage, and scale your database server/cluster directly from the ClusterControl UI or using the ClusterControl CLI. It includes backup management features and supports PostgreSQL 9.6, 10, 11, and 12 versions. The current ClusterControl version is 1.7.6, released last month, in April 2020.

In this blog, we’ll compare PGHoard with the ClusterControl Backup Management feature and we’ll see how to install and use both systems. For this, we’ll use an Ubuntu 18.04 server and PostgreSQL11 (as it’s the latest supported version for using PGHoard). We’ll install PGHoard in the same database server, and import it to ClusterControl.

Backups Management Features Comparison

PGHoard

Some of the most important PGHoard features are:

  • Automatic periodic base backups
  • Automatic transaction log backups
  • Standalone Hot Backup support
  • Cloud object storage support (AWS S3, Google Cloud, OpenStack Swift, Azure, Ceph)
  • Backup restoration directly from object storage, compressed and encrypted
  • Point-in-time-recovery (PITR)
  • Initialize a new standby from object storage backups, automatically configured as a replicating hot-standby
  • Parallel compression and encryption

One of the ways to use it is to have a separate backup machine, so PGHoard can connect with pg_receivexlog to receive WAL files from the database. Another mode is to use pghoard_postgres_command as a PostgreSQL archive_command. In both cases, PGHoard creates periodic base backups using pg_basebackup.

ClusterControl

Let’s see also some of the most important features of this system:

  • User-friendly UI
  • Backup and Restore (in the same node or in a separate one)
  • Schedule Backups
  • Create a cluster from Backup
  • Automatic Backup Verification
  • Compression
  • Encryption
  • Automatic Cloud Upload
  • Point-in-time-recovery (PITR)
  • Different backup methods (Logical, Physical, Full, Incremental, etc)
  • Backup Operational Reports

As this is not only a Backup Management system, we’ll also mention different important features not just the Backup related ones:

  • Deploy/Import databases: Standalone, Cluster/Replication, Load Balancers
  • Scaling: Add/Remove Nodes, Read Replicas, Cluster Cloning, Cluster-to-Cluster Replication
  • Monitoring: Custom Dashboards, Fault Detection, Query Monitor, Performance Advisors, Alarms and Notifications, Develop Custom Advisors
  • Automatic Recovery: Node and Cluster Recovery, Failover, High Availability Environments
  • Management: Configuration Management, Database Patch Upgrades, Database User Management, Cloud Integration, Ops Reports, ProxySQL Management
  • Security: Key Management, Role-Based Access Control, Authentication using LDAP/Active Directory, SSL Encryption

The recommended topology is to have a separate node to run ClusterControl, to make sure that, in case of failure, you can take advantage of the auto-recovery and failover ClusterControl features (among others useful features).

System Requirements

PGHoard

According to the documentation, PGHoard can backup and restore PostgreSQL versions 9.3 and above. The daemon is implemented in Python and works with CPython version 3.5 or newer. The following Python modules could be required depends on the requirements:

  • psycopg2 to look up transaction log metadata
  • requests for the internal client-server architecture
  • azure for Microsoft Azure object storage
  • botocore for AWS S3 (or Ceph-S3) object storage
  • google-api-client for Google Cloud object storage
  • cryptography for backup encryption and decryption (version 0.8 or newer required)
  • snappy for Snappy compression and decompression
  • zstandard for Zstandard (zstd) compression and decompression
  • systemd for systemd integration
  • swiftclient for OpenStack Swift object storage
  • paramiko for sftp object storage

There is no mention of the supported Operating System, but it says that it was tested on modern Linux x86-64 systems, but should work on other platforms that provide the required modules.

ClusterControl

The following software is required by the ClusterControl server:

  • MySQL server/client
  • Apache web server (or nginx)
  • mod_rewrite
  • mod_ssl
  • allow .htaccess override
  • PHP (5.4 or later)
  • RHEL: php, php-mysql, php-gd, php-ldap, php-curl
  • Debian: php5-common, php5-mysql, php5-gd, php5-ldap, php5-curl, php5-json
  • Linux Kernel Security (SElinux or AppArmor) - must be disabled or set to permissive mode
  • OpenSSH server/client
  • BASH (recommended: version 4 or later)
  • NTP server - All servers’ time must be synced under one time zone
  • socat or netcat - for streaming backups

And it supports different operating systems:

  • Red Hat Enterprise Linux 6.x/7.x/8.x
  • CentOS 6.x/7.x/8.x
  • Ubuntu 12.04/14.04/16.04/18.04 LTS
  • Debian 7.x/8.x/9.x/10.x

If ClusterControl is installed via installation script (install-cc) or package manager (yum/apt), all dependencies will be automatically satisfied.

For PostgreSQL, it supports 9.6/10.x/11.x/12.x versions. You can find a complete list of the supported databases in the documentation.

It just requires Passwordless SSH access to the database nodes (using private and public keys) and a privileged OS user (it could be root or sudo user). 

The Installation Process

PGHoard Installation Process

We’ll assume you have your PostgreSQL database up and running, so let’s install the remaining packages. PGHoard is a Python package, so after you have the required packages installed, you can install it using the pip command:

$ apt install postgresql-server-dev-11 python3 python3-pip python3-snappy

$ pip3 install pghoard

As part of this installation process, you need to prepare the PostgreSQL instance to work with this tool. For this, you’ll need to edit the postgresql.conf to allow WAL archive and increase the max_wal_senders:

wal_level = logical

max_wal_senders = 4

archive_mode = on

archive_command = pghoard_postgres_command --mode archive --site default --xlog %f

This change will require a database restart:

$ service postgresql restart

Now, let’s create a database user for PGHoard:

$ psql

CREATE USER pghoard PASSWORD 'Password' REPLICATION;

And add the following line in the pg_hba.conf file:

host    replication  pghoard  127.0.0.1/32/32  md5

Reload the database service:

$ service postgresql reload

To make it work, you’ll need to create a JSON configuration file for PGHoard. We’ll see this in the next “Usage” section.

ClusterControl Installation Process

There are different installation methods as it’s mentioned in the documentation. In the case of manual installation, the required packages are specified in the same documentation, and there is a step-by-step guide for all the process.

Let’s see an example using the automatic installation script.

$ wget http://www.severalnines.com/downloads/cmon/install-cc

$ chmod +x install-cc

$ sudo ./install-cc   # omit sudo if you run as root

The installation script will attempt to automate the following tasks:

  • Install and configure a local MySQL server (used by ClusterControl to store monitoring data)
  • Install and configure the ClusterControl controller package via package manager
  • Install ClusterControl dependencies via package manager
  • Configure Apache and SSL
  • Configure ClusterControl API URL and token
  • Configure ClusterControl Controller with minimal configuration options
  • Enable the CMON service on boot and start it up

Running the mentioned script, you’ll receive a question about sending diagnostic data:

$ sudo ./install-cc

!!

Only RHEL/Centos 6.x|7.x|8.x, Debian 7.x|8.x|9.x|10.x, Ubuntu 14.04.x|16.04.x|18.04.x LTS versions are supported

Minimum system requirements: 2GB+ RAM, 2+ CPU cores

Server Memory: 1024M total, 922M free

MySQL innodb_buffer_pool_size set to 512M

Severalnines would like your help improving our installation process.

Information such as OS, memory and install success helps us improve how we onboard our users.

None of the collected information identifies you personally.

!!

=> Would you like to help us by sending diagnostics data for the installation? (Y/n):

Then, it’ll start installing the required packages. The next question is about the hostname that will be used:

=> The Controller hostname will be set to 192.168.100.116. Do you want to change it? (y/N):

When the local database is installed, the installer will secure it creating a root password that you must enter:

=> Starting database. This may take a couple of minutes. Do NOT press any key.

Redirecting to /bin/systemctl start mariadb.service

=> Securing the MySQL Server ...

=> !! In order to complete the installation you need to set a MySQL root password !!

=> Supported special password characters: ~!@#$%^&*()_+{}<>?

=> Press any key to proceed ...

And a CMON user password, which will be used by ClusterControl:

=> Set a password for ClusterControl's MySQL user (cmon) [cmon]

=> Supported special characters: ~!@#$%^&*()_+{}<>?

=> Enter a CMON user password:

That’s it. In this way, you’ll have all in place without installing or configuring anything manually.

=> ClusterControl installation completed!

Open your web browser to http://192.168.100.116/clustercontrol and enter an email address and new password for the default Admin User.

Determining network interfaces. This may take a couple of minutes. Do NOT press any key.

Public/external IP => http://10.10.10.10/clustercontrol

Installation successful. If you want to uninstall ClusterControl then run install-cc --uninstall.

The first time you access the UI, you will need to register for the 30-day free trial period.

After your 30-day free trial ends, your installation will automatically convert to the community edition unless you have a commercial license.

Backups Management Usage

PGHoards Usage

After this tool is installed, you need to create a JSON file (pghoard.json) with the PGHoard configuration. This is an example:

{

"backup_location": "/var/lib/pghoard",

"backup_sites": {

"default": {

"nodes": [

{

"host": "127.0.0.1",

"password": "Password",

"port": 5432,

"user": "pghoard"

}

],

"object_storage": {

"storage_type": "local",

"directory": "./backups"

},

"pg_data_directory": "/var/lib/postgresql/11/main/"

}

}

}

In this example, we’ll take a backup and store it locally, but you can also configure a cloud account and store it there:

"object_storage": {

"aws_access_key_id": "AKIAQTUN************",

"aws_secret_access_key": "La8YZBvN********************************",

"bucket_name": "pghoard",

"region": "us-east-1",

"storage_type": "s3"

},

You can find more details about the configuration in the documentation.

Now, let run the backup using this JSON file:

$ pghoard --short-log --config pghoard.json

INFO pghoard initialized, own_hostname: 'pg1', cwd: '/root'

INFO Creating a new basebackup for 'default' because there are currently none

INFO Started: ['/usr/lib/postgresql/11/bin/pg_receivewal', '--status-interval', '1', '--verbose', '--directory', '/var/lib/pghoard/default/xlog_incoming', '--dbname', "dbname='replication' host='127.0.0.1' port='5432' replication='true' user='pghoard'"], running as PID: 19057

INFO Started: ['/usr/lib/postgresql/11/bin/pg_basebackup', '--format', 'tar', '--label', 'pghoard_base_backup', '--verbose', '--pgdata', '/var/lib/pghoard/default/basebackup_incoming/2020-05-21_13-13_0', '--wal-method=none', '--progress', '--dbname', "dbname='replication' host='127.0.0.1' port='5432' replication='true' user='pghoard'"], running as PID: 19059, basebackup_location: '/var/lib/pghoard/default/basebackup_incoming/2020-05-21_13-13_0/base.tar'

INFO Compressed 83 byte open file '/var/lib/pghoard/default/xlog_incoming/00000003.history' to 76 bytes (92%), took: 0.001s

INFO 'UPLOAD' transfer of key: 'default/timeline/00000003.history', size: 76, origin: 'pg1' took 0.001s

INFO Compressed 16777216 byte open file '/var/lib/postgresql/11/main/pg_wal/000000030000000000000009' to 799625 bytes (5%), took: 0.175s

INFO 'UPLOAD' transfer of key: 'default/xlog/000000030000000000000009', size: 799625, origin: 'pg1' took 0.002s

127.0.0.1 - - [21/May/2020 13:13:31] "PUT /default/archive/000000030000000000000009 HTTP/1.1" 201 -

INFO Compressed 16777216 byte open file '/var/lib/pghoard/default/xlog_incoming/000000030000000000000009' to 799625 bytes (5%), took: 0.190s

INFO 'UPLOAD' transfer of key: 'default/xlog/000000030000000000000009', size: 799625, origin: 'pg1' took 0.028s

INFO Compressed 16777216 byte open file '/var/lib/pghoard/default/xlog_incoming/00000003000000000000000A' to 789927 bytes (5%), took: 0.109s

INFO 'UPLOAD' transfer of key: 'default/xlog/00000003000000000000000A', size: 789927, origin: 'pg1' took 0.002s

INFO Compressed 16777216 byte open file '/var/lib/postgresql/11/main/pg_wal/00000003000000000000000A' to 789927 bytes (5%), took: 0.114s

INFO 'UPLOAD' transfer of key: 'default/xlog/00000003000000000000000A', size: 789927, origin: 'pg1' took 0.002s

127.0.0.1 - - [21/May/2020 13:13:32] "PUT /default/archive/00000003000000000000000A HTTP/1.1" 201 -

INFO Ran: ['/usr/lib/postgresql/11/bin/pg_basebackup', '--format', 'tar', '--label', 'pghoard_base_backup', '--verbose', '--pgdata', '/var/lib/pghoard/default/basebackup_incoming/2020-05-21_13-13_0', '--wal-method=none', '--progress', '--dbname', "dbname='replication' host='127.0.0.1' port='5432' replication='true' user='pghoard'"], took: 1.940s to run, returncode: 0

INFO Compressed 24337408 byte open file '/var/lib/pghoard/default/basebackup_incoming/2020-05-21_13-13_0/base.tar' to 4892408 bytes (20%), took: 0.117s

INFO 'UPLOAD' transfer of key: 'default/basebackup/2020-05-21_13-13_0', size: 4892408, origin: 'pg1' took 0.008s

In the “backup_location” directory (in this case /var/lib/pghoard), you’ll find a pghoard_state.json file with the current state:

$ ls -l /var/lib/pghoard

total 48

drwxr-xr-x 6 root root  4096 May 21 13:13 default

-rw------- 1 root root 42385 May 21 15:25 pghoard_state.json

And a site directory (in this case called “default/”) with the backup:

$ ls -l /var/lib/pghoard/default/

total 16

drwxr-xr-x 2 root root 4096 May 21 13:13 basebackup

drwxr-xr-x 3 root root 4096 May 21 13:13 basebackup_incoming

drwxr-xr-x 2 root root 4096 May 21 13:13 xlog

drwxr-xr-x 2 root root 4096 May 21 13:13 xlog_incoming

You can check the backup list using the follogin command:

$ pghoard_restore list-basebackups --config pghoard.json

Available 'default' basebackups:

Basebackup                                Backup size    Orig size  Start time

----------------------------------------  -----------  -----------  --------------------

default/basebackup/2020-05-21_13-13_0            4 MB        23 MB  2020-05-21T13:13:31Z

ClusterControl Usage

For this, we’ll assume you have your PostgreSQL database cluster imported in ClusterControl or you deployed it using this system.

In ClusterControl, select your cluster and go to the "Backup" section, then, select “Create Backup”.

For this example, we’ll use the “Schedule Backup” option. When scheduling a backup, in addition to selecting the common options like method or storage, you also need to specify schedule/frequency.

You must choose one method, the server from which the backup will be taken, and where you want to store it. You can also upload your backup to the cloud (AWS, Google, or Azure) by enabling the corresponding button.

Then you need to specify the use of compression, encryption, and the retention of your backup. In this step, you can also enable the “Verify Backup” feature which allows you to confirm that the backup is usable by restoring it in a different node.

If you enable the “Upload backup to the cloud option”, you will see a section to specify the cloud provider and the credentials. If you don’t have integrated your cloud account with ClusterControl you must go to ClusterControl -> Integrations -> Cloud Providers to add it. 

On the backup section, you can see the progress of the backup, and information like the method, size, location, and more.

ClusterControl Command Line (s9s)

For scripting and automating tasks, or even if you just prefer the command line, ClusterControl has the s9s tool. It's a command-line tool for managing your database cluster. Let’s see an example of how to create and list backups using this tool:

$ s9s backup --list --cluster-id=40 --long --human-readable
$ s9s backup --create --backup-method=pg_basebackup --cluster-id=40 --nodes=192.168.100.125 --backup-directory=/tmp --wait

You can find more examples and information in the ClusterControl CLI documentation section.

Conclusion

As a conclusion of comparing these mentioned backup management systems, we can say that PGHoard is a free but complex solution for this task. You’ll need some time to understand how it works and how to configure it, as the official documentation is a bit poor on that. Also, it looks a bit out of date, as the latest release was 1 year ago. Moreover, ClusterControl is an all-in-one management system with a lot of features not only backup management, with an user-friendly and easy to use UI. It has community (with limited available features) and paid versions with a 30-day free trial period. The documentation is clear and complete, with examples and detailed information.

We hope this blog helps you to make the best decision to keep your data safe.

The Battle of the NoSQL Databases - Comparing MongoDB & Cassandra

$
0
0

Introduction to MongoDB

MongoDB was introduced back in 2009 by a company named 10gen. 10gen was later renamed to MongoDB Inc., the company which is responsible for the development of the software, and sells the enterprise version of this database. MongoDB Inc. handles all the support with its excellent enterprise-grade support team around the clock. They are committed to providing lifetime support, which means customers choose to use any version of MongoDB, and if they wish to upgrade, it would be supported anytime. It also provides them with an opportunity to be in sync with all the security fixes that the company offers round the clock.

MongoDB is well-known NoSQL databases that made a deep proliferation over the last decade or so, fueled by the explosive growth of the web and mobile applications running in the cloud. This new breed of internet-connected applications demands fast, fault-tolerant and scalable schema-less data storage which NoSQL databases can offer. MongoDB uses JSON to store data like documents that can vary in structure offerings, a dynamic, flexible schema. MongoDB designed for high availability and Scalability with auto-sharding. MongoDB is one of the popular open-source databases that arise under the NoSQL database, which is used for high volume data storage. MongoDB has the rows called documents that don't require a schema to be defined because the fields are created on the fly.  The data model available within MongoDB allows hierarchical relationships representation, to store arrays, and other more complex structures more efficiently.

Introduction to Cassandra

Apache Cassandra is another well-known as a free and open-source, distributed, wide column store. Cassandra was introduced back in 2008 by a couple of developers from Facebook, which later released as an open-source project. It is currently being supported by the Apache Software Foundation, and Apache is presently maintaining this project for any further enhancements.

Cassandra is a NoSQL database management system designed to handle large amounts of data across many commodity servers and provide high availability with no single point of failure. Cassandra offers very robust support for clusters spanning multiple datacenters, with asynchronous masterless replication allowing low latency operations for all clients. Cassandra supports the distribution design of Amazon Dynamo with the data model of Google's Bigtable.

Similarities between MongoDB and Cassandra

With the brief introduction of these two NoSQL databases, let us review some of the similarities between these two databases:

Both MongoDB and Cassandra are NoSQL database types and open-source distribution.

  • None of these databases is a replacement to the traditional RDBMS database types.
  • Both of these databases are not compliant to ACID (Atomicity, Consistency, Isolation, Durability), which refers to properties of database transactions that guarantee database transactions are processed reliably.
  • Both of these databases support sharding horizontal partitioning.
  • Consistency and Normalization are two concepts that these two database types not satisfy (as these lean more towards the RDBMS database types)

MongoDB vs. Cassandra: Features

Both technologies play a vital role in their fields, with their similarities between MongoDB and Cassandra showing their common features and differences show, uniqueness of these technologies. 

Figure 1 MongoDB vs. Cassandra – 8 Major Factors of Difference

Expressive Data Model

MongoDB provides a rich and expressive data model that is known as 'object-oriented' or 'data-oriented.' This data model can easily support and represent any data structure in the domain of the user.  The data can have properties and can be nested in each other for multiple levels. Cassandra is more of a traditional data model with table structure, rows, and specific data type columns. This type is defined during the creation of the table. Anyhow, when we compare both the models, MongoDB tends to provide a rich data model. The figure below describes the typical high-level architectures of both databases in terms of its storage and replication levels.

Figure 2: Architecture diagram MongoDB vs. Cassandra

High Availability Master Node

MongoDB supports one master node in a cluster, which controls a set of slave nodes. If the master node goes down, a slave is elected as master and takes about 20-30 seconds for the same. During this delay time, the cluster will be down and will not be able to accept any input. Cassandra supports multiple master nodes in a cluster, and in the event one of the master nodes goes offline, its place will be taken by another master node. In comparison, Cassandra supports higher availability over MongoDB because it does not affect the cluster and is always available. 

Secondary Indexes

MongoDB has more advantages compared to Cassandra if an application requires secondary indexes along with flexibility in the data model. Because of this, MongoDB is much easier to index any property of the data stored in the database. This property makes it easy to query. Cassandra has cursor support for the secondary indexes, which are limited to single columns and equality comparisons

Write Scalability

MongoDB supports only one master node. This master node in MongoDB only accepts the input, and the rest of the nodes in MongoDB are used as an output; therefore, if the data has to be written in the slave nodes and let it pass through the master node. Cassandra supports multiple master nodes in a cluster, which makes it suitable in the case of Scalability.

Query Language Support

Currently, MongoDB doesn't no support a query language. The queries in MongoDB are structured as JSON fragments. In contrast, Cassandra has a user-friendly set of queries which is known as CQL (Cassandra Query Language) and is easily adaptable by the developers who have prior knowledge of SQL. How are their queries different? 

Selecting records from the customer table:

 Cassandra:

SELECT * FROM customer;

 MongoDB:

db.customer.find()

Inserting records into the customer table:

 Cassandra:

INSERT INTO customer (custid, branch, status) VALUES('appl01', 'headquarters', 'A');

 MongoDB:

db.customer.insert({ cust_id: 'appl01', branch: 'headquarters', status: 'A' })

Updating records in the customer table:

Cassandra:

UPDATE Customer SET branch = ‘headquarters' WHERE custage > 2;

MongoDB:

db.customer.update( { custage: { $gt: 2 } }, { $set: { branch: 'headquarters' } }, { multi: true } )

Native Aggregation

MongoDB has a built-in Aggregation framework which is used to run an ETL pipeline to transform the data stored in the database and also supports both small and medium data traffic. When there is increased complexity, the framework gets more difficult to debug as well, whereas Cassandra does not have an integrated aggregation framework. Cassandra utilized external tools such as Hadoop, Apache Spark, etc.  Therefore, MongoDB is better than Cassandra when it comes to the built-in aggregation framework.

Schema-less Model

MongoDB provides the facility for a user is allowed to alter the enforcement of any schema on the database. Each database can be a different structure. It all depends on the program or the application to interpret the data. Whereas, Cassandra doesn't offer the facility to alter schemes but provides static typing where the user is required to define the type of the column in the beginning.

Performance Benchmark

Cassandra considers performing better in applications that require heavy data load since it can support multiple master nodes in a cluster. Whereas, MongoDB will not be ideal for applications with heavy data load as it can't scale with the performance. Based on the industry-standard benchmark created by Yahoo! called YCSB, MongoDB provides greater performance than Cassandra in all the tests they have executed, in some use cases by as much as 25x.  When optimized for a balance of throughput and durability between Cassandra and MongoDB, MongoDB provides over 50% greater throughput in mixed workloads, and 2.5x greater throughput in read-dominant workloads compared to Cassandra.

MongoDB provides the most flexibility for ensuring durability for specific operations: users can opt for the durability optimized configuration for specific operations that are deemed critical but for which the additional latency is acceptable. For Cassandra, this change requires editing a server config file and a full restart of the database.

Conclusion

MongoDB is known best for workloads with lots of highly unstructured data. The scale and types of data that you will be working with MongoDB's flexible data structures will suit you better than Cassandra. To use MongoDB effectively, you will have to be able to manage with the possibility of some downtime if the master node fails, as well as with limited write speeds. And don't forget, you will also have to learn a new query language. In MongoDB, the complex data can be easily managed by using the JSON format support capabilities. This is a key differentiator for MongoDB when you compare it with Cassandra. In some situations, Cassandra can be considered the best database to implement when involving large amounts of data, speed optimization, and query execution.  The comparison results of Cassandra and MongoDB, we will find that they have their respective advantages depending upon the implementation requirements and the volume of data to be dealt with.

Preparing a MongoDB Server for Production

$
0
0

After developing your application and database model (when it is time to move the environment into production) there are a couple of things that need to be done first. Oftentimes developers fail to take into consideration additional important MongoDB steps before deploying the database into production. Consequently, it is in the production mode they end up encountering underlying setbacks that are not be presented in the development mode. Sometimes it may be too late or rather a lot of data would be lost if disaster strikes. Besides, some of the steps discussed here will enable one to gauge the database’s health and hence plan for necessary measures before disaster strikes.

Use the Current Version and Latest Drivers

Generally, latest versions in any technology come with improved features in regard to  the underlying functionality than their predecessors. MongoDB’s latest versions are more robust and improved than their predecessors in terms of performance, scalability and memory capacity. The same applies for the related drivers since they  are  developed by the core database engineers and get updated more frequently even than the database itself. 

Native extensions installed for your language can easily lay a platform for quick and standard procedures for testing, approving and upgrading the new drivers. There are also automotive software such as Ansible, Puppet, SaltStack and Chef that can be used for easy upgrade of the MongoDB in all your nodes without incurring professional expenses and time.

Also consider using the WiredTiger storage engine as it is the most developed with modern features that suit modern database expectations

Subscribe to a MongoDB mailing list to get the latest information in regard to changes to new versions & drivers and bug fixes hence keeping updated.

Use a 64-bit System to Run MongoDB

In 32-bit systems,  MongoDB processes are limited to about 2.5GB of data because the database uses memory-mapped files for performance. This becomes a limitation for processes that might surpass  the boundary leading to a crush. The core impact will be: in case of an error,  you will not be able to  restart the server till the time you remove your data or migrate your database to a higher system like the 64-bit hence a higher downtime for your application. 

If you have to keep using a 32-bit system,  your coding must be very simple to reduce the number of bugs and latency for throughput operations.

However for code complexities such as aggregation pipeline and geodata, it is advisable to use the 64-bit system.

Ensure Documents are Bounded to 16MB Size

MongoDB documents are limited to the 16MB size but you need not to get close to this limit as it will implicate some performance degradation. In practice, the documents are mostly KB or less in size. Document size is dependent on the data modelling strategy between embedding and referencing. Embedding is preferred where the document size is not expected to grow much in size. For instance, if you have a social media application where users post and it has comments, the best practice will be to have two collections one to hold post information.

  {

   _id:1,

   post: 'What is in your mind?',

   datePosted: '12-06-2019',

   postedBy:'xyz',

   likes: 10,

   comments: 30

}

and the other to hold comments for that post.

     {

   _id: ObjectId('2434k23k4'),

   postId: 1,

   dateCommented: '12-06-2019',

   commentedBy:'ABCD',

   comment: 'When will we get better again',

}

By having such data models, comments will be stored in a different collection from the post. This prevents the document in post collection from growing out of bound in case there will be so many comments. Ensure you  avoid application patterns that would allow documents to grow unbounded.

Ensure Working Set Fits in Memory

The database may fail to read data from virtual memory (RAM) leading to page faults.  Page faults will force the database to read data from a physical disk leading to  increased latency and consequently a lag in the overall application performance.  Page faults happen due to working with a large set that does not fit in memory. This may be as a result of some documents having an unbounded size or poor sharding strategy.Remedies for page faults will be:

  • Ensuring documents are bounded to the 16MB size.
  • Ensuring a good sharding strategy by selecting an optimal sharding key that will limit the number of documents a throughput operation will be subjected to.
  • Increase size of the MongoDB instance to accommodate more working sets.

Ensure you Have Replica Sets in Place

In the database world, it is not ideal to rely on a single  database due to the fact that catastrophe may strike. Besides, you would expect an increase in the number of users to the database hence need to ensure high availability of data. Replication is a crucial approach for ensuring high availability in case of failover. MongoDB has the capability of serving data geographically: which means users from different locations will be served by the nearest cloud host as one way of reducing latency for requests. 

In case the primary node fails, the secondary nodes can elect a new one to keep up with write operations rather than the application having a downtime during the failover. Actually, some cloud hosting platforms that are quite considerate with replication don’t support non-replicated MongoDB for production environments.

Enable Journaling

As much as journaling implicates some performance degradation, it is important as well. Journaling enhances write ahead operations which means in case the database fails in the process of doing an update, the update would have been saved somewhere and when it comes alive again, the process can be completed. Journaling can easily facilitate crash recovery hence should be turned on by default.

Ensure you Setup a Backup Strategy

Many businesses fail to continue after data loss due to no or poor backup systems. Before deploying your database into production ensure you have used either of these backup strategies:

  • Mongodump: optimal for small deployments and when producing backups filtered on specific needs.
  • Copying underlying: optimal for large deployments and efficient approach for taking full backups and restoring them.
  • MongoDB Management Service (MMS): provides continuous online backup for MongoDB as a fully managed service. Optimal for a sharded cluster and replica sets.

Backups files should also not be stored in the same host provider of the database. Backup Ninja is a service that can be used for this.

Be Prepared for Slow Queries

Hardly can one realize slow queries in the development environment due to the fact that little data is involved. However, this may not be the case in production considering that you will have many users or a lot of data will be involved. Slow queries may arise if you failed to use indexes or used an indexing key that is not optimal. Nevertheless, we should find a way that will show you the reason for slow queries. 

We therefore resolve to enable MongoDB Query Profiler. As much as this can lead to performance degradation, the profiler will help in exposing performance issues. Before deploying your database, you need to enable the profiler for the collections you suspect might have slow queries, especially ones that involve documents  with a lot of embedding.

Connect to a Monitoring Tool

Capacity planning is a very essential undertaking in MongoDB. You will also need to know the health of your db at any given time. For convenience, connecting your database to a monitoring tool will save you some time in realizing what you need to improve on your database with time. For instance, a graphical representation that indicates CPU slow performance as a result of increased queries will direct you to add more hardware resources to your system. 

Monitoring tools also have an alerting system through mailing or short messages that conveniently update you on some issues before they heighten into catastrophe. Therefore, in production, ensure your database is connected to a monitoring tool.

ClusterControl provides free MongoDB monitoring in the Community Edition.

Implement Security Measures

Database security is another important feature that needs to be taken into account strictly. You need to protect the MongoDB installation in production by ensuring some pre-production security checklists are adhered to. Some of the considerations are:

  • Configuring Role-Based Access Control
  • Enabling Access Control and Enforce Authentication
  • Encrypting incoming and outgoing connections (TLS/SSL)
  • Limiting network exposure
  • Encrypting and protecting data
  • Have a track plan on access and changes to database configurations

Avoid external injections by running MongoDB with secure configuration options. For example, disabling server-side scripting if not using JavaScript server side operations such as mapReduce and $where. Use the JSON validator for your collection data through some modules like mongoose to ensure that all stored documents are in the  valid BSON format.

Hardware and Software Considerations 

MongoDB has few hardware prerequisites, since it is explicitly designed with great consideration on the commodity hardware necessary. The following are the main hardware deliberations for MongoDB you need to consider before deployment into production.

  • Assign adequate  RAM and CPU
  • Use the WiredTiger storage engine. Designed to use filesystem cache and WiredTiger internal cache hence increased performance. For instance, when operating with a system of 4GB RAM the  WiredTiger cache uses 1.5GB of the RAM  ( 0.5 * (4GB -1GB) = 1.5GB) while a system with 1.2GB of RAM WiredTiger  cache uses only 256MB. 
  • NUMA Hardware. There are numerous operational issues which include slow performance and high system process usage,  therefore, one should consider configuring a memory interleave policy. 
  • Disk and Storage system: Use solid state Disk (SSDs): MongoDB shows better  price-performance ratio with SATA SSD

Conclusion

Databases in production are very crucial for ensuring smooth running of a business hence should be treated with a lot of considerations. One should lay down some procedures that can help to reduce errors or rather provide an easy way of finding these errors. Besides, it is advisable to set up an alerting system that will show the database’s health with time for capacity planning and detecting issues before they mitigate into catastrophe.


What is a Multi-Cloud Database?

$
0
0

During the recent 24-hour Percona Live, multi-cloud was regularly one of the key topics. This is just another key indicator of the trend of many organizations who are switching their architectures or expanding their businesses to include multi-cloud database deployments. 

Multi-cloud is considered by many as the new normal, but it has been growing largely over the last two years and the adoption of this approach is showing significant growth. 

There are, however, certain risks and concerns which explain why some organizations have not switched their architecture or are not interested in capitalizing their infrastructure.  These are often due to concerns about security and data autonomy.

What is Multi-Cloud?

Multi-cloud is a strategy in utilizing the cloud infrastructure of two or more cloud vendors (public or private) instead of relying on a single vendor. This is not limited to what the public clouds (such as what Amazon, Google, and Microsoft) are offering. It can also mean using a private cloud, which has a limited offering to select users or is offered over a private internal network for its computing services, or is offered with the additional control and customization available from dedicated resources over a computing infrastructure hosted on-premises. Being on a multi-cloud helps organizations avoid vendor lock-in and the ability to have a cloud-agnostic platform approach.

A common example of a multi-cloud for this scenario is an enterprise application that requires data backup and restore strategy to be stored in multiple locations. Another example being if customers demand that your application has to support a particular service on a different vendor once a restore process is done. 

Our products ClusterControl and Backup Ninja are two of the few applications that are designed for the multi-cloud approach, not only for the infrastructure but also for multi-cloud database deployments.

Multi-cloud should not be confused with hybrid cloud. The latter refers to the presence of one or multiple cloud deployments associated with deployments running on-prem or some form of integration or orchestration between them, such as Kubernetes, for example.

What is a Multi-Cloud Database?

While a multi-cloud focuses on cloud vendors (either privately or publicly - for which the latter is the common place to host the database), a multi-cloud database specifies the term as it relates specifically to database operations. 

It's a strategy to utilize multiple deployments of databases dispersed over different cloud vendors, whereas this service offering for databases is not limited to storing or processing data, but also involves data management such as backup and restore mechanisms, data recovery, data migration, etc. with added database enhancements and efficiency features such as query optimization or performance enhancements.

According to Percona's recent survey report, organizations globally reveal that their preference is to have multiple databases placed in multiple locations across multiple platforms. Many of these platforms offer SaaS and cloud solutions to startups as well as established enterprises. With the emergence of DBaaS sprouting globally from various companies that offer this service can entice companies to adopt and capitalize on this trend.

Do You Need a Multi-cloud Database?

Multi-Cloud databases are popular, largely due to the following reasons...

  • It’s cost-effective
  • It’s more efficient
  • Higher performance
  • Less skills required and less focus for database management and performance efficiency workloads
  • Better automation options
  • Features high-availability & scalability to avoid unwanted outages
  • Smarter tool options
  • Better security and faster phase enhancements
  • Maximum protection for your mission critical systems
  • Fully-managed services available (means less worry, less work and focus on the business application logic)

These are just some of the few key aspects why there is a sudden adoption of users for this technology. According to Flexera (acquired by Rightscale), among the top initiatives for capitalizing over the cloud is due to cost savings, as shown in the graph below...

Top Cloud Initiatives for 2020 - Flexera

Still, it shows that AWS emerges as the choice to run their infrastructure over the cloud with Azure and Google Cloud following among the top list of public cloud adoption for enterprises.

Public Cloud Adoption for Enterprises - Flexera

With the boom in DBaaS, other organizations are offering managed services for databases; especially the open-source databases. 

  • MariaDB just recently delivered their SkySQL MariaDB Cloud Database
  • MongoDB Atlas is a cloud-hosted MongoDB service on AWS, Azure, and Google Cloud in just a few clicks. 
  • For PostgreSQL enthusiasts, there's ElephantSQL to start with. 
  • Another provider which offers various database deployment services for your data infrastructure is Aiven. Aiven is doing a great job offering various database services (PostgreSQL, MySQL, Kafka, InfluxDB, etc.) with very easy to deploy your new database infrastructure by interacting over the UI. 

Each of these approaches, at their core, are fundamentally the same. They remove the hassle of creating automation for CI/CD deployments allowing you to have your database infrastructure completely set up ready for production use in just a few minutes. It's very cost effective, as it does not need to capitalize on hardware infrastructure.

Disadvantages of Multi-Cloud Databases

Sounds enticing right? While multi-cloud databases might sound interesting, there are a number of concerns with the technology. Security and data autonomy is still a concern, especially for FinTech or applications indulging EHR or EMR systems.

Long term costs of running a multi-cloud database has yet to be fully studied. Wild predictions are not welcome, as putting such large investments could impact the business. 

Exploring the various offerings from different vendors is a great idea, but you also have to consider things such as things being cloud-agnostic and avoiding vendor lock-in should you decide to explore other possibilities in the future. 

Technology is always growing and when major changes occur, it's often hard to switch onto different platforms as it costs money and resources.

Multi-Cloud: The Right Tools are the Path to Success

Regardless of the advantages and benefits of multi-cloud approaches, there will be complexity and finding the right tool for your specific needs is paramount. 

You need to choose the desired application and software that offers a seamless approach when deploying your multi-cloud databases, one that offers the capacity to oversee and observe your database performance and efficiency. 

Databases are very flexible and customizable in accordance to your desired performance tuning and it is these features that will ultimately enrich your application mechanism and improve the delivery to your end users.

ClusterControl is a Multi-Cloud Database Deployment Platform

If you decide to leverage multi-cloud deployments of your database, then you must leverage smart tools with a wide coverage of multi-cloud platforms. ClusterControl is one of these tools. ClusterControl offers support for the deployment of your databases to AWS, Google Cloud, or Azure, in any combination.

Multi-Cloud databases in ClusterControl are quite straightforward. All you need to do is set up your cloud providers credentials just like below...

Multi-Cloud Database Deployments with ClusterControl

Then select the provider and provide the credentials to connect via API, for example:

Multi-Cloud Database Deployments with ClusterControl

Then, ClusterControl has a “Deploy in the Cloud” option.

Multi-Cloud Database Deployments with ClusterControl

Then select the desired database vendor on which you would like to deploy as seen below:

Multi-Cloud Database Deployments with ClusterControl

ClusterControl also offers a way to manually setup your desired multi-cloud infrastructure. This blog post, Deploying Secure Multicloud MySQL Replication on AWS and GCP with VPN, can show you how.

Conclusion

Multi-cloud database is now part of the new normal. Many enterprises and large organizations have revealed their interest in adopting and implementing a multi-cloud and deploying databases, not only in one provider, but onto different providers. 

Avoiding vendor lock-in and increasing cost efficiency remain a top priority for this type of deployment, yet, a key takeaway for leveraging multi-cloud deployment of your databases relies on the kind of tools you use and how efficient they are in helping you manage your database once it’s deployed.


PostgreSQL Multi-Cloud Cluster Deployment

$
0
0

A multi-cloud environment is a good option for a Disaster Recovery Plan (DRP), but it can be a time-consuming task as you need to configure the connectivity between the different cloud providers and you will then need to deploy and manage your database cluster in two different places.

In this blog, we will show how to perform a multi-cloud deployment for PostgreSQL in two of the most popular cloud providers at the moment, AWS and Google Cloud. For this task, we will use some of the features that ClusterControl can offer you, like Scaling, and Cluster-to-Cluster Replication.

We will assume you have a ClusterControl installation running and have already created two different cloud provider accounts.

Preparing Your Cloud Environment

First, you need to create your environment in your main Cloud Provider. In this case, we will use AWS with 2 PostgreSQL nodes:

Make sure you have the SSH and PostgreSQL traffic allowed from your ClusterControl server by editing your Security Group:

Then, go to the secondary Cloud Provider and create at least one virtual machine that will be the slave node. We will use the Google Cloud Platform with 1 PostgreSQL node.

And again, make sure you are allowing SSH and PostgreSQL traffic from your ClusterControl server:

In this case, we are allowing the traffic without any restriction on the source, but it is just an example and it is not recommended in real life.

Deploy a PostgreSQL Cluster in the Cloud

We will use ClusterControl for this task, so we are assuming you have it installed.

Go to your ClusterControl server, and select the option “Deploy”. If you already have a PostgreSQL instance running, then you need to select the “Import Existing Server/Database” instead.

When selecting PostgreSQL, you must specify User, Key or Password, and port to connect by SSH to your PostgreSQL nodes. You also need the name for your new cluster and if you want ClusterControl to install the corresponding software and configurations for you.

Please check the ClusterControl user requirements for more information about this step.

After setting up the SSH access information, you must define the database user, version, and datadir (optional). You can also specify which repository to use. In the next step, you need to add your servers to the cluster you are going to create.

When adding your servers, you can enter IP or hostname. In this step, you could also add the node placed in the secondary Cloud Provider, as ClusterControl doesn’t have any limitations about the network to be used, but to make it more clear, we will add it in the next section. The only requirement here is to have SSH access to the node.

In the last step, you can choose if your replication will be Synchronous or Asynchronous.

In case you are adding your remote node here, it is important to use Asynchronous replication, if not, your cluster could be affected by the latency or network issues.

You can monitor the creation status in the ClusterControl activity monitor.

Once the task is finished, you can see your new PostgreSQL cluster in the main ClusterControl screen.

Adding a Remote Slave Node in the Cloud

Once you have your cluster created, you can perform several tasks on it, like deploy/import a load balancer or a replication slave node.

Go to cluster actions and select “Add Replication Slave”:

Let’s use the “Add new Replication slave” option as we are assuming that the remote node is a fresh installation, if not, you can use the “Import existing Replication Slave” option instead.

Here, you only need to choose your Master server, enter the IP address for your new slave server, and the database port. Then, you can choose if you want ClusterControl to install the software and if the replication slave should be Synchronous or Asynchronous. Again, if you are adding a node in a different datacenter you should use Asynchronous replication to avoid issues related to the network performance. 

In this way, you can add as many replicas as you want and spread read traffic between them using a load balancer, which you can also implement with ClusterControl.

You can monitor the replication slave creation in the ClusterControl activity monitor.

And check your final topology in the Topology View Section.

Cluster-to-Cluster Replication in the Cloud

Instead of using the “Add Replication Slave” option to have a Multi-Cloud environment, you can use the ClusterControl Cluster-to-Cluster Replication feature to add a remote cluster. At the moment, this feature has a limitation for PostgreSQL that allows you to have only one remote node, so it is pretty similar to the previous way, but we are working to remove that limitation soon in a future release.

To create a new Slave Cluster, go to ClusterControl -> Select Cluster -> Cluster Actions -> Create Slave Cluster.

The Slave Cluster will be created by streaming data from the current Master Cluster.

In this section, you must choose the master node of the current cluster from which the data will be replicated.

When you go to the next step, you must specify User, Key or Password, and port to connect by SSH to your servers. You also need a name for your Slave Cluster and if you want ClusterControl to install the corresponding software and configurations for you.

After setting up the SSH access information, you must define the database version, datadir, port, and admin credentials. As it will use streaming replication, make sure you use the same database version and credentials used in the Master Cluster. You can also specify which repository to use.

In this step, you need to add the server for the new Slave Cluster. For this task, you can enter both the IP Address or Hostname of the database node.

You can monitor the Slave Cluster creation in the ClusterControl activity monitor. Once the task is finished, you can see the cluster in the main ClusterControl screen.

Conclusion

These ClusterControl features will allow you to quickly set up replication between different Cloud Providers for a PostgreSQL database (and different technologies), and manage the setup in an easy and friendly way. About the communication between the Cloud Providers, for security reasons, you must restrict the traffic only from known sources, so only from Cloud Provider 1 to Cloud Provider 2 and vice versa.


Multi-Cloud Full Database Cluster Failover Options for MariaDB Cluster

$
0
0

With high availability being paramount in today’s business reality, one of the most common scenarios for users to deal with is how to ensure that the database will always be available for the application. 

Every service provider comes with an inherited risk of service disruption therefore one of the steps that can be taken are to rely on multiple providers to alleviate the risk and additional redundancy. 

Cloud service providers are no different - they can fail and you should plan for this in the advance. What options are available for MariaDB Cluster? Let’s take a look at it in this blog post.

MariaDB Database Clustering in Multi-Cloud Environments

If SLA proposed by one cloud service provider is not enough, there’s always an option to create a disaster recovery site outside of that provider. Thanks to this, whenever one of the cloud providers experiences some service degradation, you can always switch to another provider and keep your database up and available.

One of the problems that are typical for multi-cloud setups is the network latency that’s unavoidable if we are talking about larger distances or, in general, multiple geographically separated locations. Speed of light is quite high but it is finite, every hop, every router also adds some latency into the network infrastructure. 

MariaDB Cluster works great on low-latency networks. It is a quorum-based cluster where prompt communication between all nodes is required to keep the operations smooth. Increase in network latency will impact cluster operations, especially performance of the writes. There are several ways this problem can be addressed. 

First we have an option to use separate clusters connected using asynchronous replication links. This allows us to almost forget about latency because asynchronous replication is significantly better suited to work in high latency environments. 

Another option is that,  given low latency networks between datacenters, you still might be perfectly fine to run a MariaDB Cluster spanning across several data centers. After all, multiple datacenters don’t always mean vast distances geographically-wise - you can as well use multiple providers located within the same metropolitan area, connected with fast, low-latency networks. Then we’ll be talking about latency increase to tens of milliseconds at most, definitely not hundreds. It all depends on the application but such an increase may be acceptable.

Asynchronous Replication Between MariaDB Clusters

Let’s take a quick look at the asynchronous approach. The idea is simple - two clusters connected with each other using asynchronous replication. 

Asynchronous Replication Between MariaDB Clusters

This comes with several limitations. For starters, you have to decide if you want to use multi-master or would you send all traffic to one datacenter only. We would recommend to stay away from writing to both datacenters and using master - master replication. This may lead to serious issues if you do not exercise caution.

If you decide to use the active - passive setup, you would probably want to implement some sort of a DNS-based routing for writes, to make sure that your application servers will always connect to a set of proxies located in the active datacenter. This might be achieved by either literally DNS entry that would be changed when failover is required or it can be done through some sort of a service discovery solution like Consul or etcd.

The main downside of the environment built using the asynchronous replication is the lack of ability to deal with network splits between datacenters. This is inherited from the replication - no matter what you want to link with the replication (single nodes, MariaDB Clusters), there is no way to go around the fact that replication is not quorum-aware. There is no mechanism to track the state of the nodes and understand the high level picture of the whole topology. As a result, whenever the link between two datacenters goes down, you end up with two separate MariaDB clusters that are not connected and that are both ready to accept traffic. It will be up to the user to define what to do in such a case. It is possible to implement additional tools that would monitor the state of the databases from outside (i.e. from the third datacenter) and then take actions (or do not take actions) based on that information. It is also possible to collocate tools that would share the infrastructure with databases but would be cluster-aware and could track the state of the datacenter connectivity and be used as the source of truth for the scripts that would manage the environment. For example, ClusterControl can be deployed in a three-node cluster, node per datacenter, that uses RAFT protocol to ensure the quorum. If a node losts the connectivity with the rest of the cluster it could be assumed that the datacenter has experienced network partitioning.

Multi-DC MariaDB Clusters

Alternative to the asynchronous replication could be an all-MariaDB Cluster solution that spans across multiple datacenters.

Multi-DC MariaDB Clusters

As stated at the beginning of this blog, MariaDB Cluster, just like every Galera-based cluster, will be impacted by the high latency. Having said that, it is perfectly acceptable to run it in “not-so-high” latency environments and expect it to behave properly, delivering acceptable performance. It all depends on the network throughput and design, distance between datacenters and application requirements. Such an approach will work great especially if we use segments to differentiate separate data centers. It allows MariaDB Cluster to optimize its intra cluster connectivity and reduce cross-DC traffic to the minimum.

The main advantage of this setup is that it relies on MariaDB Cluster to handle failures. If you use three data centers, you are pretty much covered against the split-brain situation - as long as there is a majority, it will continue to operate. It is not required to have a full-blown node in the third datacenter - you can as well use Galera Arbitrator, a daemon that acts as a part of the cluster but it does not have to handle any database operations. It connects to the nodes, takes part in the quorum calculation and may be used to relay the traffic should the direct connection between the two data centers not work. 

In that case the whole failover process can be described as: define all nodes in the load balancers (all if data centers are close to each other, in other case you may want to add some priority for the nodes located closer to the load balancer) and that’s pretty much it. MariaDB Cluster nodes that form the majority will be reachable through any proxy.

Deploying a Multi-Cloud MariaDB Cluster Using ClusterControl

Let’s take a look at two options you can use to deploy multi-cloud MariaDB Clusters using ClusterControl. Please keep in mind that ClusterControl requires SSH connectivity to all of the nodes it will manage so it would be up to you to ensure network connectivity across multiple datacenters or cloud providers. As long as the connectivity is there, we can proceed with two methods.

Deploying MariaDB Clusters Using Asynchronous Replication

ClusterControl can help you to deploy two clusters connected using asynchronous replication. When you have a single MariaDB Cluster deployed, you want to ensure that one of the nodes has binary logs enabled. This will allow you to use that node as a master for the second cluster that we will create shortly.

Deploying MariaDB Clusters Using Asynchronous Replication

Once the binary log has been enabled, we can use Create Slave Cluster job to start the deployment wizard.

Deploying MariaDB Clusters Using Asynchronous Replication

We can either stream the data directly from the master or you can use one of the backups to provision the data.

Deploying MariaDB Clusters Using Asynchronous Replication

Then you are presented with a standard cluster deployment wizard where you have to pass SSH connectivity details.

Deploying MariaDB Clusters Using Asynchronous Replication

You will be asked to pick the vendor and version of the databases as well as asked for the password for the root user.

Deploying MariaDB Clusters Using Asynchronous Replication

Finally, you are asked to define nodes you would like to add to the cluster and you are all set.

Deploying MariaDB Clusters Using Asynchronous Replication

When deployed, you will see it on the list of the clusters in the ClusterControl UI.

Deploying Multi-Cloud MariaDB Cluster

As we mentioned earlier, another option to deploy MariaDB Cluster would be to use separate segments when adding nodes to the cluster. In the ClusterControl UI you will find an option to “Add Node”:

Deploying Multi-Cloud MariaDB Cluster

When you use it, you will be presented with following screen:

Deploying Multi-Cloud MariaDB Cluster

The default segment is 0 so you want to change it to a different value.

After nodes have been added you can check in which segment they are located by looking at the Overview tab:

Deploying Multi-Cloud MariaDB Cluster

Conclusion

We hope this short blog gave you a better understanding of the options you have for multi-cloud MariaDB Cluster deployments and how they can be used to ensure high availability of your database infrastructure.

A Guide to Database Backup Archiving in the Cloud

$
0
0

Having a backup plan is a must when running a database in production. Running a backup every day, however, can eventually lead to an excess of backup storage space, especially when running on premises. 

One popular option is to store the backup files in the cloud. When it comes to cloud storage, we don’t need to be worried if the disk is exhausted as the cloud object storage is unlimited. Disaster recovery best practices recommend that backups should be stored offsite. While cloud storage is unlimited there are still concerns about the cost, as the pricing is based on the size of the backup file.

In this blog, we will discuss backup archiving in the cloud and how to implement a proper backup policy and ultimately save costs.

What is Object Storage in the Cloud?

Object storage is a data storage architecture that stores the data as objects. This is different when compared to other storage systems which manage the data as a file system or block storage which manages the data as evenly sized blocks of data. There are several types of storage based on how users access their data, which are...

  • Hot storage, the data need to be accessible instantaneously.
  • Cool storage, the data is accessed more infrequently.
  • Cold storage, the data archival storage, which is rarely accessed.

AWS has an object storage service platform called the S3 (Simple Storage Service). It is a platform for storing object files in a highly scalable way. Data is durable and provides relatively fast access. You can store and retrieve any kind of data. It is used for data that requires infrequent access. Another platform offered by AWS is S3 Glacier, which offers cold storage of data. It is ideal for storing older database backups.

GCP (Google Cloud Platform) also provides an object storage service called GCS (Google Cloud Storage). There are several types of cloud storage based on how often the data is accessed, they are: Standard (used for highly frequent access), Nearline (used for data accessed less than once a month), Coldline (used for data accessed less than once a quarter), and Archive (used for data accessed less than once a year).

Azure provides three different access tiers called Azure Blob Storage. Hot Storage is always readily available and accessible. Cool Storage is for infrequently accessed data and Archive storage is used for rarely accessed data.

The colder the storage, the lower the cost.

Creating a Backup Archival Policy

ClusterControl supports backups to the cloud which currently supports three cloud providers (AWS, Google Cloud Platform, and Azure). For more cloud provider options, we also have our Backup Ninja tool. 

ClusterControl also supports having a backup retention policy in the cloud. This allows you to determine how long you want to keep the backup database which is stored in the object storage. You can configure the retention policy in Backup Settings as shown below.

It will remove the backup that is stored in object storage. This backup retention policy can be combined with the archiving of the database backup that is stored in object storage on each cloud provider. 

AWS has lifecycle management for archiving database backup from S3 to Glacier, to enable the archiving policy, you need to add lifecycle rules in Management Lifecycle for your S3 bucket. 

Fill the rule name and add the prefix or tag the filter, after that click Next, and you need to choose the Object creation transition and Days after creation. 

The configuration of expiration is used to expire and delete the object after N days of its creation.

The last thing is to review your lifecycle rules, if it is already correct. After  that you can save the Rules.

So now, you have Lifecycle Policy Rules for your AWS S3 bucket to Glacier.

Google Cloud Platform has “Object Lifecycle Management” to enable the Lifecycle rule. Go to the bucket,

Choose the Lifecycle tab, then the lifecycle rules page will appear as shown below...

You can click the “Add A Rule” on the page and it will display the configuration page for the Action and Object Condition to be archived. There are four actions (as we already mentioned) are Nearline, Coldline, Archive, or Delete the object.

Choose the object conditions you want to configure based on your requirement to meet the selected conditions. You can choose based on Age, Created on or before, Storage class matches, Number of newer version, or Live state.

Then the new rule will be created in Lifecycle object management. This rule may take up for 24 hours to take effect.

Azure Cloud has features for managing Azure Blob Storage lifecycle. You can go through Storage Account, choose your bucket as shown below...

Then click Lifecycle Management, after that you will be prompted to a page for Lifecycle Management.

Add a new rule, to define your archiving rule in the Storage Account.

Fill in your rule name, must be letter and numeric. Enabled the status, and chose the action needed to take and fill the Days after last modification. There are 3 options; move the blob data to cool storage, move blob data to archive storage and delete the blob data. After that, click Next: Filter Set.

In the Filter Set, you can define the path for your virtual folder prefix. And then click Next: Review + Add

This page contains information that you had defined previously, the Action Set and Filter Set. You just need to click the Add button at the bottom and it will add a new rule in your Lifecycle Management.

The lifecycle management policy in your cloud will let you transition your database backup into a cooler storage tier, and delete your backup object storage at the end of the life cycle.

Conclusion

Combining retention policy and archiving rules in S3/object storage is essential for your backup strategies. It reduces your cloud storage costs, while allowing you to store your historical backups.


The Battle of the NoSQL Databases - Comparing MongoDB & MSSQL's NoSQL Functions

$
0
0

It is a well-known fact that MSSQL databases have ruled the world of data technologies and have been the primary source of data storage for over four decades. Generally, the MSSQL database is used mainly for accessing relational databases. MSSQL ruled the segment, but as the Web development market paced up, there came a shift towards the usage of open source databases like MySQL, PostgreSQL, etc. But MSSQL was still the first choice. Soon enough, data started growing exponentially, and scalability became a major issue; at that time, NoSQL rolled in to save the day. NoSQL (derived from "Not only SQL") is the name given to a type of database that can host non-relational, unstructured data. It means data in a NoSQL database does not necessarily exist in fixed-length columns and rows like it does in a relational database and can be highly unstructured. This type of database comes with built-in high-availability and fast performance features. Applications using NoSQL databases are less concerned about entity relationship, transactional consistency, or data duplication.

MongoDB is a NoSQL database that made a deep proliferation over the last decade or so, fueled by the explosive growth of the web and mobile applications running in the cloud. This new breed of internet-connected applications demands fast, fault-tolerant and scalable schema-less data storage which NoSQL databases can offer. MongoDB uses JSON to store data like documents that can vary in structure offerings, a dynamic, flexible schema. MongoDB designed for high availability and scalability with auto-sharding. MongoDB is one of the popular open-source databases that arise under the NoSQL database, which is used for high volume data storage. In MongoDB, the rows known as documents don’t require to have a schema defined beforehand. The fields will be created on the fly.  The data model available within MongoDB allows hierarchical relationships representation, to store arrays, and other more complex structures more efficiently.

 High-Level Differences Between MongoDB & MSSQL

MongoDB (NoSQL Database )

MSSQL Database

MongoDB database is a non-relational or distributed database.

MSSQL database is a relational database (RDBMS).

Relatively young technology.

An old and mature technology.

MongoDB database based on documents, key-value pairs, graphs, or columns, and they don’t have to stick to standard schema definitions.

MSSQL database is a table based in the form of rows & columns and must strictly adhere to standard schema definitions. They are a better option for applications that need multi-row transactions.

MongoDB has a dynamic schema for unstructured data. Data can be flexibly stored without having a predefined structure.

MSSQL has a well-designed pre-defined schema for structured data.

MongoDB database favors denormalized schema.

MSSQL databases favor normalized schema.

MongoDB is much cheaper to scale when compared to relational databases.

MSSQL is costly to scale.

MongoDB database is horizontally scalable. It can be scaled by adding more servers to the infrastructure to manage a large load and lessen the heap.

MSSQL database is vertically scalable. It can be scaled by increasing the hardware capacity (CPU, RAM, SSD, etc.) on a single server.

MongoDB has some limitations to fit for complex queries as there is no standard interface in MongoDB for handling queries. The queries in MongoDB are not as powerful as SQL queries. It is called UnQL, and the syntax for using the Unstructured query language will vary from syntax to syntax.

MSSQL is suitable to fit for complex queries as SQL has a standard interface for handling queries.

The syntax of SQL queries is fixed.

MongoDB database suits best for hierarchical data storage as it follows the key-value pair method for storing the data.

MSSQL database does not suit well for hierarchical data storage.

They are classified based on the way they store data as a key-value store, document store, graph store, column store, and XML store.

From a commercial perspective, the MSSQL database is not open-source or closed source.

MongoDB database is compliant with the Brewers CAP theorem (Consistency, Availability, and Partition tolerance).

MSSQL database is compliant with ACID properties (Atomicity, Consistency, Isolation & Durability).

New data can be easily inserted in the MongoDB database as it does not require any prior steps.

Adding new data in the MSSQL database requires some changes to be made, like backfilling data, altering schemas.

Only limited community support is available for MongoDB databases.

MSSQL database has excellent vendor support, and community support is available.

You can use MongoDB for a heavy transactional purpose. To store local data transactions that need not be very durable.

MSSQL Database best fit for high transaction-based applications.

MongoDB is suitable for hierarchical data storage and storing large data sets (E.g., Big Data).

MSSQL is not suitable for hierarchical data storage.

MongoDB is a document-oriented database and JSON is the native data type that stores its data in JSON file objects. It creates indexes on the collection level and supports indexes on any field or subfield of the documents in a MongoDB collection.

JSON support in MSSQL arrived in the 2016 release of the product. However, in contrast to the MongoDB database, SQL Server doesn’t include a native JSON datatype. It supports limited indexing capabilities and no native JSON indexes; just fulltext indexing.

In MongoDB, 'mongoimport'  and ‘mongoexport’  command-line tools are used to import and export the documents and insert or update in a MongoDB collection.

Some of common methods used to  import and export JSON data into MSSQL database :-

 
  • Using Integration Services

  • Using OPENROWSET() with OPENJSON() built-in function

Advantages of MongoDB

Having seen the excellent features of MongoDB, now every developer should be able to understand why it is better to use a NoSQL based database for developing big data transactions applications and for implementing a scalable model. Now, it's time to leave behind the schema definitions of MSSQL and get the advantage of using schema-less databases like MongoDB. The following are some of the vital advantages of MongoDB. 

Figure 1: Advantages of MongoDB

Distributed Data Platform

MongoDB assures new levels of availability and scalability, throughout geographically distributed data centers and cloud regions. With no downtime and without changing any code in an application, MongoDB scales elastically in terms of data volume and throughput. The technology gives you enough flexibility across various data centers with the right consistency.

Fast and Iterative Development

Frequent change of business requirements will not directly affect the success of any project delivery in any enterprise. A flexible data model with dynamic schema, command-line tools, and powerful GUI, helps the developers to build and evolve applications. Moreover, automated provisioning enables continuous integration and delivery for productive operations, whereas static relational schemas and complex procedures based RDBMS are now something from the past.

Flexible Data Model

MongoDB will store the data in a flexible JSON-like documents method, which allows data persistence and combining easily. The objects in the application code are mapped to the document model, due to which working with data becomes easy. The schema governance controls, complex aggregations, data access, and rich indexing functionality will not be compromised in any way. Without any downtime, one can modify the schema dynamically. This flexibility is an excellent advantage for a developer and less worry about data manipulation.

Reduced Total Cost of Ownership (TCO)

Application developers will be able to do their jobs better by using MongoDB. Costs become significantly very much lowered as MongoDB runs on commodity hardware. This technology allows an on-demand, pay-as-you-go pricing model with annual subscriptions, which comes with 24/7 global support.

Integrated Feature Set

MongoDB used in the development of a variety of real-time applications such as event-driven streaming data pipelines, analytics with data visualization, text, and geospatial search, graph processing, in-memory performance, and global replication reliably and securely. For any RDBMS to accomplish this, there require additional complex technologies, along with separate integration requirements.

Conclusion

In today's database, MongoDB is gaining large popularity as a NoSQL database and becoming a real game-changer in the IT arena. MongoDB is an excellent choice for businesses that have rapid growth or databases with no clear schema definitions (i.e., you have a lot of unstructured data). Moreover, it has numerous benefits, including lower cost, open-source availability, and easier scalability, which makes MongoDB an appealing choice for anyone thinking about integrating with Big Data. Even though MongoDB is a young technology compared to MSSQL, however, which makes them slightly more volatile.

PostgreSQL Load Balancing with HAProxy

$
0
0

1. Introduction

Applications typically connect to a database cluster by opening connections on one of the database nodes in order to run transactions. If the database node fails, the client would need to promote another database node and configure the application to connect it before it can continue to serve requests.

There are different ways to provide connectivity to one or more PostgreSQL database servers. One way is to use a database driver that supports connection pooling, load balancing, and failover for example:

Another solution is to use a load balancer between the clients and the database cluster.

This tutorial will walk you through on how to deploy, configure, and manage PostgreSQL load balancing with HAProxy using ClusterControl.

You might also want to view these 2 webinar replays:

How to set up SQL Load Balancing with HAProxy

Performance Tuning of HAProxy for Database Load Balancing

2. What is HAProxy?

HAProxy stands for High Availability Proxy, and is a great software-based TCP/HTTP load balancer. It distributes a workload across a set of servers to maximize performance and optimize resource usage. HAProxy is built with sophisticated and customizable health checks methods, allowing a number of services to be load balanced in a single running instance.

A front-end application that relies on a database backend can easily over-saturate the database with too many concurrent running connections. HAProxy provides queuing and throttling of connections towards one or more PostgreSQL Servers and prevents a single server from becoming overloaded with too many requests. All clients connect to the HAProxy instance, and the reverse proxy forwards the connection to one of the available PostgreSQL Servers based on the load-balancing algorithm used.

One possible setup is to install an HAProxy on each web server (or application server making requests on the database). This works fine if there are only a few web servers, so as the load introduced by the health checks is kept in check. The web server would connect to the local HAProxy (e.g. making a psql connection on 127.0.0.1:5432), and can access all the database servers. The Web and HAProxy together form a working unit, so the web server will not work if the HAProxy is not available.

With HAProxy in the load balancer tier, you will have following advantages:

  • All applications access the cluster via one single IP address or hostname. The topology of the database cluster is masked behind HAProxy.
  • PostgreSQL connections are load-balanced between available DB nodes.
  • It is possible to add or remove database nodes without any changes to the applications.
  • Once the maximum number of database connections (in PostgreSQL) is reached, HAProxy queues additional new connections. This is a neat way of throttling database connection requests and achieves overload protection.

ClusterControl supports HAProxy deployment right from the UI and CLI, and by default it supports three load-balancing algorithms - roundrobin, leastconn, or source. We recommend users to have HAProxy in between clients and a pool of database servers.

3. Health Checks for PostgreSQL

It is possible to have HAProxy check that a server is up by just making a connection to the PostgreSQL port (usually 5432) however, this is not good enough. The instance might be up, but the underlying storage engine might not be working as it should be. There are specific checks that need to be passed, depending on which database technology we are using.

3.1. Health Check Script

The best way to perform PostgreSQL health check is by using a custom shell script which determines whether a PostgreSQL server is available by carefully examining its internal state which depends on the clustering solution used. By default, ClusterControl provides its own version of health check script called postgreschk, resides on each PostgreSQL server in the load balancing set and has ability to return an HTTP response status and/or standard output (stdout) which is useful for TCP health check.

3.1.1. postgreschk for PostgreSQL

If the backend PostgreSQL server is healthy, then the script will return a simple HTTP 200 OK status code with exit status 0. Else, the script will return 503 Service unavailable and exit status 1. Using xinetd is the simplest way to get the health check script executed by making it daemonized and listening to a custom port (default is 9201). HAProxy will then connect to this port and request for a health check output. If the health check method is httpchk, HAProxy will look for the HTTP response code and if the method is tcp-check, it will look for the expected string (as shown in section 3.2.3).

The template file is located at /usr/share/cmon/templates/postgreschk on the ClusterControl server. This postgreschk script is automatically installed by ClusterControl on each PostgreSQL node participating in the load balancing set.

Setting up HAProxy for PostgreSQL allows you to split the traffic in two different HAProxy listeners e.g, port 5433 for writes to the primary node and port 5434 for reads to all available standby nodes (including primary). In this case, the template is located at/usr/share/cmon/templates/postgreschk_rw_split on the ClusterControl server. We have covered this in this blog post

Other than HAProxy, you can now use your favorite reverse proxy to load balance requests across PostgreSQL nodes, namely:

  • nginx 1.9 (--with-stream)
  • keepalived
  • IPVS
  • distributor
  • pen

This health check script is out of the scope of this tutorial since it is built for TCP-load balancers (other than HAProxy) with limited health check capabilities to monitor the backend PostgreSQL nodes correctly.

3.2. Health Check Methods

HAProxy determines if a server is available for request routing by performing so called health checks. HAProxy supports several backend health check methods usable to PostgreSQL through the following options:

  • pgsql-check
  • tcp-check
  • httpchk

3.2.1. pgsql-check

The check sends a PostgreSQL StartupMessage and waits for either Authentication request or ErrorResponse message. It is a basic but useful test which does not produce error nor aborted connection on the server.

Take note that this does not check database presence nor database consistency. To do this, we must use an external check (via xinetd) which is explained in the next section.

3.2.2. tcp-check

By default, if "check" is set, the server is considered available when it’s able to accept periodic TCP connections. This is not robust enough for a database backend, since the database server might be able to respond to connection requests while being in a non-operational state. The instance might be up, but the underlying storage engine might not be working properly. Also, there are specific checks that need to be done, depending on the database technology that you are using.

postgreschk script provided by ClusterControl supports returning HTTP status code and standard output (stdout). By utilizing the stdout in xinetd, we can extend the tcp-check capability to make it more accurate with the PostgreSQL node status. The following example configuration shows the usability of it:

listen  haproxy_192.168.100.134_5434_ro

        bind *:5434

        mode tcp

        timeout client  10800s

        timeout server  10800s

        tcp-check connect port 9201

        tcp-check expect string is\ running

        balance leastconn

        option tcp-check

        default-server port 9201 inter 2s downinter 5s rise 3 fall 2 slowstart 60s maxconn 64 maxqueue 128 weight 100

        server 192.168.100.135 192.168.100.135:5433 check

        server 192.168.100.142 192.168.100.142:5432 check

The above configuration lines tell HAProxy to perform health checks using TCP send/expect sequence. It connects to port 9201 of the database and expects a string that contains “is\ running” (backslash is used to escape whitespace). To verify the postgreschk output through xinetd port 9201, perform telnet to the database node on HAProxy node:

$ telnet 192.168.100.135 9201

Trying 192.168.100.135...

Connected to 192.168.100.135.

Escape character is '^]'.

HTTP/1.1 200 OK

Content-Type: text/html

Content-Length: 56


<html><body>PostgreSQL master is running.</body></html>


Connection closed by foreign host.

You can use a similar configuration for checking the PostgreSQL primary node, where the expected string for master is “master\ is\ running”.

ClusterControl defaults to use httpchk as described in the next section.

3.2.3. httpchk

Option httpchk uses HTTP protocol to check on the server's health. This is common if you want to load balance an HTTP service, where HAProxy ensures the backend returns specific HTTP response codes before routing the incoming connections. This option does not necessarily require an HTTP backend, it also works with plain TCP backends. Using httpchk is the preferred option whenever possible since it utilizes less resources with stateless HTTP connection.

listen  haproxy_192.168.100.134_5433_rw

        bind *:5433

        mode tcp

        timeout client  10800s

        timeout server  10800s

        balance leastconn

        option httpchk

        option allbackups

        default-server port 9201 inter 2s downinter 5s rise 3 fall 2 slowstart 60s maxconn 64 maxqueue 128 weight 100

        server 192.168.100.135 192.168.100.135:5433 check

        server 192.168.100.142 192.168.100.142:5432 check

The example above tells us that HAProxy will connect to port 9201, where xinetd is listening on the database servers. HAProxy will look for an expected HTTP response code. The postgreschk script will return either “HTTP 200 OK” if the server is healthy, otherwise, “HTTP 503 Service not available”.

4. Failure Detection and Failover

When a database node fails, the database connections that have been opened on that node will also fail. It is important that HAProxy does not redirect new connection requests to the failed node.

There are several user defined parameters that determine how fast HAProxy will be able to detect that a server is not available. The following is the example HAProxy configuration deployed by ClusterControl located at /etc/haproxy/haproxy.cfg:

listen  haproxy_192.168.100.134_5433_rw

        bind *:5433

        mode tcp

        timeout client  10800s

        timeout server  10800s

        balance leastconn

        option httpchk

        default-server port 9201 inter 2s downinter 5s rise 3 fall 2 slowstart 60s maxconn 64 maxqueue 128 weight 100

        server 192.168.100.135 192.168.100.135:5433 check

        server 192.168.100.142 192.168.100.142:5432 check

Quick explanation for each line above:

  • listen: Listen section defines a complete proxy with its frontend and backend parts combined in one section. It is generally useful for TCP-only traffic. Specify the HAproxy instance name next to it. The next line describing the section must be indented.
  • bind: Bind to all IP addresses on this host on port 5433. Your clients will have to connect to the port defined in this line.
  • mode: Protocol of the instance. For PostgreSQL, the instance should work in pure TCP mode. A full-duplex connection will be established between clients and servers, and no layer 7 examination will be performed.
  • timeout client: Maximum inactivity time in the client side. It’s recommended to keep the same value with a timeout server for predictability.
  • timeout server: Maximum inactivity time on the server side. It’s recommended to keep the same value with a timeout client for predictability.
  • balance: Load balancing algorithm. ClusterControl is able to deploy leastconn, roundrobin, and source, though you can customize the configuration at a later stage. Using leastconn is the preferred option so that the database server with the lowest number of connections receives the connection. If the database servers have the same number of connections, then roundrobin is performed to ensure that all servers are used.
  • option httpchk: Perform HTTP-based health check instead. ClusterControl configures an xinetd script on each backend server in the load balancing set which returns HTTP response code.
  • default-server: Default options for the backend servers listed under server option.
  • port: The backend health check port. ClusterControl configures an xinetd process listening on port 9201 on each of the database nodes running a custom health check script.
  • inter: The interval between health checks for a server that is "up", transitionally "up or down", or not yet checked is 2 seconds.
  • downinter: The down interval is 5 seconds when the server is 100% down or unreachable.
  • rise: The server will be considered available after 3 consecutive successful health checks.
  • fall: The server will be considered down/unavailable after 2 consecutive unsuccessful health checks.
  • slowstart: In 60 seconds, the number of connections accepted by the server will grow from 1 to 100% of the usual dynamic limit after it gets back online.
  • maxconn: HAProxy will stop accepting connections when the number of connections is 64.
  • maxqueue: The maximal number of connections which will wait in the queue for this server. If this limit is reached, next requests will be redispatched to other servers instead of indefinitely waiting to be served.
  • weight: In general, all nodes are usually treated equally. So setting it to 100 is a good start.
  • server: Define the backend server name, IP address, port, and server’s options. We enabled health check by using the check option on each of the servers. The rest options are the same as under default-server.

From the above configurations, the backend PostgreSQL server fails at health checks when:

  • HAProxy was unable to connect to port 9201 of the PostgreSQL server
  • If 9201 is connected, the HTTP response code sent by PostgreSQL server returns other than HTTP/1.1 200 OK (option httpchk)

Whereby, the downtime and uptime chronology would be:

  1. Every 2 seconds, HAProxy performs a health check on port 9201 of the backend server (port 9201 inter 2s).
  2. If the health check fails, the fall count starts and it will check for the next failure. After 5 seconds, if the second try still fails, HAProxy will mark the PostgreSQL server as down (downinter 5s fall 2).
  3. The PostgreSQL server is automatically excluded from the list of available servers.
  4. Once the PostgreSQL server gets back online, if the health check succeeds, the rise count starts and it will check if the next consecutive attempt is succeeded. If the count reaches 3, the server will be marked as available (rise 3).
  5. The PostgreSQL server is automatically included into the list of available servers.
  6. The PostgreSQL server starts to accept the connections gradually for 60 seconds (slowstart 60s).
  7. The PostgreSQL server is up and fully operational.

5. Read/Write Splitting with HAProxy

HAProxy as PostgreSQL load balancer works similarly to a TCP forwarder, which operates in the transport layer of TCP/IP model. It does not understand the SQL queries (which operate in the higher layer) that it distributes to the backend PostgreSQL servers. Operating in the transport layer also consumes less overhead compared to database-aware load balancer/reverse proxy like MaxScale or ProxySQL for MySQL or MariaDB databases, or even Pgpool-II for PostgreSQL.

The problem is that as PostgreSQL doesn’t support multiple writable servers in a native way, if a standby server receives write traffic, that will be a problem, so the best here is to split the read and write traffic in two different listeners.

Writes must be forwarded only to a primary node, while reads can be forwarded to all standby nodes (and also primary).

To make HAProxy capable of handling reads and writes separately, one must:

  • Configure health checks for PostgreSQL Replication. The health check script must be able to:
    • Report the replication role (primary, standby, or none)
    • Must be accessible by HAProxy (configured via xinetd or forwarding port)
  • Create two HAProxy listeners, one for read and one for write:
    • Read listener - forward to all standby nodes (or primary) to handle reads
    • Write listener - forward writes to a primary node
  • Instruct your application to send reads/writes to the respective listener:
    • Build/Modify your application to have ability to send reads and writes to the respective listeners
    • Use an application connector which supports built-in read/write splitting

6. Integration with ClusterControl

ClusterControl integrates with HAProxy to ease up deployment and management of the load balancer. It is also possible to add an existing/already deployed HAProxy instance into ClusterControl, so you can monitor and manage it directly from ClusterControl UI together with the database nodes.

To deploy it, you just need to go to ClusterControl -> Cluster Actions -> Add Load Balancer -> HAProxy tab and enter the required information:

  • Server Address: IP address or hostname of HAProxy node. ClusterControl must be able to connect via passwordless SSH.
  • Listen Port (Read/Write): Port that HAProxy instance will listen to. This port will be used to connect to the load-balanced write PostgreSQL connections.
  • Listen Port (Read-Only): Port that HAProxy instance will listen to. This port will be used to connect to the load-balanced Read PostgreSQL connections.
  • Policy: Load balancing algorithm. Supported values are:
    • leastconn - The server with the lowest number of connections receives the connection.
    • roundrobin - Each server is used in turns, according to their weights.
    • source - The client IP address is hashed and divided by the total weight, so it will always reach the same server as long as no server goes down or up.
  • Build from Source: The latest available source package will be used:
    • ClusterControl will compile the latest available source package downloaded from http://www.haproxy.org/#down.
    • This option is only required if you intend to use the latest version of HAProxy or if you are having problems with the package manager of your OS distribution. Some older OS versions do not have HAProxy in their package repositories.
  • Overwrite Existing /usr/local/sbin/postgreschk on targets: If the postgreschk script is already there, overwrite it for this deployment. If you have adjusted the script to suit your needs, you might need to uncheck this.
  • Disable Firewall?: If you want ClusterControl to disable the firewall in the HAProxy node.
  • Disable SELinux/AppArmor?: If you want ClusterControl to disable SELinux (RedHat-Based OS) or AppArmor (Debian-Based OS) in the HAProxy node.
  • Show Advanced Settings:
  • Stats Socket: UNIX socket file location for various statistics outputs. Default is /var/run/haproxy.socket and it’s recommended not to change this.
  • Admin Port: Port for HAProxy admin-level statistic page. Default is 9600.
  • Admin User: Admin user when connecting to the statistics page.
  • Admin Password: Password for Admin User
  • Backend Name: The listener name for the backend without whitespace.
  • Timeout Server (seconds): Maximum inactivity time on the server side.
  • Timeout Client (seconds): Maximum inactivity time on the client side.
  • Max Connections Frontend: Maximum per-process number of concurrent connections for the frontend.
  • Max Connection Backend per instance: Limit the number of connections that can be made from HAProxy to each PostgreSQL Server. Connections exceeding this value will be queued by HAProxy. A best practice is to set it to less than the PostgreSQL’s max_connections parameter to prevent connections flooding.
  • xinetd allow connections from: Only allow this network to connect to the health check script on PostgreSQL server via xinetd service
  • Server Instances: List of PostgreSQL servers in the cluster.
  • Include: Include the server in the load balancing set.
  • Role: Choose whether the node is Active or Backup. In Backup mode, the server will be only used in load balancing when all other Active servers are unavailable.

Once the dialog is filled up, click on Deploy HAProxy’ button to trigger the deployment job.

ClusterControl will perform the following tasks when the deployment job is triggered:

  1. Installs helper packages
  2. Tunes the TCP stack of the instance
  3. Copies and configures postgreschk script (from template) on every PostgreSQL node
  4. Installs and configures xinetd at /etc/xinetd.d/postgreschk
  5. Registers HAProxy node into ClusterControl

You can monitor the deployment progress under the ClusterControl Activity Section, similar to example below:

By default, the HAProxy server will listen on both 5433 (writes) and 5434 (reads) ports for connections. In this example, the HAProxy host IP address is 192.168.100.133. You can connect your applications to 192.168.100.133:5433 or 192.168.100.133:5434 and requests will be load balanced on the backend PostgreSQL Servers.

Do not forget to GRANT access from the HAProxy server to the PostgreSQL Servers (database user creation and pg_hba.conf file), because the PostgreSQL Servers will see the HAProxy making the connections, not the Application server(s) itself. In the example above, issue on the PostgreSQL Servers the access rights you wish.

  • User creation:
CREATE USER admindb WITH PASSWORD 'Password' LOGIN;
GRANT SELECT ON ALL TABLES IN SCHEMA public TO admindb;
GRANT SELECT ON ALL SEQUENCES IN SCHEMA public TO admindb;
ALTER ROLE admindb WITH SUPERUSER;
  • Pg_hba.conf configuration file:
host    all             admindb          192.168.100.133/32      md5

The HAProxy process will be managed by ClusterControl, and is automatically restarted if it fails.

7. HAProxy Redundancy with Keepalived

Since all applications will be depending on HAProxy to connect to an available database node, to avoid a single point of failure with your HAProxy, one would set up two identical HAProxy instances (one active and one standby) and use Keepalived to run VRRP between them. VRRP provides a virtual IP address to the active HAProxy, and transfers the Virtual IP to the standby HAProxy in case of failure. This is seamless because the two HAProxy instances need no shared state.

By adding Keepalived into the picture, our infrastructure will now look something like this:

In this example, we are using two nodes to act as the load balancer with IP address failover in front of our database cluster. Virtual IP (VIP) address will be floating around between HAProxy #1 (master) and HAProxy #2 (backup). When HAProxy #1 goes down, the VIP will be taking over by HAProxy #2 and once the HAProxy #1 up again, the VIP will be failback to HAProxy #1 since it holds the higher priority number. The failover and failback process is automatic, controlled by Keepalived.

You need to have at least two HAProxy instances in order to install Keepalived. Use “Deploy HAProxy” to install another HAProxy instance and then go to ClusterControl -> Cluster Actions -> Add Load Balancer -> Keepalived tab to deploy or add existing Keepalived instance, as shown in the following screenshot:

Take note that your network environment supports VRRP (IP protocol 112) for health check communication between two nodes. It’s also possible to let Keepalived run in a non-multicast environment by configuring unicast, which will be used by default by ClusterControl if Keepalived installed is version 1.2.8 and later.

For more details on how ClusterControl configures Keepalived and what to expect from the failover and failback, see this blog post.

8. HAProxy Statistics

Other than deployment and management, ClusterControl also provides insight into HAProxy statistics from the UI. From ClusterControl, you can access the statistics page at ClusterControl -> Select Cluster -> Nodes -> choose the HAProxy node similar to screenshot below:

You can enable/disable a server from the load balancing by ticking/unticking the checkbox button under “Enabled” column. This is very useful when you want your application to intentionally skip connecting to a server e.g., for maintenance or for testing and validating new configuration parameters or optimized queries.

It’s also possible to access the default HAProxy statistics page by connecting to port 9600 on the HAProxy node. Following screenshot shows the example when connecting to http://[HAProxy_node_IP_address]:9600/ with default username and password “admin”:

Based on the table legend, the green rows indicate that the servers are available, while red indicates down. In this case, the red node is in fact waiting to become master if needed, as it is the read/write port which only has the current primary node as online. If you take a look at the read only port, you can see the same node up, available to receive traffic in this port.

When a server becomes available, you should notice the throttling part (last column) where “slowstart 60s” kicks in. This server will receive gradual connections where the weight is dynamically adjusted for 60 seconds before it reaches the expected weight (weight 100):

Tutorials Image: 

Eliminating MySQL Split-Brain in Multi-Cloud Databases

$
0
0

These days databases spanning across multiple clouds are quite common. They promise high availability and possibility to easily implement disaster recovery procedures. They are also a method to avoid vendor lock-in: if you design your database environment so it can operate across multiple cloud providers, most likely you are not tied to features and implementations specific to one particular provider. This makes it easier for you to add another infrastructure provider to your environment, be it another cloud or on-prem setup. Such flexibility is very important given there is fierce competition between cloud providers and migrating from one to another might be quite feasible if it would be backed by reducing expenses.

Spanning your infrastructure across multiple datacenters (from the same provider or not, it doesn’t really matter) brings serious issues to solve. How can one design the entire infrastructure in a way that the data will be safe? How to deal with challenges that you have to face while working in a multi-cloud environment? In this blog we will take a look at one, but arguably the most serious one - potential of a split-brain. What does it mean? Let’s dig a bit into what split-brain is.

What is “Split-Brain”?

Split-brain is a condition in which an environment that consists of multiple nodes suffers network partitioning and has been split into multiple segments that do not have contact with each other. The simplest case will look like this:

What is “Split-Brain”

We have two nodes, A and B, connected over a network using bi-directional asynchronous replication. Then the network connection is cut between those nodes. As a result, both nodes cannot connect to each other and any changes executed on node A can’t be transmitted to node B and vice versa. Both nodes, A and B, are up and accepting connections, they just cannot exchange data. This may lead to serious issues as the application may make changes on both nodes expecting to see the full state of the database while, in fact, it operates only on a partially known data state. As a result, incorrect actions may be taken by the application, incorrect results may be presented to the user and so on. We think it’s clear that split-brain is potentially a very dangerous condition and one of the priorities would be to deal with it to some extent. What can be done about it?

How to Avoid Split-Brain

In short, it depends. The main issue to deal with is the fact that nodes are up and running but do not have connectivity between them therefore they are unaware of the state of the other node. In general, MySQL asynchronous replication does not have any sort of mechanism that would internally solve the problem of the split-brain. You can try to implement some solutions that help you to avoid split-brain but they come with limitations or they still do not fully solve the problem.

When we venture away from the asynchronous replication, things are looking differently. MySQL Group Replication and MySQL Galera Cluster are technologies that benefit from build-it cluster awareness. Both those solutions maintain the communication across nodes and ensure that the cluster is aware of the state of the nodes. They implement a quorum mechanism that governs if clusters can be operational or not.

Let’s discuss those two solutions (asynchronous replication and quorum-based clusters) in more detail.

Quorum-based Clustering

We are not going into discussing the implementation differences between MySQL Galera Cluster and MySQL Group Replication, we will focus on the basic idea behind the quorum-based approach and how it is designed to solve the problem of the split-brain in your cluster.

The bottom line is that: cluster, to operate, requires the majority of its nodes to be available. With this requirement we can be sure that the minority can never really affect the rest of the cluster because the minority should not be able to perform any actions. This also means that, in order to be able to handle a failure of one node, a cluster should have at least three nodes. If you have two nodes only:

How to Avoid Split-Brain

When there is a network split, you end up with two parts of the cluster, each consisting of exactly 50% of the total nodes in the cluster. Neither of these parts has a majority. If you have three nodes, though, things are different:

How to Avoid Split-Brain

Nodes B and C have the majority: that part consists of two nodes out of three thus it can continue to operate. On the other hand, node A represents only the 33% of the nodes in the cluster thus it does not have a majority and it will cease to handle traffic to avoid the split brain.

With such implementation, split-brain is very unlikely to happen (it would have to be introduced through some weird and unexpected network states, race conditions or plainly bugs in the clustering code. While not impossible to encounter such conditions, using one of the solutions that are quorum-based is the best option to avoid the split-brain that exists at this moment.

Asynchronous Replication

While not the ideal choice when it comes to dealing with split-brain, asynchronous replication is still a viable option. There are several things you should consider before implementing a multi-cloud database with asynchronous replication.

First, failover. Asynchronous replication comes with one writer - only master should be writable and other nodes should only serve read-only traffic. The challenge is how to deal with the master failure?

How to Avoid Split-Brain

Let’s consider setup as on the diagram above. We have two cloud providers, two nodes in each. Provider A hosts also the master. What should happen if the master fails? One of the slaves should be promoted to ensure that database will continue to be operational. Ideally, it should be an automated process to reduce the time needed to bring the database to the operational state. What would happen, though, if there would be a network partitioning? How are we expected to verify the state of the cluster?

How to Avoid Split-Brain

Here’s the challenge. Network connectivity is lost between two cloud providers. From the standpoint of the nodes C and D both node B and master, node A are offline. Should node C or D be promoted to become a master? But the old master is still up - it did not crash, it is just not reachable over the network. If we would promote one of nodes located at the provider B, we’ll end up with two writable masters, two data sets and split brain:

How to Avoid Split-Brain

This is definitely not something that we want. There are a couple of options here. First, we can define failover rules in a way that the failover may happen only in one of the network segments, where the master is located. In our case it would mean that only node B could be automatically promoted to become a master. That way we can ensure that the automated failover will happen if the node A is down but no action will be taken if there is a network partitioning. Some of the tools that can help you handle automated failovers (like ClusterControl) support white and blacklists, allowing users to define which nodes can be considered as a candidate to failover to and which should never be used as masters.

Another option would be to implement some sort of a “topology awareness” solution. For example, one could try to check the master state using external services like load balancers.

How to Avoid Split-Brain

If the failover automation could check the state of the topology as seen by the load balancer, it might be that the load balancer, located in a third location, can actually reach to both datacenters and make it clear that nodes in the cloud provider A are not down, they just cannot be reached from the cloud provider B. Such an additional layer of checks is implemented in ClusterControl.

Finally, whatever the tool you use to implement automated failover, it may also be designed so it is quorum-aware. Then, with three nodes across three locations, you can easily tell which part of the infrastructure should be kept alive and which should not.

How to Avoid Split-Brain

Here, we can clearly see that the issue is related only to the connectivity between providers A and B. Management node C will act as a relay and, as a result, no failover should be started. On the other hand, if one datacenter is fully cut off:

How to Avoid Split-Brain

It’s also pretty clear what happened. Management node A will report it cannot reach out to the majority of the cluster while management nodes B and C will form the majority. It is possible to build upon this and, for example, write scripts that will manage the topology according to the state of the management node. That could mean that the scripts executed in cloud provider A would detect that management node A does not form the majority and they will stop all database nodes to ensure no writes would happen in the partitioned cloud provider.

ClusterControl, when deployed in High Availability mode can be treated as the management nodes we used in our examples. Three ClusterControl nodes, on top of the RAFT protocol, can help you to determine if a given network segment is partitioned or not.

Conclusion

We hope this blog post gives you some idea about split-brain scenarios that may happen for MySQL deployments spanning across multiple cloud platforms.

Viewing all 1476 articles
Browse latest View live